email: mhenze@mpe.mpg.de 22institutetext: Departament de Física i Enginyeria Nuclear, EUETIB (UPC/IEEC), Comte d’Urgell 187, 08036 Barcelona, Spain 33institutetext: European Southern Observatory (ESO), D-85748 Garching, Germany 44institutetext: INAF-Napoli, Osservatorio Astronomico di Capodimonte, Salita Moiariello 16, I-80131 Napoli, Italy 55institutetext: International Centre for Relativistic Astrophysics, Piazzale della Repubblica 2, I-65122 Pescara, Italy 66institutetext: Institut de Ciències de l’Espai (CSIC-IEEC), Campus UAB, Fac. Ciències, E-08193 Bellaterra, Spain 77institutetext: Department of Physics and Astronomy, Clemson University, Clemson, SC 29634-0978, USA 88institutetext: Steward Observatory, 933 North Cherry Avenue, Tucson, AZ 85721, USA
The very short supersoft X-ray state of the classical nova M31N 2007-11a ††thanks: Partly based on observations with XMM-Newton, an ESA Science Mission with instruments and contributions directly funded by ESA Member States and NASA
Abstract
Context. Short supersoft X-ray source (SSS) states (durations 100 days) of classical novae (CNe) indicate massive white dwarfs that are candidate progenitors of supernovae type Ia.
Aims. We carry out a dedicated optical and X-ray monitoring program of CNe in the bulge of M 31.
Methods. We discovered M31N 2007-11a and determined its optical and X-ray light curve. We used the robotic Super-LOTIS telescope to obtain the optical data and XMM-Newton and Chandra observations to discover an X-ray counterpart to that nova.
Results. Nova M31N 2007-11a is a very fast CN, exhibiting a very short SSS state with an appearance time of 6–16 days after outburst and a turn-off time of 45–58 days after outburst.
Conclusions. The optical and X-ray light curves of M31N 2007-11a suggest a binary containing a white dwarf with 1.0 .
Key Words.:
Galaxies: individual: M 31 – novae, cataclysmic variables – stars: individual: Nova M31N 2007-11a – X-rays: galaxies1 Introduction
Classical novae (CNe) are thermonuclear explosions on the surface of white dwarfs (WDs) in cataclysmic binaries that result from the transfer of matter from the companion star to the WD. The transferred hydrogen-rich matter accumulates on the surface of the WD until hydrogen ignition starts a thermonuclear runaway in the degenerate matter of the WD envelope. The resulting expansion of the hot envelope causes the brightness of the WD to rise by a typical outburst amplitude of 12 magnitudes within a few days, and mass to be ejected at high velocities (see Hernanz 2005; Warner 1995, and references therein). However, a fraction of the hot envelope can remain in steady hydrogen burning on the surface of the WD (Starrfield et al. 1974; Sala & Hernanz 2005), powering a supersoft X-ray source (SSS) that can be observed directly once the ejected envelope becomes sufficiently transparent (Starrfield 1989; Krautter 2002). In this paper, we define the term “appearance of the SSS” from an observational point of view as the time when the SSS becomes visible to us, due to the decreasing opacity of the ejected material. This is not the same as the actual turn-on of the H-burning on the WD surface at the beginning of the thermonuclear runaway. The turn off of the SSS, on the other hand, does not suffer from extinction effects and clearly marks the actual turn off of the H-burning in the WD atmosphere and the disappearance of the SSS.
The duration of the supersoft phase is related to the amount of H-rich matter that is not ejected and on the luminosity of the white dwarf. More massive WDs need to accrete less matter to initiate the thermonuclear runaway, because of their higher surface gravity (Jose & Hernanz 1998). In general, more massive WDs retain less accreted mass after the explosion, although this also depends on the accretion rate, and reach higher luminosities (Yaron et al. 2005). Thus, the duration of the SSS state is inversely related to the mass of the WD. In turn, the transparency requirement mentioned above implies that the appearance time is determined by the fraction of mass ejected in the outburst (see Sala & Hernanz 2005; Tuchman & Truran 1998; Hachisu & Kato 2006). X-ray light curves therefore provide important clues to the physics of the nova outburst, addressing the key question of whether a WD accumulates matter over time to become a potential progenitor for a type Ia supernova (SN-Ia). The duration of the SSS state provides the only direct indicator of the post-outburst envelope mass in CNe. For massive WDs, the expected SSS phase is very brief ( 100 d) (Sala & Hernanz 2005; Tuchman & Truran 1998) and could have easily been missed in previous surveys (e.g. Supper et al. 2001; Williams et al. 2004; Pietsch et al. 2005b).
There are only a few novae with very short SSS states known. One of them is the well-studied galactic nova RS Oph. RS Oph is a recurrent nova (RN), which underwent its last outburst in 2006. X-ray observations documented a rapid decline in supersoft emission at days after the optical outburst and a duration of the SSS phase of days (Osborne et al. 2006; Hachisu et al. 2007). From theoretical models, Hachisu et al. (2007) estimated a WD mass of . RNe are classified by the observational fact that they have had more than one recorded outburst. These objects are very good candidates for SN-Ia progenitors, as RNe are believed to contain massive WDs. However, one of the problems with this RNe SN-Ia connection was their rare occurrence in optical surveys (Della Valle & Livio 1996). But hypothetical previous outbursts may have been missed, and then these objects were just classified as CNe in optical surveys. Interestingly, a very short SSS stage of a CN may indicate a very massive WD, which is capable of frequent outbursts, and thus is a potential RN.
Another example for a nova with short SSS state is the CN Nova LMC 2000, for which Greiner et al. (2003), based on non-detections of supersoft emission, suggest an SSS phase shorter than seven weeks. The work of Pietsch et al. (2007b) already discusses nova M31N 2004-11f as an object with a very short SSS state of 35–55 days. This nova is an RN.
This work presents the results of a new monitoring strategy tailored to CNe with short SSS states. We carried out combined XMM-Newton/Chandra monitoring of the central region of M 31 (distance 780 kpc, Holland 1998; Stanek & Garnavich 1998) from November 2007 to mid-February 2008. Individual observations were separated by just 10 days. Section 2 provides detailed information on the X-ray and optical data sets. Results are presented in Sect. 3 and discussed in Sect. 4.
2 Observations and data analysis
2.1 Optical data
The optical data used in this work were obtained with Super-LOTIS (Livermore Optical Transient Imaging System, Williams et al. 2008), a robotic 60 cm telescope equipped with an E2V CCD (2kx2k) located at Steward Observatory, Kitt Peak, Arizona, USA. Starting in October 2007, the telescope was used every good night to monitor the bulge of M 31. Using four Super-LOTIS fields (field of view: ), we covered an area of centered on the core of M 31. The pixel scale is 0.496″/pixel and the typical limiting magnitude is 19 mag, in Johnson R. The data were reduced by a semi-automatic routine and the astrometric and photometric calibration utilizes the M 31 part of the Local Group Survey (LGS, Massey et al. 2006). Typical values of Super-LOTIS astrometric and photometric accuracies are and 0.25 mag, respectively, averaged over the whole magnitude range.
2.2 X-ray data
The X-ray data were taken as part of our M 31 nova monitoring project111http://www.mpe.mpg.de/m31novae/xray/index.php using the Chandra High-Resolution Camera Imaging Detector (HRC-I) and the XMM-Newton European Photon Imaging Camera (EPIC) PN detector. The individual observations used here are summarized in Table 1, which lists the telescopes and instruments used, the observation identifications (ObsIDs), the dates, source count rates, and luminosities or upper limits. With the help of the mission count rate simulator PIMMS v3.9a, we computed the energy conversion factors needed to transform count rates into unabsorbed fluxes for the individual telescopes.
For XMM-Newton data we applied background screening and used the XMMSAS (XMM-Newton Science Analysis Software) v8.0 tasks eboxdetect and emldetect to detect sources in the image and perform astrometry and photometry. For computing upper limits, we added an artificial detection at the position of the source to the eboxdetect list. This list was used as input for emldetect (with fixed positions and likelihood threshold of zero) to derive the observed flux, or an upper limit, for all objects in the list.
We reduced the Chandra observations with the CIAO v3.4 (Chandra Interactive Analysis of Observations) software package. The source detection was done with the CIAO tool wavedetect, and an adapted version of the XMMSAS tool emldetect was used to estimate background-corrected and exposure-corrected fluxes and count rates for the detected sources. We applied an astrometric calibration to the object list for each individual observation using the X-ray source catalog of Kaaret (2002) to improve the astrometric accuracy of our measurements.
| Telescope/Instrument | ObsID | Exp. Timea | Start Date | Offsetb | Count Rate | L0.2-1.0 c |
|---|---|---|---|---|---|---|
| [ks] | [UT] | [d] | [ct s-1] | [erg s-1] | ||
| Chandra HRC-I | 8526 | 19.9 | 2007-11-07.64 | 5.89 | 8.7 | 4.0 |
| Chandra HRC-I | 8527 | 20.0 | 2007-11-17.76 | 16.01 | (17.4 1.1) | (8.1 0.5) |
| Chandra HRC-I | 8528 | 20.0 | 2007-11-28.79 | 27.04 | (4.3 0.5) | (2.0 0.2) |
| Chandra HRC-I | 8529 | 18.9 | 2007-12-07.57 | 35.82 | (4.7 0.5) | (2.2 0.2) |
| Chandra HRC-I | 8530 | 19.9 | 2007-12-17.49 | 45.29 | (3.0 0.4) | (1.4 0.2) |
| XMM-Newton EPIC PN | 0505720201 | 22.2 | 2007-12-29.57 | 57.80 | 8.7 | 2.7 |
| XMM-Newton EPIC PN | 0505720301 | 21.9 | 2008-01-08.29 | 67.53 | 3.0 | 5.4 |
| XMM-Newton EPIC PN | 0505720401 | 18.1 | 2008-01-18.63 | 77.87 | 2.2 | 6.0 |
| XMM-Newton EPIC PN | 0505720501 | 17.2 | 2008-01-27.94 | 87.17 | 2.0 | 1.3 |
| XMM-Newton EPIC PN | 0505720601 | 17.3 | 2008-02-07.20 | 97.44 | 4.3 | 4.2 |
Notes: a: Dead-time corrected
b: Time in days after the outburst of nova M31N 2007-11a in the optical (Pietsch et al. 2007a) on 2007 Nov 2.28 UT
(MJD = 54406.2); uncertainties are 0.45 days, according to Sect. 3
c: X-ray luminosities and 3 upper limits (unabsorbed, 0.2 - 1.0 keV) estimated using a blackbody model with kT = 50eV
and = 6.7 cm-2 (see Sect. 2.2)
3 Results
In our Super-LOTIS monitoring data of 2007 Nov 2.28 UT, we discovered M31N 2007-11a as a previously unknown nova candidate (Pietsch et al. 2007a). The position of M31N 2007-11a is RA = 00h42m37.29s, Dec = +4117 (J2000, accuracy of 0.2”), which is 1 19 west and 1 2 north of the core of M 31. The detected R band magnitudes are 16.7 (2007 Nov 2.28), 16.8 (2.37), 18.0 (5.27), 18.4 (5.35), 18.4 (7.35). The optical light curve of M31N 2007-11a is given in Fig. 1. We estimate the photometric accuracy of our measurements of M31N 2007-11a to be 0.3 mag, which is slightly less accurate than average since the object is located very near the center of M 31, and measurements suffer from strong background light. The outburst date of M31N 2007-11a is well-constrained, since it was first detected on MJD = 54406.2 but not on MJD = 54405.3. Therefore, we estimate MJD = 54405.75 for the actual outburst, with an error of days. The horizontal error bars in Fig. 1 represent this uncertainty for the days after the nova outburst.
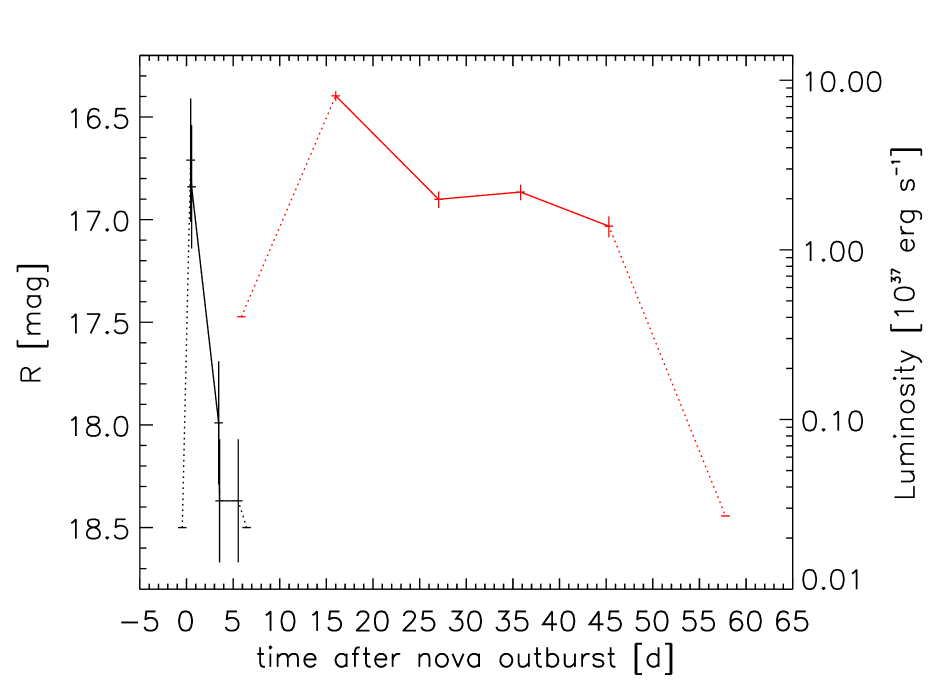
In the second HRC-I monitoring observation of our M 31 monitoring campaign (starting 2007 Nov 17.76), CXOM31 J004237.3+411710 was detected as a relatively bright source ( counts), whereas in the first HRC-I observation ten days earlier, no source was detected at this position. There is no known X-ray source within of the position of CXOM31 J004237.3+411710, in previous M 31 XMM-Newton and Chandra X-ray source catalogs (Kaaret 2002; Kong et al. 2002; Williams et al. 2004; Pietsch et al. 2005b; Stiele et al. 2008). The luminosity of the source declined during the three subsequent Chandra observations (Nov 28.79, Dec 07.57, Dec 17.49). In the first (Dec 29) and all following XMM-Newton monitoring observations, CXOM31 J004237.3+411710 is no longer detected. The X-ray light curve of CXOM31 J004237.3+411710 (Fig. 1) shows that this object is a very fast transient. Count rates and luminosities (see below) are given in Table 1.
The Chandra position of CXOM31 J004237.3+411710 is RA = 00h42m37.29s, Dec = +4117 (J2000, error of ), which is in excellent agreement (distance of ), within the errors, with the optical position of M31N 2007-11a . The X-ray position uncertainties are only statistical and do not include a possible systematic offset between the catalog of Kaaret (2002) and the LGS (Massey et al. 2006).
In Fig. 1 we give the X-ray light curve of CXOM31 J004237.3+411710 with respect to the outburst of M31N 2007-11a . The delay times to the nova outburst given in Table 1 for upper limits and detections imply that the appearance of the SSS happened between 6 and 16 days after the optical outburst and that the SSS state lasted between 29 and 52 days.
There is no detailed spectral information about CXOM31 J004237.3+411710 , because of the very limited energy
resolution of the HRC detector and the source not being visible in our XMM-Newton monitoring
observations. Also, observations with the Swift X-ray telescope from 2007 Nov 24 to Dec 2
(ObsIDs 031028001 to 031028008) and with the Chandra Advanced CCD Imaging Spectrometer ACIS-I
on 2007 Nov 27 (ObsID 8187) were not deep enough to help with the spectral classification. (There
is also no UV detection of CXOM31 J004237.3+411710 with the Swift UV/Optical Telescope or the XMM-Newton Optical
Monitor.) We therefore used the hardness ratios from the HRC-I described in “The Chandra Proposers’
Observatory Guide”222see http://cxc.harvard.edu/proposer/POG/html/index.html
chapter 7.6 for ObsID 8527 derived from the rates in the bands S, M, and H (channels 1:100, 100:140,
and 140:255, respectively). We derived ratios S/M = , M/H = , indicating
a very soft spectrum. To compare luminosities from Chandra and XMM-Newton upper limits, we assumed a blackbody model with eV and absorption column of 6.7 cm-2, the galactic foreground
towards M 31. An absorbed blackbody model is the simplest way of describing an SSS spectrum (see also Pietsch et al. 2007b). The temperature is an average value for the M 31 novae described in the works of Pietsch et al. (2007b, 2005a). We assume a source distance of 780 kpc
(Holland 1998; Stanek & Garnavich 1998). The usage of a generic spectral model, Although only done to compare the different instruments, using a generic spectral model may of course produce significant luminosity uncertainties. Therefore, in Table 2 we give the HRC energy conversion factors (count rate / flux, computed using PIMMS), as well as unabsorbed HRC peak
luminosities and PN upper limits of CXOM31 J004237.3+411710 for different blackbody temperatures and an fixed to the Galactic foreground value. The table shows that the source can be classified as a luminous SSS (L0.2-1.0
erg s-1) independent of the assumed blackbody temperature.
4 Discussion
From the positional and temporal agreement and from the HRC-I hardness ratios, we infer that CXOM31 J004237.3+411710 and M31N 2007-11a are the same object.
The ejected mass in the nova outburst can be estimated from the start date of the SSS phase and from the expansion velocity of the ejected material. The decrease in the optical thickness of the expanding ejecta is responsible for the rise in the X-ray light curve of the post-outburst novae, as shown for V1974 Cyg (Shore et al. 1996; Krautter et al. 1996). Assuming that the material ejected by the nova explosion forms a spherical, homogeneous shell expanding at constant velocity , the hydrogen mass density of the shell will evolve in time as where is the ejected hydrogen mass (Krautter et al. 1996). The column density of hydrogen evolves with time as , where g is the atomic mass unit. We assume a typical value for the expansion velocity of 2000 km s-1, since we do not have an optical spectrum for M31N 2007-11a , and that the SSS turns on when the absorbing hydrogen column density decreases to cm-2. With this, the appearance time of the SSS source (between 6 and 16 days) constrains the ejected mass to the range . This is about two orders of magnitude lower than typical ejected masses determined in a similar way for M31 novae (Pietsch et al. 2007b). However, the unknown expansion velocity error adds additional uncertainties to the estimate of . Figure 2 shows the range of for different expansion velocities as a function of the SSS appearance time.

The turn-off time of the SSS phase allows us to estimate the amount of hydrogen-rich material burned on the WD surface, , where is the bolometric luminosity, the duration of the SSS phase, the hydrogen fraction of the burned material, and erg g-1. We compute the burned mass during the short SSS phase of M31N 2007-11a , assuming a bolometric luminosity of and a hydrogen mass fraction . The SSS turn off at 45–58 days after the optical outburst constrains the burned mass to the range . It is noteworthy that this is within a factor 2–3 the same as the ejected mass. We used typical values for and , since we do not know the actual values for M31N 2007-11a .
M31N 2007-11a has the shortest SSS phase observed so far, which can be caused either by a WD with 1.1 for a standard hydrogen fraction in the envelope or by very hydrogen-poor envelope in a WD with 1.0 . The mass of the stable H-burning envelope decreases with increasing WD mass, with massive WDs showing the shortest SSS phases. Massive WDs also eject less massive shells during outburst, leading to a faster rise in the SSS emission.
From the optical light curve we find a decline rate of mag/d. Extrapolating the magnitude to the day before the first observation (MJD = 54405.3) leads to an estimated maximum magnitude of , which implies an absolute magnitude at maximum of at the distance of M 31. Within the uncertainties, this value matches the maximum magnitude versus rate of decline (MMRD) relationship obtained by Della Valle & Livio (1995). Assuming that the strength of a nova outburst (for a given temperature of the WD and accretion rate) mostly depends on the mass of the WD (see e.g. Livio 1992; Della Valle & Livio 1995; Della Valle 2002, and references therein), one can estimate WD masses from optical nova light curves. However, Livio (1992) mentions that great caution should be exercised when applying his maximum magnitude vs. WD mass relation to individual novae, since there are weaker dependences of the nova luminosity on the magnetic field of the WD and the enrichment of the envelope by heavy elements, which are neglected in his formula. Using our optical light curve, we compute thatM31N 2007-11a likely originated from a WD with 0.9–1.15 . This result is consistent with the X-ray observations.
As mentioned before, many of the novae with known short SSS phases turned out to be RNe. To check for the possibility that M31N 2007-11a is an RN, we looked for historical novae with positions close to M31N 2007-11a. In the compiled on-line nova catalog of Pietsch et al. (2007b)333http://www.mpe.mpg.de/m31novae/opt/m31/index.php there are two historical novae within a radius of around M31N 2007-11a. Sharov et al. (2000) found a nova (M31N 1998-07n) at a distance of about , and Hubble (1929) reported a nova (M31N 1920-10a) at a distance of about to M31N 2007-11a. The J2000 coordinates of M31N 1920-10a were taken from the Combined General Catalogue of Variable Stars (Samus et al. 2004). From the finding chart given by Sharov et al. (2000), nova M31N 1998-07n and M31N 2007-11a do not seem to be identical. This agrees with the position accuracy of given by Sharov et al. (2000). For M31N 1920-10a no finding chart exists and the position given by Hubble (1929) has a minimum accuracy of . The actual unknown position accuracy of historical novae leaves the (small) possibility open that both novae in fact originated on the same WD. A relatively large position error for a historical nova could be possible, since e.g. the re-analysis of photographic plates by Henze et al. (2008) gives several examples for historical novae with position errors of or more. Clarification of this point could only come from re-examination of the original photographic plates used in the work of Hubble (1929).
Acknowledgements.
We wish to thank the anonymous referee for helpful comments that helped to improve the clarity of the paper. The X-ray work is based in part on observations with XMM-Newton, an ESA Science Mission with instruments and contributions directly funded by ESA Member States and NASA. The XMM-Newton project is supported by the Bundesministerium für Wirtschaft und Technologie / Deutsches Zentrum für Luft- und Raumfahrt (BMWI/DLR FKZ 50 OX 0001), the Max-Planck Society, and the Heidenhain-Stiftung. M. Henze acknowledges support from the BMWI/DLR, FKZ 50 OR 0405. G.S. acknowledges support from grants AYA2008-04211-C02-01 and AYA2007-66256. M. Hernanz acknowledges support from grants ESP2007-61593 and 2005-SGR00378. D.H. acknowledges internal funding from Clemson University for partial support of the operation of Super-LOTIS.References
- Della Valle (2002) Della Valle, M. 2002, in American Institute of Physics Conference Series, Vol. 637, Classical Nova Explosions, ed. M. Hernanz & J. José, 443–456
- Della Valle & Livio (1995) Della Valle, M. & Livio, M. 1995, ApJ, 452, 704
- Della Valle & Livio (1996) Della Valle, M. & Livio, M. 1996, ApJ, 473, 240
- Greiner et al. (2003) Greiner, J., Orio, M., & Schartel, N. 2003, A&A, 405, 703
- Hachisu & Kato (2006) Hachisu, I. & Kato, M. 2006, ApJS, 167, 59
- Hachisu et al. (2007) Hachisu, I., Kato, M., & Luna, G. J. M. 2007, ApJ, 659, L153
- Henze et al. (2008) Henze, M., Meusinger, H., & Pietsch, W. 2008, A&A, 477, 67
- Hernanz (2005) Hernanz, M. 2005, in Astronomical Society of the Pacific Conference Series, Vol. 330, The Astrophysics of Cataclysmic Variables and Related Objects, ed. J.-M. Hameury & J.-P. Lasota, 265
- Holland (1998) Holland, S. 1998, AJ, 115, 1916
- Hubble (1929) Hubble, E. P. 1929, ApJ, 69, 103
- Jose & Hernanz (1998) Jose, J. & Hernanz, M. 1998, ApJ, 494, 680
- Kaaret (2002) Kaaret, P. 2002, ApJ, 578, 114
- Kong et al. (2002) Kong, A. K. H., Garcia, M. R., Primini, F. A., et al. 2002, ApJ, 577, 738
- Krautter (2002) Krautter, J. 2002, in American Institute of Physics Conference Series, Vol. 637, Classical Nova Explosions, ed. M. Hernanz & J. José, 345
- Krautter et al. (1996) Krautter, J., Ögelman, H., Starrfield, S., Wichmann, R., & Pfeffermann, E. 1996, ApJ, 456, 788
- Livio (1992) Livio, M. 1992, ApJ, 393, 516
- Massey et al. (2006) Massey, P., Olsen, K. A. G., Hodge, P. W., et al. 2006, AJ, 131, 2478
- Osborne et al. (2006) Osborne, J., Page, K., Beardmore, A., et al. 2006, The Astronomer’s Telegram, 838, 1
- Pietsch et al. (2007a) Pietsch, W., Burwitz, V., Updike, A., et al. 2007a, The Astronomer’s Telegram, 1257, 1
- Pietsch et al. (2005a) Pietsch, W., Fliri, J., Freyberg, M. J., et al. 2005a, A&A, 442, 879
- Pietsch et al. (2005b) Pietsch, W., Freyberg, M., & Haberl, F. 2005b, A&A, 434, 483
- Pietsch et al. (2007b) Pietsch, W., Haberl, F., Sala, G., et al. 2007b, A&A, 465, 375
- Sala & Hernanz (2005) Sala, G. & Hernanz, M. 2005, A&A, 439, 1061
- Samus et al. (2004) Samus, N. N., Durlevich, O. V., & et al. 2004, VizieR Online Data Catalog, 2250, 0
- Sharov et al. (2000) Sharov, A. S., Alksnis, A., Zharova, A. V., & Shokin, Y. A. 2000, Astronomy Letters, 26, 433
- Shore et al. (1996) Shore, S. N., Starrfield, S., & Sonneborn, G. 1996, ApJ, 463, L21
- Stanek & Garnavich (1998) Stanek, K. Z. & Garnavich, P. M. 1998, ApJ, 503, L131
- Starrfield (1989) Starrfield, S. 1989, in Classical Novae, 39
- Starrfield et al. (1974) Starrfield, S., Sparks, W. M., & Truran, J. W. 1974, ApJS, 28, 247
- Stiele et al. (2008) Stiele, H., Pietsch, W., Haberl, F., & Freyberg, M. 2008, A&A, 480, 599
- Supper et al. (2001) Supper, R., Hasinger, G., Lewin, W. H. G., et al. 2001, A&A, 373, 63
- Tuchman & Truran (1998) Tuchman, Y. & Truran, J. W. 1998, ApJ, 503, 381
- Warner (1995) Warner, B. 1995, Cataclysmic variable stars (Cambridge Astrophysics Series, Cambridge, New York: Cambridge University Press, 1995)
- Williams et al. (2004) Williams, B. F., Garcia, M. R., Kong, A. K. H., et al. 2004, ApJ, 609, 735
- Williams et al. (2008) Williams, G. G., Milne, P. A., Park, H. S., et al. 2008, in American Institute of Physics Conference Series, Vol. 1000, American Institute of Physics Conference Series, 535
- Yaron et al. (2005) Yaron, O., Prialnik, D., Shara, M. M., & Kovetz, A. 2005, ApJ, 623, 398