Origin of the peaks in the Nernst coefficient of bismuth in strong magnetic fields
Abstract
We explain the origin of most of the peaks in the Nernst coefficient that were recently observed at magnetic fields directed along the trigonal axis and the bisectrix direction in bismuth. Additional experiments are discussed that enable one to verify our explanation.
pacs:
71.70.Di, 71.18.+y, 72.15.JfIn the recent paper B1 oscillations of the Nernst coefficient in bismuth were for the first time observed for the magnetic fields directed along the trigonal and bisectrix axes of the crystal. Moreover, several unusual peaks of this coefficient were discovered for very high magnetic fields ( ) parallel to the trigonal axis. B2 These peaks were concomitant with quasi-plateaus in the Hall coefficient, and the authors of Ref. B2, suggested that these results are a signature of an exotic quantum fluid reminiscent of the fluid associated with the fractional quantum Hall effect. Interestingly, in the same interval of the high magnetic fields several jumps of the magnetization were observed which were ascribed to field-induced instabilities of the ground state of interacting electrons in bismuth. Ong
In this paper we show that positions of the peaks in the Nernst signal for along the bisectrix axis and for applied along the trigonal axis can be explained using a simple model of the electron energy spectrum of bismuth in magnetic fields. In particular, the most of the peaks are due to the hole Fermi surface of bismuth, while some peaks result from its electron part. On the basis of our calculation we also predict new additional peaks that have not yet been observed. However, the unusual peaks observed in the Nernst signal at high magnetic fields cannot be explained in this way directly. Nevertheless, we show that at least some of these peaks can be reproduced if one assumes that a small deviation of the magnetic-field direction from the trigonal axis occurred in the experiments. We also theoretically analyze dependences of the peaks on this tilt angle of the magnetic field. These angular dependences will enable one to distinguish between the peaks that appear even in the one-electron approximation and the peaks that are really due to new collective effects.
The electron-band structure of bismuth is well known; see, e.g., papers Ed, ; Pn, and the references cited therein. The Fermi surface of bismuth consists of one hole ellipsoid located at the T point of its Brillouin zone, and of three closed electron surfaces of nearly ellipsoidal shape centered at the points L. The spectrum of the holes in bismuth is well approximated by the simple parabolic model.Ed On the other hand, the electron spectrum near the point L is accurately described by the model of McClure, Mc and the parameters of this model are well known. Pn ; Bi However, in the framework of the McClure model the spectrum of the electrons in a magnetic field can be found analytically only if is directed along the longest axis of the electron ellipsoid, i.e., if practically coincides with the bisectrix axis. Bi To find the Landau levels of the electrons for an arbitrary direction of , two empirical expressions for these levels were proposed many years ago. Sm ; Vec These expressions permitted one to describe a number of experimental data. Sm ; Vec ; HirumaMiura ; Bompadre Below we shall use the expression suggested in Ref. Sm, to analyze the oscillations of the Nernst coefficient.
The electron ellipsoid at the point L is elongated along the bisectrix axis. If one describes this ellipsoid by the so-called model of Lax lax in which only linear terms in quasimomentum are taken into account in the electron Hamiltonian, the electron spectrum in the magnetic field can be found analytically at any direction of . But the Lax model cannot accurately describe the electron ellipsoid along its elongation, and that is why McClure Mc took into account also quadratic terms in for this direction in his Hamiltonian. It is these terms that do not permit one to find the spectrum analytically at the arbitrary directed magnetic fields within the McClure model.
To allow for the deviation of the real electron spectrum from the Lax model, Smith, Baraff and Rowell Sm suggested a simple generalization of the formula that describes the Landau levels in the model of Lax. According to Ref. Sm, , in the presence of the magnetic field the th Landau level for an electron with the quasimomentum along can be found from the equation:
| (1) |
where signs correspond to the electron spins that are antiparallel and parallel to , respectively; the energy is measured from the edge of the conduction band; is the cyclotron frequency
is the gap between the conduction and valence bands at the point L; is the effective electron g factor at this point; is the Bohr magneton, and the longitudinal and the cyclotron masses, and , are given by
| (2) | |||||
| (3) |
Here is the unit vector in the direction of the magnetic field . The effective mass tensor has the form:
| (4) |
where the axes 1 and 3 coincide with the binary and the trigonal axes, respectively, while the axis 2 is along the bisectrix direction. The effective factor,
| (5) |
is defined in terms of a spin-mass tensor that has the form similar to Eq. (4). Within the Lax model it is obtained that the spectrum is described by formulas (1) - (5), and exactly coincides with , while Smith, Baraff, and Rowell Sm admitted that the elements of may differ from the elements of and that they are free parameters. This is just the generalization proposed in Ref. Sm, .
| Electrons | ||||
|---|---|---|---|---|
| Orbital mass | 0.00113 | 0.26 | 0.00443 | -0.0195 |
| Spin mass | 0.00101 | 2.12 | 0.0109 | -0.13 |
| Holes | ||||
| Orbital mass | 0.07ex1 | 0.69 | ||
| Spin mass | 0.033 | 200 | ||
Since the spectrum of the holes at the point T is parabolic, the Landau levels for them can be easily found Ed
| (6) |
where is the edge of the hole band at this point of the Brilloun zone. The cyclotron frequency , the masses and , and the factor are defined by the same formulas (2), (3), (5) as for the electrons, but now the tensor of the effective masses for the holes has the form:
| (7) |
and a similar expression is valid for the spin-mass tensor, . All the parameters in Eqs. (1) - (7) are known for bismuth; Sm see Table 1.
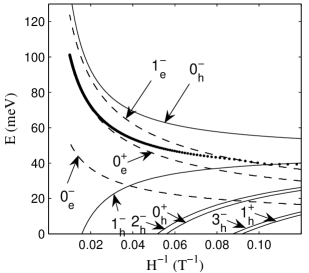
In our subsequent discussion we shall denote the Landau levels as where is the quantum number of the level, the subscripts stand for electron and holes, and the signs correspond to the electron spin directed up and down, respectively. Figure 1 shows the -dependence of these levels for the electrons and holes in bismuth in the case of the magnetic field directed along the trigonal axis. In this figure we also show the -dependence of the Fermi level that is found from the equality of the concentrations of the electrons and holes in bismuth. Since the electron levels that are below and the hole levels lying above are filled, one can easily trace the change in the population of the levels with increasing .
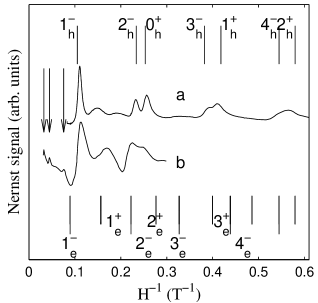
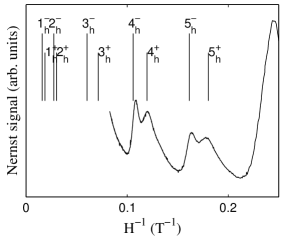
Figure 2 shows the magnetic fields at which the calculated electron and hole Landau levels cross the Fermi energy. This figure also shows the experimental Nernst signalB1 ; B2 for low temperatures K. It is seen that the experimental peaks with large amplitudes are caused by the hole ellipsoid, and their positions are well reproduced by our calculation. At the magnetic fields T the electron ellipsoids practically do not manifest themselves in the oscillations of the Nernst coefficient due to the low mobility of the electrons as compared to the mobility of the holes.B1 Only relatively small maxima seen in the interval T T can be attributed to the electrons. But the calculated positions of the electron peaks do not agree accurately with the experimental data. Moreover, the positions of the small experimental maxima varies from sample to sample and from experiment to experiment. Bpr However, the most essential point is that the calculation does not reveal any peaks at the magnetic fields higher than 11 T. When T, the only hole level and the two electron levels and are filled, and these levels do not cross with increasing .
Of course, one should keep in mind that the above formulas for the electron Landau levels are not exact. In the case of high magnetic fields corrections to these formulas were studied in Refs. Vec, ; HirumaMiura, . However, our analysis shows that such corrections can only partly improve the situation, e. g., it is possible to fit the electron energy levels and so that to describe accurately electron maxima between the hole peaks and in the curve a, but these corrections cannot describe the unusual peaks observed in the magnetic fields above T.
To resolve this problem, we assume that in the experiments B1 ; B2 the magnetic field was slightly tilted away from the trigonal axis. Then, the following explanation of these experimental data is possible: There are three electron ellipsoids in bismuth, and their energy levels coincide only if the magnetic field is directed strictly along the trigonal axis. If the magnetic field begins to tilt away from this axis, each electron Landau level in Fig. 1 splits into two or three levels (this depends on the plane of the tilt). The electron energy level closely approaches in high magnetic fields, Fig. 1. When the tilt splits this level, the levels resulting from can intersect in the magnetic fields T.
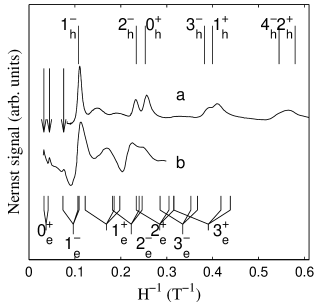
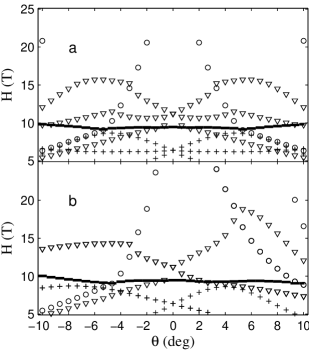
To be specific, consider the case when the magnetic-field direction is given by the angles , . In this case each electron level splits into three levels, and the calculated intersections of these splitted levels with are shown in Fig. 3. Now the two levels resulting from indeed intersect at the magnetic fields that are close to the positions of the two unusual peaks seen in the curve b [the third level does not cross ]. On the other hand, the intersection of one of the levels practically coincides with the position of third unusual peak of this curve. Thus, it is quite possible that at least some of the unusual peaks can result from the intersection of the chemical potential with the Landau levels splitted by a tilt of the magnetic field. A small uncontrollable tilt of the magnetic field can also explain why the positions of the electron peaks varies from experiment to experiment.Bpr To verify this explanation and to find out which of the unusual peaks are really due to some nontrivial physics, it would be useful to measure angular dependences of their positions. In Fig. 4 we show intersections of some Landau levels with in the - plane. Interestingly, the upper part of our figure 4 is closely reminiscent of Fig. 3 in Ref. Ong, . In particular, the angular dependences of the magnetic fields at which the Landau-levels and cross the chemical potential are close to the transition lines and experimentally defined in Ref. Ong, .
We also calculate the Landau levels when the magnetic field is close to the bisectrix direction. The obtained results are presented in Fig. 5. For this geometry in the magnetic fields T all the electrons are in the lowest Landau level, and the oscillations of the Nernst signal B1 shown in Fig. 5 are due to the holes. Note that in the region of high magnetic fields the calculation predicts additional peaks in the Nernst signal which have not been observed yet.
In conclusion, the Smith-Baraff-Rowell model Sm is sufficient to explain the origin of most of the peaks in the Nernst coefficient that were recently observed in bismuth. B1 ; B2 It seems that the positions of some unusual peaks discovered at very high magnetic fields oriented along the trigonal axis can be understood under assumption that the magnetic field was slightly tilted away from the trigonal axis in these experiments. This assumption can be verified by analyzing positions of these peaks in tilted magnetic fields. These angular dependences will enable one to select the peaks that are really due to a nontrivial physics. We calculate these angular dependences for the magnetic fields lying in the two principle planes containing the trigonal axis. The results obtained in one of the planes are reminiscent of the recent experimental data. Ong Our calculation also predicts additional high-field peaks in the Nernst signal at the magnetic field oriented along the bisectrix direction.
We thank K. Behnia for useful discussions and for providing us with the experimental data of Fig. 2 and 3. This work was supported by the France-Ukraine program of scientific collaboration (EGIDE, PHC DNIPRO).
References
- (1) K. Behnia, M.A. Measson, and Y. Kopelevich, Phys. Rev. Lett. 98, 166602 (2007).
- (2) K. Behnia, L. Balicas, and Y. Kopelevich, Science 317, 1729 (2007).
- (3) Lu Li, J. G. Checkelsky, Y. S. Hor, C. Uher, A. F. Hebard, R. J. Cava, N. P. Ong, Science 321, 547 (2008).
- (4) V.S. Edel’man, Usp. Fiz. Nauk 123, 257 (1977) [Sov. Phys. Usp. 20, 819 (1977)].
- (5) S.Sh. Akhmedov, R. Herrmann, K.N. Kashirin, A. Krapf, V. Kraak, Ya. G. Ponomarev, and M.V. Sudakova, Zh. Eksp. Teor. Fiz. 97, 663 (1990) [Sov. Phys. JETP 70, 370 (1990)].
- (6) J.W. McClure, J. Low Temp. Phys. 25, 527 (1976).
- (7) G.P. Mikitik, Yu. V. Sharlai, Fiz. Nizk. Temp. 26, 54 (2000) [Low Temp. Phys. 26, 39 (2000)].
- (8) G.E. Smith, G.A. Baraff, and J.W. Rowell, Phys. Rev. 135, A1118 (1964).
- (9) M.P. Vecchi, J.R. Pereira, and M.S. Dresselhaus, Phys. Rev. B14, 298 (1976).
- (10) K. Hiruma and N. Miura, J. Phys. Soc. of Japan, 52, 2118 (1983).
- (11) S. G. Bompadre, C. Biagini, D. Maslov, and A. F. Hebard, Phys. Rev. B64, 073103 (2001).
- (12) B. Lax, J. G. Mavroides, H. J. Zeiger, and R. J. Keyes, Phys. Rev. Lett. 5, 241 (1960).
- (13) This value differs from presented in Ref. Sm, , but it is taken to fit the period of the oscillations () observed in Refs. B1, ; Bompadre, .
- (14) K. Behnia, private communication.