On the ferromagnetic structure of the intermetallic borocarbide TbCo2B2C
Abstract
Based on magnetization, specific heat, magnetostriction, and neutron diffraction studies on single-crystal TbCo2B2C, it is found out that the paramagnetic properties, down to liquid nitrogen temperatures, are well described by a Curie-Weiss behavior of the Tb3+ moments. Furthermore, below = 6.3 K, the Tb-sublattice undergoes a ferromagnetic (FM) phase transition with the easy axis being along the direction and, concomitantly, the unit cell undergoes a tetragonal-to-orthorhhombic distortion. For fields up to 90 kOe, no field-induced splitting of the Co 3d orbitals was observed; as such the internal field must be well below the critical value needed to polarize the Co 3d subsystem. The manifestation of a FM state in TbCo2B2C is unique among all other isomorphous borocarbides, in particular TbNi2B2C (=15 K, incommensurate modulated magnetic state) even though the Tb-ions in both isomorphs have almost the same crystalline electric field properties. The difference in the magnetic modes of these Tb-based isomorphs is attributed to a difference in their exchange couplings caused by a variation in their lattice parameters and in the position of their Fermi levels.
pacs:
75.25.+z, 75.50.-y, 75.50.Cc, 74.70.DdI Introduction
Whenever a family of compounds, containing 3d transition-metal () and rare-earth () atoms, manifests similar band structures, the trend in their magnetic properties can be rationalized in terms of the position of the Fermi level within the density of states () curve. The cubic, Laves-type family of compounds provides a best illustration.Bloch and Lemaire (1970); Bloch et al. (1975); Cyrot and Lavagna (1979); Cyrot et al. (1979) Here, it is commonly considered that the -ion moments are localized while the moments, if they exist, are itinerant. Assuming further that the mutual interactions among the magnetic ions can be described within the molecular field theory and, in addition, using Landau phase-transition arguments together with Stoner and Wohlfarth-Rhodes criteria, then the magnetic properties of the whole family can be classified according to the first few energy derivatives of () evaluated at .Bloch and Lemaire (1970); Bloch et al. (1975); Cyrot and Lavagna (1979); Cyrot et al. (1979) This model is successful in explaining the evolution of the paramagnetic susceptibility, the type of the magnetic phase transition, the relative magnitude of the critical temperature, and, moreover, the magnetism of the 3d subsystem; in particular it explains why the Ni sublattice is magnetically silent in Ni2 while the Co subsystem has an intermediate character: being strongly exchange-enhanced in Co2 ( = Y, Lu) while developing a delocalized moment in magnetic Co2. For such Co2 series, it was found out that an adequate effective magnetic field at the Co site, is able, at and above a critical field , to induce a metamagnetic transition due to which the Co atom acquires an itinerant moment of 1.
The above-mentioned interplay between the magnetism of and subsystems is expected to be manifested also in the quaternary borocarbides BC family (see e.g. Ref. 5 and references therein). Though the investigation of this interplay is of interest for the understanding of the magnetism (and superconductivity) of this family, there are only very few studies bearing on this subject and these are mostly limited to the NiBC series. Nevertheless, the extensive magnetic characterization of this NiBC series did clarify the influence of () on their overall magnetic (superconducting) properties;Müller and Narozhnyi (2001) in particular, it is established that while the -doping hardly influences the magnetic properties (but leads invariably to a degradation of the superconductivity), the variation in strongly modifies the magnetic structure: for R = Pr, Ho, Dy, the magnetic structures consist of a commensurate antiferromagnetic, AFM, state,Lynn et al. (1997); Campbell et al. (2000); Dervenagas et al. (1995) that of R = Tm is incommensurate modulated structure with (0.093,0.093,0),Lynn et al. (1997); Chang et al. (1996); Sternlieb et al. (1997) and those of R = Er, Tb, Gd are incommensurate modulated states with 0.55,0,0).Lynn et al. (1997); Sinha et al. (1995); Zarestky et al. (1995); Dervenagas et al. (1996); Detlefs et al. (1999) At (which is ), each of the latter states transforms into an equal-amplitude, squared-up state and in the particular cases of R = Er and Tb, this transformation leads to a surge of a weak ferromagnetic component.Canfield et al. (1996); Detlefs et al. (30-Jun-2003); Kawano-Furukawa et al. (2002); Choi et al. (2001) It is an experimental fact that none of the Ni-based compounds manifests a ferromagnetic, FM, ground state though there is, at least for R = Pr, Ho, Dy, a strong FM intralayer coupling.
It is recalled that the Ni subsystem in YNiBC is magnetically inactiveMüller and Narozhnyi (2001) while the Co subsystem in YCoBC manifests an exchange enhanced paramagnetism:El Massalami et al. (2004) based on the above model, these features indicate that in the Ni-based compound is above a filled 3 band and, in addition, is not at a steep region of () while for the Co-based compound the curvature of () at must be positive and nonnegligible. Indeed electronic structure calculationsCoehoorn (1994); Lee and et al (1994); Matthias (1994); Pickett and Singh (1994) on NiBC ( = Lu,Y) showed that is situated at the top of a pronounced and narrow () peak and this peak lies on the top edge of nearly filled Ni(3d) bands: this, together with the intermediate electron-phonon coupling and the smaller Stoner factor, explains the surge of the superconductivity as well as the nonmagnetic character of the Ni-sublattice. Furthermore, in case of a FM order, such an () peak at would be exchange split due to the direct intra-atomic 4f-5d exchange interaction:Coehoorn (1994) such a split would be higher than the superconducting gap; it is an experimental fact that, due to their AFM structures, none of the magnetic NiBC superconductors shows this splitting.
Band structure calculationsCoehoorn (1994) on LuCoBC showed that, for such isomorphous borocarbides, the rigid band model yields a reasonable description of the band filling. Furthermore, is situated at the decreasing but right-hand side of one of the peaks that receives a considerable contribution from the Co 3-band, and that () is of the same magnitude as that of LuNiBC: the latter finding is consistent with the observation that the Sommerfeld linear specific heat coefficients of YCoBC and YNiBC are equal.ElMassalami et al. (2000) Furthermore, as that the first derivatives of () are nonnegligible, then we expect the Co sublattice, similar to Co2, to develop an intermediate character (or even to be polarized) if : the intermediate character is indeed observed in YCoBC;El Massalami et al. (2001, 2004) the possibility of Co-subsystem polarization, on the other hand, would be addressed in this work. As far as the -sublattice magnetism is concerned, it is expected that the difference in the lattice parameters and in the electronic band structure of the Co- and Ni-based borocarbides would imply a modification in the character of the mediating RKKY-type interactions and consequently in the character of their magnetic ground states.
In this paper, we report on the extensive magnetic characterization of TbCo2B2C. The successful synthesis of a single-crystal sample of TbCo2B2C made it possible to identify unambiguously the paramagnetic as well as the ordered-state properties of the Tb sublattice: the former is dominated by a Curie-Weiss behavior while the latter is found to be a FM structure with the easy axis lying along the direction. Such a FM state is in sharp contrast to the AFM-type mode of the isomorphous TbNi2B2C.Cho et al. (1996); Tomy et al. (1996); Dervenagas et al. (1996); Kreyssig et al. (2003); Detlefs et al. (30-Jun-2003); Song et al. (2001a) This work also addressed the question of whether the surge of this FM state (with a strong Tb moment and consequently a strong ) is able to polarize the Co 3d subsystem. Our results suggest that in spite of the intermediate character of the Co 3 subsystem, the induced is not able to bring about an unambiguous spontaneous polarization.
II Experiment
99.5% 11B enriched polycrystals of TbCo2B2C were prepared by conventional arc-melt method. These polycrystals were used as feeding rods during a floating-zone synthesis, a process that we used for single crystals growth.Takeya et al. (2001)
Characterization were carried out using magnetization [, extraction method within the ranges 1.9 300 K and 90 kOe] and zero-field specific heat [, semi-adiabatic method within the range 0.5 15 K, accuracy better than 4%]. A high-accuracy capacitance dilatometerElMassalami et al. (2007) was used for measuring the thermal expansion or forced magnetostriction with a resolution better than 1 Å. The relative change in length, measured along the cosine directions when a field is applied along the cosine direction , is denoted as .
Neutron-diffraction measurements were carried out at the Institut Laue-Langevin in Grenoble, France. Measurements were carried out on a powdered as-prepared arc-melt polycrystalline sample (since large quantity is desirable, see § III.D below) as well as on a single crystal sample. The powder diffraction patterns were collected within a temperature range 2 to 40 K using the D1B diffractometer with a selected incident wavelength of 2.42 ; Rietveld refinements of both crystallographic and magnetic structures were carried out using the Fullprof package of Rodriguez-Carvajal (www.ill.fr/dif/Soft/fp). Single crystal diffraction studies were performed on the D10 four-circle diffractometer with over a wide range of space and within the temperature range 1.7 K.
III Results
III.1 Magnetization
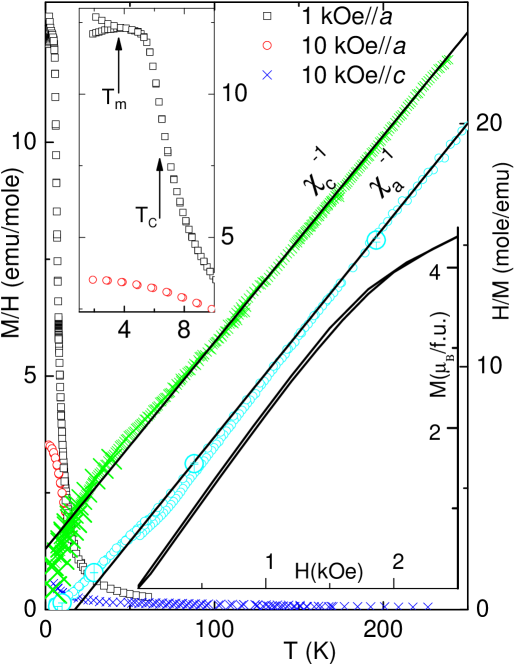
Figure 1 shows the -dependent and curves that were measured at different fields and along the two principal tetragonal axes. The large symbols on the curve represent the H/M( obtained from the Arrot plot: the excellent agreement emphasizes that, within this temperature range, the contribution of magnetic impurities is negligible. A Curie-Weiss fit down to liquid-nitrogen temperatures of gives 9.7(1) and = -29.4(1) K while that of gives 9.6(1) and =14.4(1) K. Evidently, there are anisotropic forces but the effective moments are in excellent agreement with the value expected for a free Tb3+ ion. Based on these anisotropic values, the first Stevens coefficient in the crystal field description of a tetragonal symmetry is estimated to be 0.88(2) K; this compares well in sign and magnitude with that of TbNi2B2C ( =1.2(1) K).ElMassalami et al. (2007) This similarity suggests that the crystalline electric field, CEF, at the Tb3+ site of both isomorphs are similar: indeed both sites have the same symmetry and almost the same charge distribution. On lowering the temperatures toward liquid helium region, increases relatively fast and afterward tends toward saturation. Considering the characteristic magnetic features manifested in the magnetization, specific heat, and neutron diffraction (see below), this fast increase (which is followed by saturation) is caused by the process of approaching and the eventual onset of a FM order wherein the moments point along the a axis: = 6.3(2) K is the point of maximum inclination.
The upper-left inset of Fig. 1 shows, on an expanded scale, a magnetic hysteresis occurring at 3.7(2) K and =1 kOe. The 1.9 K curve, shown in the lower-right inset of Fig. 1, reveals that this hysteresis effect disappears for 2 kOe. Since this -feature is sample-dependent (see below), it is attributed to a contaminating magnetic phase, the magnetization of which saturates completely to 0.05 formula unit for field higher than 2 kOe. Based on the weight ratios of the magnetic moments, the fraction of the Tb ions in this spurious phase relative to the major TbCo2B2C phase is estimated to be 0.7%.
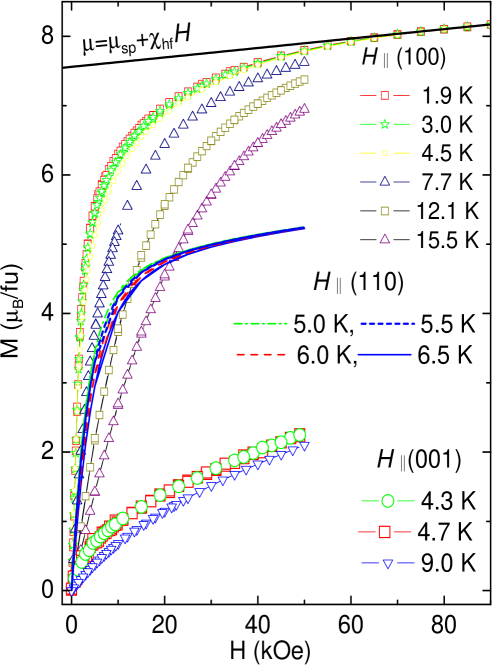
Figure 2 confirms the above-mentioned magnetic anisotropy, due to which the a (c) is the easy (hard) axis. Within the studied ranges of and , the magnetization isotherms do not show any field-induced transition, rather, only a monotonic and steady increase (tending towards saturation) which is characteristic of a forced domain alignment: this supports the earlier inference of a FM order. Furthermore, the high-field magnetization increases as 2K[=7.6(3), =6.8(4)10-6 /Oe corresponding to 38(2)10-3 emu/mol] attaining (90 kOe, 2 K) = 8.2. is only 3% lower than the reported moment of TbNi2B2C ( 7.78 ,Lynn et al. (1997); Cho et al. (1996)) but 16% lower than the one expected for a free Tb3+ ion: this observed moment lowering confirms the above-mentioned influence of the CEF effects and that these effects are similar to the ones observed in the Ni-based isomorph. Alternatively, let us assume that the difference between of TbCo2B2C and the reported moment of TbNi2B2C is due exclusively to the spontaneous polarization of the Co 3d orbitals which are coupled ferrimagnetically to the FM Tb sublattice. Then, based on the relation , the maximum possible Co moment would be 0.25 . Such a value is surprisingly small, amounting to only 0.25 hole/Co atom in the 3d band; this value is almost one fourth of the Co moment encountered in the heavy members of the Co2 series,Cyrot and Lavagna (1979) but it is similar to the value observed in the low spin state of Co in, e.g., ErCo2.Liu and Altounian (2006); Herrero-Albillos et al. (2007) It is more likely that (see § IV) since if there is any spontaneous Co polarization then the induced moment should be much higher than 0.25 . As the CW law describes well the paramagnetic susceptibility of (see above), then the exchange-enhancement factor for the Co-subsystem susceptibility must be extremely small.
III.2 Specific heat
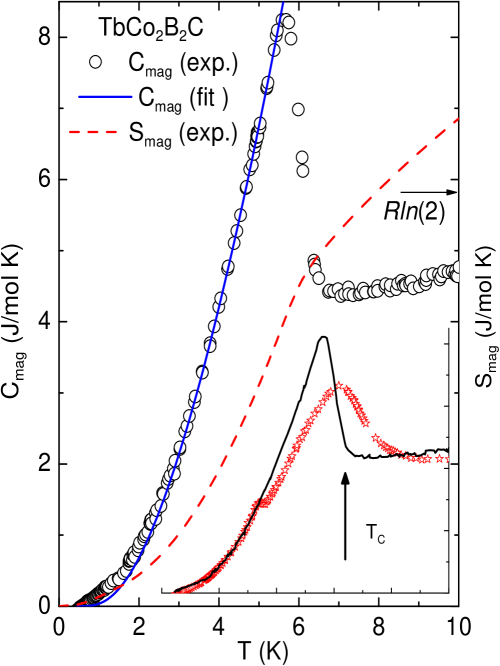
Figure 3 shows the zero-field magnetic specific heat and entropy of single-crystal TbCo2B2C obtained after subtracting the nuclear, electronic, and lattice contributions (the latter two were obtained from YCo2B2C).ElMassalami et al. (2000); El Massalami et al. (2004) The nuclear contribution is of dominant importance only at very low temperatures and was evaluated from the diagonalization of the hyperfine Hamiltonian.Kruis et al. (1969) It is worth mentioning that at very low-temperature, the nuclear contribution is much stronger than the magnetic one: as such the propagation of errors due to successive subtraction of non-magnon contributions would eventually influence the absolute value of ; this may undermine the quality of the comparison between the theoretical and experimental magnon contributions (see Fig. 3).
Both () and () curves do confirm the onset of the magnetic order at : the former curve rises very sharply at while the latter manifests a pronounced change of slope. Considering the magnetic structure to be associated with the FM order of the Tb-sublattice (see below), we fit the experimental () to the theoretical magnon expression of Eq. 5 (see Appendix): as can be seen in Fig. 3, the excellent fit to Eq. 5 gives the spin-wave stiffness coefficient =26.3(5) K and the gap parameter =8.4(2) K. The high value of is indicative of stronger effective exchange couplings. On the other hand, the value of (which from Eq. 3 is a measure of the anisotropic field) is consistent with the strong anisotropic features observed in the magnetization measurements.
The inset of Fig. 3 compares the measured () of a single-crystal sample with that of a polycrystalline one. Evidently the -transition is sample-dependent: while () of the polycrystalline sample manifests a pronounced event at =3.6(2) K, that of the single-crystal hardly shows any anomaly. As mentioned above, the single-crystal sample contains only a 0.7% spurious phase and this concentration limit is lower than the resolution of the specific heat set-up.
III.3 magnetostriction
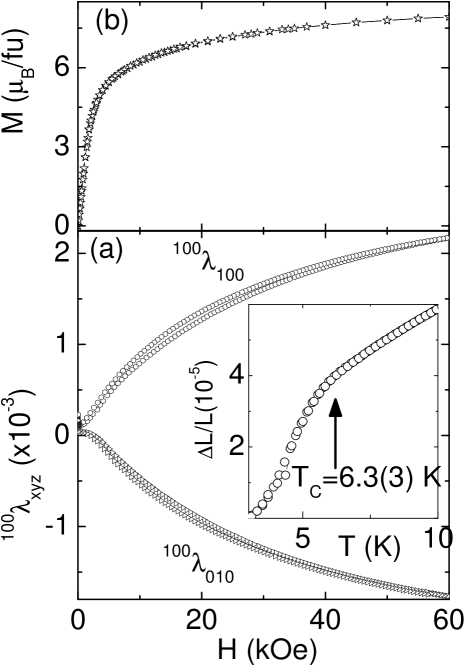
Figure 4 shows the forced magnetostriction isotherms measured along the and axis with . Once more (apart from the low-field, domain-wall sweeping-out region and the saturated regime) there is no metamagnetic transition in these isotherms. The inset of Fig. 4 indicates clearly that below , TbCo2B2C undergoes a spontaneous distortion which - based on Fig. 4(a), see also § III.D - is attributed to an orthorhombic distortion of the tetragonal unit cell. A similar distortion was reported for TbNi2B2C.Song et al. (1999, 2001a, 2001b); Detlefs et al. (30-Jun-2003); ElMassalami et al. (2007) Then the behavior of the forced magnetostriction of Fig.4 can be understood as follows: at zero-field, there is an equal distribution of domains along each of the and axes; an applied field along, say, the axis would involve a rearrangement of the orthorhombically-distorted domains and as such induces an increase in [Fig. 4 (b)], an increase in , and a decrease in [Fig. 4 (a)].
III.4 Neutron Diffraction
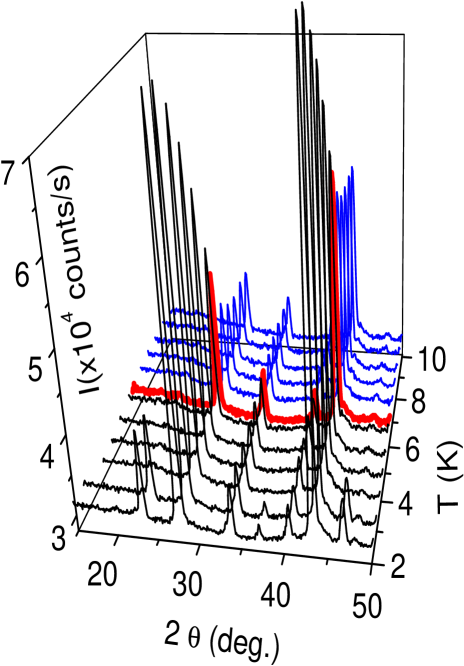
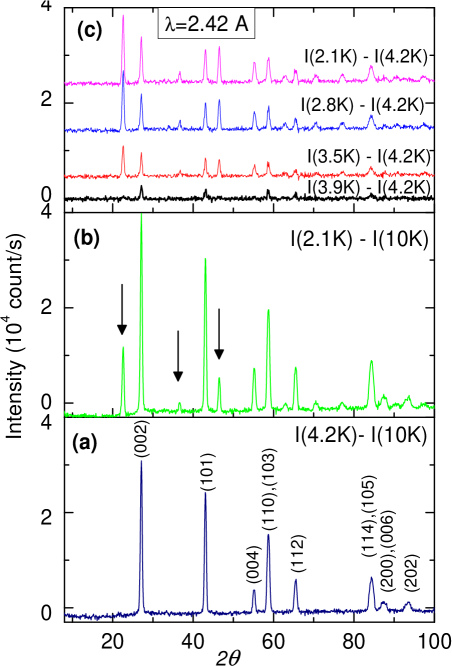
The thermal evolution of the powder diffractograms are shown Figs. 5-6. For , the patterns consist of the tetragonal crystal structure of TbCo2B2C and a small impurity phase. On the other hand, for , it is evident that the magnetic reflections are piled up on the top of the nuclear Bragg peaks: a =(000) mode. Considering that the paramagnetic state is dominated by the Tb moment, that the evolution of the isothermal magnetization and magnetostriction indicates no metamagnetic transition which can be related to the onset of Co moment, then this mode must be related to the Tb sublattice. Furthermore, since the Tb ion occupies the special 2 site in the unit cell, then this mode must be FM: confirming the conclusions drawn from the magnetization, magnetostriction, and specific heat studies. Indeed, Fig. 6 (a) confirms that this pattern is a FM mode. Alternatively, if this mode is related to the Co sublattice then, due to the multiplicity of the 4 site occupied by the Co atoms, the magnetic order should be either AFM (if only due to Co subsystem) or ferrimagnetic (if both subsystems are ordered): in the light of all the above-mentioned results, both possibilities must be ruled out (see also § IV).
Tb Co B C TbNi2B2C position (000) () (0,0,) () thermal factor 0.47 0.57 0.77 0.85 TbCo2B2C position (000) () (0,0,) () thermal factor 0.57 0.85
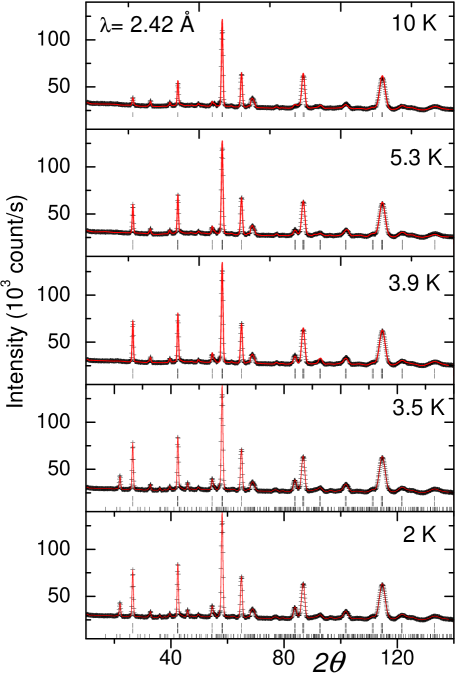
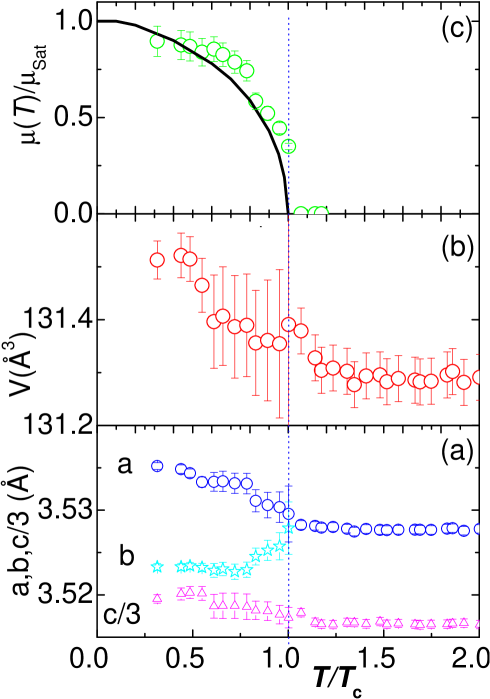
To extract more information, Rietveld analysis was carried out on the diffractograms measured within the range . Because of the structural distortion, we used the Immm space group together with the parameters given in Table 1. Representative analyzed diffractograms are shown in Fig. 7 while the obtained cell parameters and the magnetic moment are given in Fig. 8. The analysis indicates that the lattice parameters [Fig. 8 (a-b)] undergoes a noticeable orthorhombic distortion below which is consistent with the magnetoelastic effects observed in Fig. 4. Furthermore, the analysis revealed that the zero-field Tb magnetic moment is along the longest side of the base of the orthorhombic cell.
Below 3.7 K, the thermal evolution of the diffractograms reveals two features [Figs. 6 (b and c)]: First, the intensity of the FM mode evolves smoothly and independently. Secondly, there is a surge of additional magnetic peaks [marked by the vertical arrows in the difference plots of Fig. 6 (b and c)]. Since Figs. 1 to 4 do not indicate any event that can be related to an order-to-order transition of Tb magnetic order, then these peaks can not be associated with the magnetic pattern of the Tb-sublattice. As these diffractograms were collected on as-prepared, arc-melt polycrystalline sample - which as mentioned above contains magnetic contamination - then these additional peaks are taken to be due to the same magnetic contamination, which is responsible for the hysteresis event in Fig. 1 and the weak specific heat anomaly in the inset of Fig. 3 (we argue, in § IV, that these events can not be due to an onset of a Co itinerant moment).
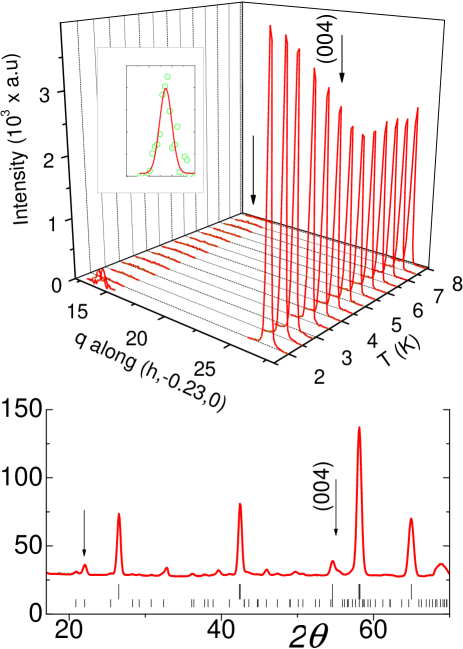
Various -scans within the range 1.78 K were performed on a single crystal of TbCo2B2C. A wide range of space were scanned while maintaining the temperature constant at 1.7 K. Indeed, most of the nuclear (and ferromagnetic) peaks that satisfy the relation were observed. In addition, we also looked, at 1.7 K, for any modulated mode within a wide range covering , , and . Some weak reflections were observed. Fig. 9 shows the thermal evolution of one of these peaks and, for comparison, also that of the (0,0,4) peak. As evident, the intensity of the (0,0,4) peak, being due to magnetic and nuclear contributions, decrease smoothly and goes to the value of the nuclear intensity as the temperature reaches . In particular there is no visible variation in the (0,0,4) intensity when is varied across , indicating that the event at this temperature, does not belong to the main phase. On the other hand, the intensity of the other peak decays very fast as the temperature increases and is almost within the experimental uncertainty when 2 K. Such a thermal evolution is similar to the features observed in the magnetization hysteresis (Fig. 1), in the specific heat anomaly (inset of Fig. 3), and in the powder neutron diffractograms (Figs. 5-7). This suggests that this, as well as the other weak peaks, are related to the same impurity phase as discussed above. Evidently, the ratio of the intensity of this contaminating peak to that of the (0,0,4) peak is extremely small in the single-crystal sample; in terms of the above mentioned impurity scenario, this means that the impurity concentration in the single-crystal sample is much smaller than the one in the polycrystalline case: this conclusion is supported by the observation that the intensity of the specific heat event at is hardly evident in the single-crystal sample (see the inset of Fig. 3).
Based on the above conclusions, the powder diffractograms below were analyzed, with the Rietveld method, as a superposition of three patterns: the nuclear, the FM mode, and a third unidentified contaminating magnetic phase. The Rietveld analysis of the nuclear and magnetic patterns of the main phase below is straightforward and gave a satisfactorily fit; the diffractograms are shown in Fig. 7 while the obtained structural and magnetic parameters are given in Fig. 8; the latter figure reveal that the lattice parameters evolve smoothly across and, furthermore, the mismatch parameter is the same as the one manifested in the magnetostriction experiment of Fig. 4 (a). On the other hand, Fig. 8 (c) compares the reduced Tb magnetic moment, 2 K, with the calculated Brillouin function, B6(). The total angular momentum quantum number is taken to be 6, representing that of a free Tb3+ ion. Since, as shown above, there are considerable CEF effects, then this B6() curve should be taken as a lower bound; nonetheless, the overall thermal evolution of 2 K follows reasonably well this B6() curve; in particular, it reveals a smooth and monotonic evolution across the region. Finally, the intensity contribution of the unidentified phase was calculated using the so-called profile matchingRodríguez-Carvajal (1993) (or pattern decomposition) procedure. Since the crystal structure parameters of this unidentified phase are unknown, no significance should be attached to the fit of the impurity phase, only that all the additional weak peaks are associated with the impurity phase and that the presence of this phase would not modify the conclusions reached about the magnetic properties of the TbCo2B2C phase.
IV Discussion and Conclusions
The above results show that the paramagnetic susceptibilities are given by the CW behavior of the Tb3+ moments, that this contribution is strong enough to mask any magnetic contribution of Co-sublattice (if there is any), that and are typical of Tb3+ ion and are almost equal to the ones observed in TbNi2B2C (see Table 2), and that the transition at is identified as being due to the FM order of the Tb sublattice. In addition, the sample-dependent -event is associated with magnetic contamination. Below we give a further argument in support of this latter identification. Obviously, if such a -event is intrinsic, then it must be either due to the Co- or Tb- sublattice. That the and isotherms do not show any metamagnetic transition and that the same FM state of Tb sublattice is being maintained across , then this -event can not be related to a rearrangement (in direction or strength) of the Tb FM sublattice.
Let us now discuss the claim that the Co orbitals which, being on the verge of ferromagnetism, are spontaneously polarized. But the fulfilment of this possibility requires that , a relation which can, apriori, be satisfied since increases monotonically as decreases [see Fig. 8 (c)]. In this case, there should be two magnetic transitions: one related to the -subsystem and another to the Co-subsystem; just as in the case of, e.g., ErYCo.Hauser et al. (2000) Then, as observed in other intermetallics,Bloch and Lemaire (1970); Bloch et al. (1975); Cyrot and Lavagna (1979); Cyrot et al. (1979) such induced Co-moments should couple ferrimagnetically with the Tb3+ FM sublattice. As there are no spontaneous or field-induced metamagnetic transitions in the curves, then the possibility of a spontaneously polarized Co moment must be excluded; as such ( see § III.A).
( ( ( ( K Magnetic Mode ( TbCo2B2C 3.535 3.523 10.560 9.7 6.3 FM =(000) 7.6 TbNi2B2C 3.554a 3.534a 10.44b 9.8c 15c LSW, =(0.45,0,0)b 7.78b,c a Ref. Song et al. (1999), b Ref.Lynn et al. (1997), c Ref.Cho et al. (1996)
It is significant that the FM structure of TbCo2B2C is drastically different from any of the reported magnetic structures of borocarbides,Lynn et al. (1997) in particular TbNiBC even though these Tb-based isomorphs are similar in most (if not all) of the single-ion CEF-influenced properties such as the anisotropy, the strength, and the orientation of Tb moments (see § III.A and D). However, these isomorphs are distinctly different (see Table 2) in the value of their transition points, in their magnetic structures, and in the overall features of their phase diagrams (a simple one-boundary FM phase versus a cascade of field-induced phase transitions). These differences suggest that the effective Tb-Tb magnetic couplings must be different and, furthermore, those nesting featuresLee and et al (1994) that are responsible for the modulated mode in TbNiBC must be absent in TbCo2B2C. These differences, prompted by the introduction of the Co atoms, suggest that the configuration of their electronic structures [in particular the position of within the () curve and the generalized susceptibilities] must be different. As mentioned in § I, these arguments are consistent with the findings of the electronic structure calculation on LuCo2B2C:Coehoorn (1994) these calculations provide an explanation for the surge of the enhanced paramagnetic character of YCo2B2C and the absence of superconductivity in any of the CoBC compounds (even though YCo2B2C has the same Debye and Sommerfeld coefficients as YNi2B2C).ElMassalami et al. (2000); El Massalami et al. (2004)
Finally, it is recalled that the indirect exchange coupling in metallic magnets are usually written as:Coqblin (1977)
where is the exchange coupling, is the carrier concentration [governed by by ], is the distance separating the moments, and are the Fermi energy and wave vector, and () is the mean free path. Considering that these couplings manifest a quadratic dependence on and a sensitive sinusoidal dependence on the moments separating distances, then it is no surprise that the combination of difference in the electronic structureCoehoorn (1994) and in the lattice parameters (see Table 1) would lead to strong variation in the magnitude and sign of the coupling constants and as such to drastic difference in the magnetic structures of these Tb-based isomorphs. In fact this difference is not limited to these Tb-based isomorphs, our preliminary studies on the magnetic structures of the Co2B2C series showed that this is valid for the whole Co2B2C magnets:ElMassalami et al as an example, the FM mode is observed in TmCo2B2C and HoC2B2C.
Acknowledgements.
We acknowledge the partial financial support from the Brazilian agencies CNPq (485058/2006-5) and Faperj (E-26/171.343/2005).References
- Bloch and Lemaire (1970) D. Bloch and R. Lemaire, Phys. Rev. B 2, 2648 (1970).
- Bloch et al. (1975) D. Bloch, D. M. Edwards, M. Shimizu, and J. Voiron, J. Phys. F: Metal Phys. 5, 1217 (1975).
- Cyrot and Lavagna (1979) M. Cyrot and M. Lavagna, J. Phys. (Paris) 40, 763 (1979).
- Cyrot et al. (1979) M. Cyrot, D. Gignoux, F. Givourd, and M. Lavagna, J. Phys. (Paris) 40, C5 (1979).
- Müller and Narozhnyi (2001) K.-H. Müller and V. N. Narozhnyi, Rep. Prog. Phys. 64, 943 (2001).
- Lynn et al. (1997) J. W. Lynn, S. Skanthakumar, Q. Huang, S. K. Sinha, Z. Hossain, L. C. Gupta, R. Nagarajan, and C. Godart, Phys. Rev. B 55, 6584 (1997).
- Campbell et al. (2000) A. J. Campbell, D. McK. Paul, and G. J. McIntyre, Phys. Rev. B 61, 5872 (2000).
- Dervenagas et al. (1995) P. Dervenagas, J. Zarestky, C. Stassis, A. I. Goldman, P. C. Canfield, and B. K. Cho, Physica B 212, 1 (1995).
- Chang et al. (1996) L. J. Chang, C. V. Tomy, D. M. Paul, and C. Ritter, Phys. Rev. B 54, 9031 (1996).
- Sternlieb et al. (1997) A. B. Sternlieb, C. Stassis, A. I. Goldman, P. Canfield, and S. Shapiro, J. Appl. Phys. 81, 4938 (1997).
- Sinha et al. (1995) S. K. Sinha, J. W. Lynn, T. E. Grigereit, Z. Hossain, L. C. Gupta, R. Nagarajan, and C. Godart, Phys. Rev. B 51, R681 (1995).
- Zarestky et al. (1995) J. Zarestky, C. Stassis, A. I. Goldman, P. C. Canfield, P. Dervenagas, B. K. Cho, , and D. C. Johnston, Phys. Rev. B 51, R678 (1995).
- Dervenagas et al. (1996) P. Dervenagas, J. Zarestky, C. Stassis, A. I. Goldman, P. C. Canfield, and B. K. Cho, Phys. Rev. B 53, 8506 (1996).
- Detlefs et al. (1999) C. Detlefs, D. L. Abernathy, G. Grubel, and P. C. Canfield, Europhys. Lett. 47, 352 (1999).
- Canfield et al. (1996) P. C. Canfield, S. L. Bud’ko, and B. K. Cho, Physica C 262, 249 (1996).
- Detlefs et al. (30-Jun-2003) C. Detlefs, C. Song, S. Brown, P. Thompson, A. Kreyssig, S. L. Budko, , and P. C. Canfield, cond-mat/0306742 (30-Jun-2003).
- Kawano-Furukawa et al. (2002) H. Kawano-Furukawa, H. Takeshita, M. Ochiai, T. Nagata, H. Yoshizawa, N. Furukawa, H. Takeya, and K. Kadowaki, Phys. Rev. B 65, 180508(R) (2002).
- Choi et al. (2001) S.-M. Choi, J. W. Lynn, D. Lopez, P. L. Gammel, P. C. Canfield, and S. L. Bud’ko, Phys. Rev. Lett. 87, 107001 (2001).
- El Massalami et al. (2004) M. El Massalami, H. A. Borges, H. Takeya, R. E. Rapp, and A. Chaves, J. Magn. Magn. Mater. 279, 5 (2004).
- Coehoorn (1994) R. Coehoorn, Physica C 228, 331 (1994).
- Lee and et al (1994) J. I. Lee and et al, Phys. Rev. B 50, 4030 (1994).
- Matthias (1994) L. F. Matthias, Phys. Rev. B 49, 13279 (1994).
- Pickett and Singh (1994) W. E. Pickett and D. J. Singh, Phys. Rev. Lett 72, 3702 (1994).
- ElMassalami et al. (2000) M. ElMassalami, M. S. DaCosta, R. E. Rapp, and F. A. B. Chaves, Phys. Rev. B 62, 8942 (2000).
- El Massalami et al. (2001) M. El Massalami, E. F. Chagas, and R. E. Rapp, J. Magn. Magn. Mater 226-230, 1058 (2001).
- Cho et al. (1996) B. K. Cho, P. C. Canfield, and D. C. Johnston, Phys. Rev. B 53, 8499 (1996).
- Tomy et al. (1996) C. V. Tomy, L. A. Afalfiz, M. R. Lees, J. M. Martin, D. McK Paul, and D. T. Adroja, Phys. Rev. B 53, 307 (1996).
- Kreyssig et al. (2003) A. Kreyssig, O. Stockert, A. Dreyhaupt, E. Ressouche, B. G. C. Ritter, H. Bitterlich, G. Behr, P. C. Canfield, and M. Loewenhaupt, J. Low Temp. Phys. 131, 1129 (2003).
- Song et al. (2001a) C. Song, D. Wermeille, A. I. Goldman, P. C. Canfield, J. Y. Rhee, and B. N. Harmon, Phys. Rev. B 63, 104 507 (2001a).
- Takeya et al. (2001) H. Takeya, E. Habuta, H. Kawano-Furukawa, T. Ooba, and K. Hirata, J. Magn. Magn. Mater. 226, 269 (2001).
- ElMassalami et al. (2007) M. ElMassalami, M. Amara, R.-M. Galera, D. Schmitt, and H. Takeya, Phys. Rev. B 76, 104410 (2007).
- Liu and Altounian (2006) X. B. Liu and Z. Altounian, J. Phys.: Condens. Matter 18, 5503 (2006).
- Herrero-Albillos et al. (2007) J. Herrero-Albillos, F. Bartolomé, L. M. García, A. T. Young, T. Funk, J. Campo, and G. J. Cuello, Phys. Rev. B 76, 094409 (2007).
- Kruis et al. (1969) M. Kruis, G. R. Pickett, and M. C. Veuro, Phys. Rev. B 177, 910 (1969).
- Song et al. (1999) C. Song, Z. Islam, L. Lottermoser, A. I. Goldman, P. C. Canfield, and C. Detlefs, Phys. Rev. B 60, 6223 (1999).
- Song et al. (2001b) C. Song, J. C. Lang, C. Detlefs, A. Letoublon, W. Good, J. Kim, D. Wermeille, S. L. Bud’ko, P. C. Canfield, and A. I. Goldman, Phys. Rev. B 64, 20 403 (2001b).
- Rodríguez-Carvajal (1993) J. Rodríguez-Carvajal, Physica B 192, 55 (1993).
- Hauser et al. (2000) R. Hauser, E.Bauer, E.Gratz, H. Müller, M. Rotter, H. Michor, G.Hilscher, A. Markosyan, K. Kamishima, and T. Goto, Phys. Rev. B 61, 1198 (2000).
- Coqblin (1977) B. Coqblin, The Electronic Structure of Rare-Earth Metals and Aloys: The Magnetic Heavy Rare-Earth (Acdemic Press, New York, 1977).
- (40) M. ElMassalami et al, to be Published.
- Kittel (1963) C. Kittel, Quantum Theory of Solids (John Wiley and Sons Inc., New York, 1963).
Appendix A Magnon Contribution from the ferromagnetic Tb-sublattice of TbCo2B2C
The above-mentioned ferromagnetic order of the Tb-sublattice suggests that the dominant exchange interactions within the same layer (approximated by a positive ) as well as those among different layers (approximated by a positive are ferromagnetic. Let us assume that the main contributions to the magnetic energy is due to the above-mentioned exchange couplings and anisotropic crystalline electric field interactions. Within the low temperature regime of interest, the anisotropic interactions can be approximated by an effective field (in energy units) which, for this particular case, forces the moments to points along the axis. The Hamiltonian (under zero external field) can be written as:
| (1) |
All symbols have their usual meanings. The first term sums the bilinear products of two neighboring spins of the the same layer and afterwards the contribution of all layers are added together. The second term sums all the bilinear product of two neighboring spins (each belong to a different but an adjacent layer). The third term is a sum over all single-ion anisotropic energies. Using standard linear spin-wave approximation (considering a non-interacting magnon gas), Eq. 1 can be diagonalize to give the following dispersion relation:
where (the quantization axis), , axes are, respectively, along the (easy direction), , directions of the crystallographic unit cell. In the long wave limit, up to second order, this simplifies to:
| (2) |
Assuming a weaker orthorhombic distortion (ab and ), one gets:
The energy gap () is:
| (3) |
The expression for the density of states (obtained from integrating over the constant energy surface, ) is:
| (4) |
The magnon contribution to the total energy is:
where is a constant independent of temperature. Using Eqs. 2, 3, and 4, the molar specific heat is ( is the number of moles):
where
The final result can be rearranged to give:
| (5) |
where
| (6) |
is the spin-wave stiffness coefficientKittel (1963) which is a measure of the effective coupling strength. This expression reproduces the high temperature limit ,
which for gives the well known -Bloch expression.Kittel (1963) At lower temperatures , the strong dependence on the gap is emphasized by the expression: