A simplified optical lattice clock
Abstract
Existing optical lattice clocks demonstrate a high level of performance, but they remain complex experimental devices. In order to address a wider range of applications including those requiring transportable devices, it will be necessary to simplify the laser systems and reduce the amount of support hardware. Here we demonstrate two significant steps towards this goal: demonstration of clock signals from a Sr lattice clock based solely on semiconductor laser technology, and a method for finding the clock transition (based on a coincidence in atomic wavelengths) that removes the need for extensive frequency metrology hardware. Moreover, the unexpected high contrast in the signal revealed evidence of density dependent collisions in 88Sr atoms.
pacs:
06.30.Ft 42.62.Fi 32.70.Jz 37.10.Jk 42.62.Eh 42.55.PxI Introduction
Optical atomic clocks have recently reached levels of performance that are an order of magnitude or more beyond those of their microwave counterparts, which have historically set the standards for precision time/frequency metrology. With this improved level of precision, scientists are performing new and more stringent tests of fundamental physical principles such as relativity and searches for temporal drifts in the fundament constants rosenband08 ; blatt08 . Additionally, we anticipate that many new applications will arise, including improved timing for space travel and accelerator centers, as well as perhaps a new type of relativity-based geodesy kleppner06 . These applications will require more compact, robust, and versatile versions of optical atomic clocks. Thus far, state-of-the-art optical clocks, whether based on neutral or charged atoms, tend to be fairly complicated pieces of scientific apparatus. They usually require multiple (often sophisticated and power hungry) laser systems, operate in well controlled environmental conditions, and rely on links to well developed frequency standards. For these reasons, most optical clocks are being developed in or near metrology institutes.
Here we present a considerably simplified version of one of the most promising optical clock systems, the Sr lattice clock. Due to the favorable laser wavelengths required for its operation, the Sr lattice clock is a good choice for streamlining, and in fact is the most mature of lattice clocks, with many under development around the world ferrari03 ; Katori2 ; ludlow08 ; baillard08 ; legero07 . In a recent demonstration, a Sr lattice clock achieved an absolute fractional frequency uncertainty (for 87Sr) of 1.5 x 10⁻¹⁶ and a fractional instability of 10-16 for an averaging time of 200 s ludlow08 . In our version of a 88Sr lattice clock, we demonstrate two important simplifications. First, we use only lasers that are based on semiconductor laser technology. These lasers considerably simplify the apparatus and greatly reduce the power/size requirements. Second, we take advantage of a coincidence in the Sr atomic energy level system to greatly simplify the needle-in-a-haystack challenge of locating the ultranarrow spectroscopic feature used for stabilizing the clock laser. This transfer cavity-based technique removes the need for support from a standards institute or a GPS-referenced femtosecond-laser frequency comb to calibrate the clock laser, and can correct unexpected length changes in the clock reference cavity (e.g., in a transportable device with a poorly controlled environment). This simplified search method is further aided by a new search algorithm based on chirping the laser frequency over a one-second probe period, which has led to spectroscopic features with a contrast greater than 99 . These developments represent important steps towards a transportable device, which could enable long-distance frequency comparisons at well below the 10-15 level, and could also lead to simpler laboratory-based devices.
II Diode laser-based Sr lattice clock apparatus
As pointed out in the introduction, the level scheme of neutral Sr offers some interesting advantages relative to other atoms/ions when realizing a compact optical atomic clock. All of the relevant transition wavelengths for cooling and trapping lie in the visible or near infrared and can be easily reached with semiconductor devices (see Fig.1). Further reduction of the complexity of the setup comes from the use of a magnetic-field-induced spectroscopy scheme to observe the doubly-forbidden clock transition on bosonic isotopes TY06 ; baillard07 ; poli08 . In this technique a static magnetic field is used to mix the 3P0 metastable state with the 3P1 state, enabling direct optical excitation of the clock transition with tunable transition rates. Details on our experimental setup and the laser sources used for cooling and trapping 88Sr have been previously reported in poli07SPIE ; poli07 . In brief, 88Sr atoms are collected from a slowed Sr beam and cooled in a two-stage magneto-optical trap (MOT). The MOT uses the strong dipole allowed transition at 461 nm to cool and collect atoms, and then uses the intercombination transition at 689 nm to cool the atoms to a temperature of 1 K. To generate the 461 nm light we double the frequency of a 922 nm diode/amplifier laser combination with a resonant cavity containing a bismuth triborate (BiBO) non-linear crystal. The second-stage cooling uses light from a frequency-stabilized 689 nm diode laser that is locked to a narrow resonance of a high-finesse Fabry-Perot cavity. The frequencies of the trapping lasers are stabilized to their respective atomic resonances by means of spectroscopy in Sr heat-pipes. To increase the first-stage MOT lifetime (and thus, the number of trapped atoms) repump light at 497 nm is used to keep the atoms from getting shelved in the state by exciting the transition. The 497 nm light is generated by doubling the frequency of a 994 nm diode laser with a resonant cavity containing a KNbO3 crystal. To further simplify the apparatus, this doubled laser system at 497 nm could be replaced with two semiconductor lasers at 707 nm and 679 nm.
With this apparatus, typically atoms are trapped at 1 K in a loading period of 300 ms. About atoms are then loaded into a 1D standing wave optical lattice operating at the magic wavelength for the clock transition (813.43 nm) Katori2 . A lattice potential depth of about 8 K (or 50 Er in units of the atomic recoil energy, Er) is realized by tightly focusing (waist 30 m) 200 mW of light coming from a 813 nm diode laser/amplifier combination. To prevent optical feedback in the tapered amplifier, which can induce phase fluctuations in the lattice potential that lead to atom loss, two 40 dB stages of optical isolation are necessary between the amplifier output and the atoms. Under these conditions the measured lifetime in our trap is around 2.5 s, limited by background gas collisions.
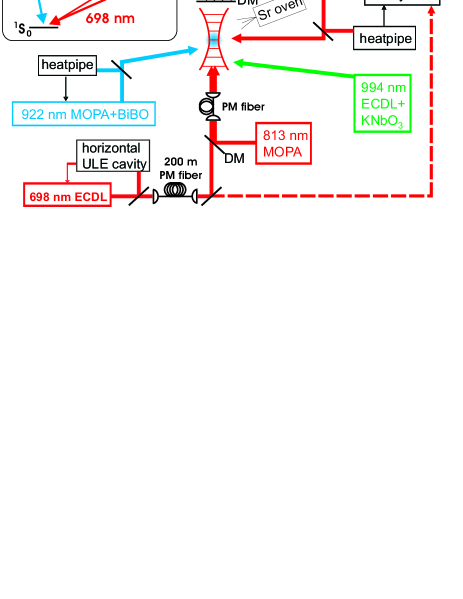
After the loading sequence, the clock transition at 698 nm is probed after a 50 ms delay that allows for the quadrupole magnetic MOT field to dissipate and the static magnetic field to be turned on for the spectroscopy. To reduce systematic effects related to the alignment of the probe with respect to the infrared laser, the probe and lattice beams are superimposed on a dichroic mirror and then coupled to the same single-mode optical fiber that delivers the light to the atom trap. After passing through the fiber, the two beams share the same polarization optics that define a linear polarization aligned with the vertical static magnetic field and the same achromatic lens that focuses light on the atomic cloud. The red 698 nm clock laser is produced in a separate quiet room by frequency stabilization of a 698 nm diode laser to a high finesse ULE (ultra-low expansion glass) cavity. The hertz-wide laser light is then sent to the room containing the Sr apparatus through a 200 m- long Doppler-cancelled optical fiber.
The frequency of the probe light from the master is shifted and controlled with double-passed 200 MHz acusto-optic modulators (AOM), and then amplified by an injection-locked diode laser. All of the RF signals for driving the AOMs on the clock light are generated with computer-controlled DDS (direct digital synthesis) synthesizers phase-locked to a 10 MHz reference signal. This reference signal is generated by a BVA quartz crystal that is slaved to a rubidium standard, which can be steered to a GPS clock signal. The use of double-passed high-frequency AOMs and a computer-controlled DDS system enables the possibility of chirping the clock light frequency with a maximum span of 100 MHz (at maximum rate of 2 MHz/s) without changing the optical path. We could then scan over a large interval of frequency values in a short period, which greatly accelerated initial searches for the clock transition, as we will describe. The atoms left in the ground state after the spectroscopy pulse are detected and counted by one of two methods: early measurements used calibrated absorption of a blue resonant beam imaged on a CCD camera, while high resolution spectrum are taken with a photomultiplier tube that detects induced fluorescence (at 461 nm) from ground state atoms.
III Finding the clock transition
One challenge in optical clock research is to find an atomic resonance with a natural (or induced) linewidth of below 10 mHz in the continuum of frequencies around 1015 Hz. Fortunately, the problem is considerably simplified for resonances whose frequencies have been previously precisely measured, as is the case for the Sr and Yb lattice clocks poli08 ; boyd07 . But even in this case, fairly precise calibration of the clock laser is needed to find the transition, because the transition can usually be artificially broadened only to tens of kilohertz, and standard wavemeters have absolute uncertainties of 50 MHz to 100 MHz. Thus, with a simple point-per-second algorithm, the search for the atomic transition could take hours. When the transition is used on a fairly regular basis, sometimes after extended periods of downtime, a more efficient search method is needed.
Therefore, two separate problems have to be solved. First, the transition must be initially found through a calibration of the probe laser frequency. Second, a part of the apparatus has to then be calibrated, so it can robustly be used to tune the probe laser frequency quickly to the resonance on a day-to-day basis.
These problems are usually solved with a combination of a femtosecond-laser frequency comb referenced to a frequency standard (Cs fountain, GPS, etc.) and an ultrastable reference cavity enclosed in a carefully monitored environment. The standard-referenced comb can be used to provide a precise absolute calibration of the probe laser frequency, while the cavity can serve as a day-to-day or even a week-to-week reference. This approach is feasible for systems located in metrology labs or labs with access to metrology lab-based signals, however for a transportable device, access to external standards could be limited and perturbations to the cavity could be so large as to move the reference fringe frequency by several megahertz, thereby limiting its reliability as a day-to-day frequency reference.
A different approach to these challenges can be used in Sr by taking advantage of the comparatively small difference in wavelength between the second-stage cooling laser (689 nm) and the clock laser (698 nm). To find the 698 nm transition for the first time, it is possible to use the 689 nm light, which is locked to the well-known frequency of the transition ido05 ; tino94 , to calibrate a commercial 7-digit wavemeter (Burleigh WP-1500). With this technique we were able to measure the offset in the frequency reading of the wavemeter ( 70 MHz), which we assumed would be similar for two wavelengths so close together. In this way we could achieve an absolute uncertainty for the 698 nm clock laser frequency of less than 5 MHz.
While this method provides an uncertainty level low enough to find the clock transition in a few trials (see next section), we can remove the need for the wavemeter on a day-to-day basis altogether, through use of the 689 nm pre-stabilization cavity as a transfer cavity layer76 ; martin06 . Fig. 2 shows the experimental setup used to provide a repeatable reference at 698 nm by means of the 689 nm pre-stabilization cavity (made with a 10 cm long quartz spacer).
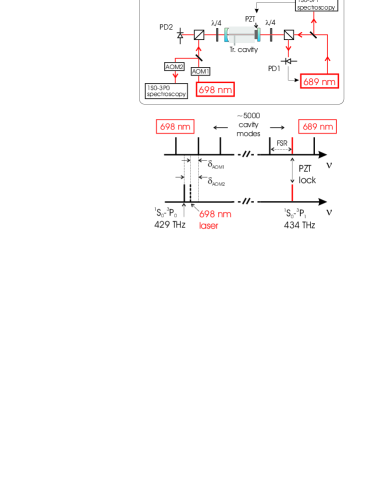
Its length is controlled by a piezo-electric transducer attached to one of the cavity mirrors and is stabilized on long time scales through spectroscopy on the 88Sr transition. Thus a comb of resonant frequencies spaced by the cavity free-spectral range is defined over tens of nanometers. Light beams coming from the two sources at different wavelengths are then coupled with orthogonal polarizations at opposite ends of the cavity. Two acousto-optic modulators are used to shift the frequency of the 698 nm light so that the first beam is resonant with the transition, while the second is simultaneously resonant with a mode of the transfer cavity stabilized on the atomic transition.
We found that due to the small frequency difference between the two wavelengths, they had comparable cavity finesse, with resonance widths of 150 kHz. This value is sufficient to measure and correct the possible drifts of the ULE cavity used for the 698 nm clock light with an accuracy of less than 10 kHz. We verified the effectiveness of this approach when we were able to recover the atomic signal quickly after a drift in the 698 nm reference cavity of several megahertz occurred due to a large variation in room temperature.
The discussion has thus far assumed that the transfer cavity always locks to the same longitudinal cavity mode when it is stabilized to the Sr heat pipe signal. In fact, the laser sometimes locks to a nearby mode instead. In this case, the frequency of the 698 nm light is no longer resonant with a mode of the 689 nm-stabilized transfer cavity, due to a differential mode shift. We have measured this shift and found it to be about 20 MHz per mode. As long as the day-to-day shifts are less than 10 MHz (they are usually less than 100 kHz in the lab), we can quickly rectify the situation by either tuning the transfer cavity back to the standard mode, or by accounting for the 20 MHz shift.
This method finds application not only in lab-based experiments, but also in future transportable devices, where frequent calibrations (e.g., due to shocks on reference cavities) could be necessary, and where the access to frequency combs and frequency references could be limited. By using the cavity transfer method, even when shocks change the mode numbers considerably, a few trials with different modes of the transfer cavity could be sufficient to reset the offset between the transfer cavity and the probe laser reference cavity without the need of external references.
IV Spectroscopy of the clock transition
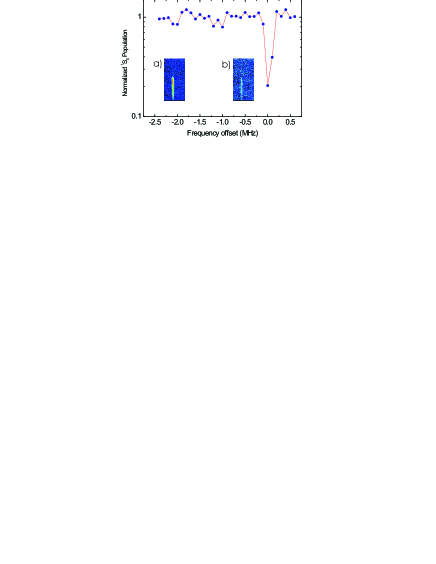
We excite the clock transition in 88Sr with the technique of magnetic field-induced spectroscopy TY06 . We initially find the transition by chirping the probe laser frequency over 200 kHz during each 1 s probe pulse in order to increase the searching rate. With a maximum magnetic field of 16 mT and a probe light intensity of 40 W/cm2, the effective Rabi frequency is estimated to be 13 kHz. This frequency is sufficiently high to ensure observable population transfer on resonance within the chirp range. Under these conditions we can find the transition quickly by taking 200 kHz frequency steps around the resonance and measuring the ground state population (see Figure 3). We prove this search method to be effective even in the case of a poor knowledge of the probe frequency, calibrated only using a commercial wavemeter. Moreover, as we can see in Fig. 3, the search is greatly simplified because of the large contrast on the signal. This enables us to find the transition even in the presence of large fluctuations () in atom number.
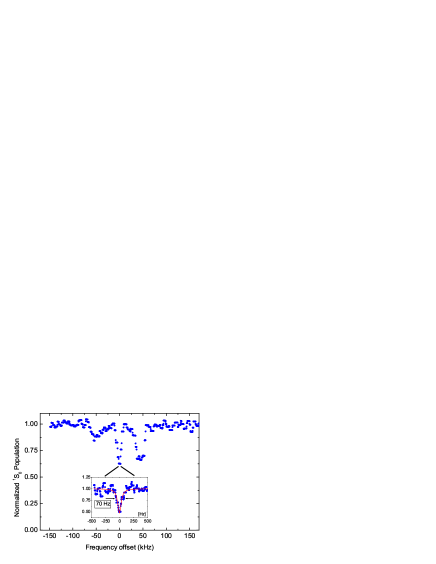
In Fig. 4 the data were taken without frequency chirping and with a reduced interaction time of 100 ms. The two spectra have been taken with static magnetic fields () of 13 mT and 1.3 mT (for the spectrum in the inset) respectively, and the probe intensities () were 38 W/cm2 and 6 W/cm2 (for the inset), giving induced Rabi frequencies () of 10 kHz and 130 Hz (inset). To minimize the effects due to residual frequency drifts in the clock laser, we modified the detection scheme for the data shown in Fig. 4 to shorten the measurement cycle duration to 1 s. We replaced the CCD with a photomultiplier tube that collects fluorescence from ground-state atoms that are excited by resonant light at 461 nm. Additionally, we reduced the size of the residual drift of the clock frequency that results from drifts in the ULE reference cavity. By feeding a linear frequency ramp to the AOM located between the master clock laser and the slave laser we have reduced this drift from standard values of about 1 Hz/s to below 0.1 Hz/s.
Higher-resolution spectra reveal the usual set of three resonances seen in lattice clock spectroscopy Katori2 (see Fig. 4). From the frequency spacing and the amplitude ratio between the red and blue sidebands signals, we determined a lattice depth of = 55 Er and an estimated temperature of 2.6 K.
A clear difference in signal amplitude exists between spectra taken with different interaction times, as seen in Figs. 3 and 4. In particular, for long interaction times with the probe light, we observed instances in which the carrier and/or the blue sideband had virtually 100 contrast (i.e., the ground -state population is completely depleted). Under these overdriving conditions (pulse area 1000) we expect the amplitudes of the sidebands to be considerably modified relative to the pulse case, but this should not be true for the carrier. Normally, greatly overdriving a transition leads to a maximum excitation level around 50 as atoms are driven back and forth between the excited and ground states, as shown by the spectra taken with a shorter interaction time in Fig. 4. In fact, even for -pulses used with the carrier, 50 percent is a typical excitation level for lattice clock spectroscopy due to asymmetries in the excitation for different atoms resulting from inhomogeneities for quantities such as probe intensity or Rabi frequency. So the depletion levels greater than 99 were something of a surprise, and these have shown a strong dependence on pulse duration.
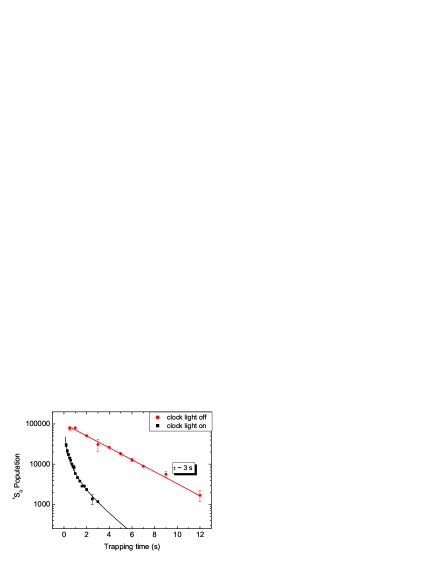
To explore this effect, we examined the decay of the ground state population for overdriven Rabi excitation (see Fig. 5) and compared it to the lifetime of the trap in the absence of resonant excitation on clock transition. From the decay plots, it is clear that when resonant clock light is present, the atoms are lost at a higher rate compared to the normal decay rate that results from background gas collisions that limit the trap lifetime to about =3 s. The faster decay in the presence of excitation light can be well described by the solution to a system of coupled rate equations , sterr08 . These equations describe the evolution of density of atoms in the 1S0 ground state and for the excited 3P0 state, respectively. In these two equations we introduce additional density-dependent loss terms and associated with density-dependent losses due to collisions between atom pairs in the excited state and collisions between ground- and excited-state atoms, respectively. The atomic density in the ground state is estimated from the measurement of the trap frequencies and atom temperature with an uncertainty of 50 %. Assuming a value of = 4*10-18 m3/s killian08 from the fit of the experimental data with the solution of the decay equations, we estimate the value for interstate collision coefficient to be = 3(2)*10-17 m3/s at measurement temperature of T = 1.5 K.
In one sense, this effect has the obvious benefit of making the transition easy to find, even in the presence of reasonably large shot-to-shot atom number fluctuations. Thus overdriving the transition is now a standard part of our search algorithm. However, this effect could also present a strong limitation for operating a 88Sr 1D lattice clock at high densities, and underfilled 2D traps or 3D traps could be the only way to overcome this effect in view of making an accurate optical lattice clock based on bosonic 88Sr.
V Summary
As lattice clocks (and optical clocks in general) continue to improve, it is also important that we continue to look for ways to simplify the clocks, so they can reach a wider range of applications. We have now demonstrated several key facets of an ultimately transportable lattice clock system. We have constructed an apparatus that uses only lasers based on semiconductor technology, which greatly reduces the size and power requirements over previous versions. We have also shown how the comparatively small 3P fine structure splitting in Sr allows us to quickly find the clock transition without relying on extensive metrology apparatus. In the course of this development, we found a way to achieve extremely high levels of ground-state population depletion (more than 99 ), which further expedites the search procedure. An initial investigation into the source of the unexpectedly high contrast revealed evidence of density dependent collisions, an effect we plan to explore in more detail in future studies. We thank G. Ferrari, A. Alberti, V. Ivanov, R. Drullinger and F. Sorrentino for their work in the initial part of the experiment. We thank S. Chepurov, D. Sutyrin, and U. Sterr for helpful discussions and S. Xiao and R. Fox for a careful reading of the manuscript. We thank INOA staff for the loaning of wavelength meter used in this work. This work was supported by LENS under contract RII3 CT 2003 506350, Cassa di Risparmio di Firenze, ASI, and ESA.
References
- (1) T. Rosenband et al., Science 319, 1808 (2008)
- (2) S. Blatt et al., Phys. Rev. Lett. 100, 140801 (2008)
- (3) D. Kleppner, Phys. Today 59 , 10 (2006)
- (4) G. Ferrari et al., Phys. Rev. Lett. 91, 243002 (2003)
- (5) M. Takamoto, F.-L. Hong, R. Higashi, and H. Katori, Nature (London) 435, 321 (2005).
- (6) A. D. Ludlow et al., Science 319, 1805 (2008)
- (7) X. Baillard et al., Eur. Phys. Jour. D 48, 11 (2008).
- (8) T. Legero, J.S.R. Winfred, F. Riehle, U. Sterr, Frequency Control Symposium, 2007 Joint with the 21st European Frequency and Time Forum. IEEE International, 119 (2007)
- (9) A.V. Taichenachev, V.I. Yudin, C.W. Oates, C.W. Hoyt, Z.W. Barber, and L. Hollberg, Phys. Rev. Lett. 96, 083001 (2006).
- (10) X. Baillard et al., Opt. Lett. 32, 1812 (2007).
- (11) N. Poli et al., Phys. Rev. A 77, 050501 (2008)
- (12) N. Poli et al., Proc. SPIE 6673, 66730F (2007)
- (13) N. Poli, R. E. Drullinger, M. G. Tarallo, and G. M. Tino, Frequency Control Symposium, 2007 Joint with the 21st European Frequency and Time Forum. IEEE International, 655, (2007)
- (14) M. M. Boyd, A. D. Ludlow, S. Blatt, S. M. Foreman, T. Ido, T. Zelevinsky, and J. Ye, Phys. Rev. Lett. 98, 083002 (2007).
- (15) T. Ido, T. H. Loftus, M. M. Boyd, A. D. Ludlow, K. W. Holman, and J. Ye Phys. Rev Lett 94, 153001 (2005)
- (16) G.M. Tino et al., Appl. Phys. B 55, 397 (1994)
- (17) H. P. Layer, R. D. Deslattes, and W. G. Schweitzer, Jr., Appl. Opt. 15, 734 (1976)
- (18) P. Bohlouli-Zanjani, K. Afrousheh, and J. D. D. Martin, Rev. Sci. Instrum. 77, 093105 (2006)
- (19) Similar set of equations have also been used in J. S. R. Vellore Winfred et al., Proc. of 7th Symposium of Frequency standards and Metrology (2008)
- (20) A. Traverso et al. arXiv:0809.0936 (2008)