Optimal filter systems for photometric redshift estimation
Abstract
In the next years, several cosmological surveys will rely on imaging data to estimate the redshift of galaxies, using traditional filter systems with optical broad bands; narrower filters improve the spectral resolution, but strongly reduce the total system throughput. We explore how photometric redshift performance depends on the number of filters , characterizing the survey depth by the fraction of galaxies with unambiguous redshift estimates. For a combination of total exposure time and telescope imaging area of hrs m2, filter systems perform significantly worse, both in completeness depth and precision, than systems with filters. Our results suggest that for low , the color-redshift degeneracies overwhelm the improvements in photometric depth, and that even at higher , the effective photometric redshift depth decreases much more slowly with filter width than naively expected from the reduction in . Adding near-IR observations improves the performance of low systems, but still the system which maximizes the photometric redshift completeness is formed by filters with logarithmically increasing bandwidth (constant resolution) and half-band overlap, reaching mag deeper, with better redshift precision, than filter systems. A system with constant-width, non-overlapping filters reaches only mag shallower than filter systems, but has a precision almost 3 times better, vs . We briefly discuss a practical implementation of such a photometric system: the ALHAMBRA survey.
Subject headings:
Cosmology; photometric redshifts; galaxy surveys1. Introduction
Photometric redshift estimation is not a new technique (Baum 1962, Loh & Spillar 1986, Koo 1985, Connolly et al. 1995; see Koo 1999 for a history of the method), but it has considerably developed in the last decade, especially following the Hubble Deep Field (HDF) observations (Williams 1996, Casertano et al. 2000), which provided catalogs with excellent photometric quality and abundant spectroscopic redshift coverage. This allowed astronomers to thoroughly test standard photo-z techniques and try new approaches (Gwyn & Hartwick 1996, Lanzetta, Yahil & Fernández-Soto 1997, Sawicki, Lin & Yee 1997, Fernández-Soto, Lanzetta & Yahil 1999, Brunner et al. 1997, Benítez et al. 1999, Benítez 2000, Bolzonella, Miralles & Pelló 2000).
As Hickson, Gibson & Callaghan (1994) first showed, multiband narrow filters can be much more efficient to obtain redshifts than spectroscopy if the large area of the imaging cameras is factored in. Several photometric surveys, using different filter systems, have been proposed or implemented in the last decade: the UBC-NASA survey (Hickson & Mulrooney 1998), CADIS (Wolf et al. 2001b), COMBO-17 (Wolf et al. 2001a), COSMOS-21 (Taniguchi 2004), ALHAMBRA (Moles et al. 2008), DES (DES collaboration 2005), LSST (Tyson 2006), PanStarrs (Kaiser 2007), VST (Arnaboldi et al. 2007), and PAU (Benítez et al. 2008). These surveys represent powerful alternatives to deep spectroscopic surveys like DEEP2 (Davis et al. 2003), VVDS (Le Fèvre et al. 2003), or BOSS (Schlegel et al. 2007) at least for those scientific goals which only require limited redshift accuracy and low resolution spectral information.
However at least three of the imaging surveys (DES, LSST, PanStarrs) will work with photometric systems with optical broadband filters, similar to those traditionally used in Astronomy. It is obvious that using more, narrower filters, for a fixed exposure time, will significantly sacrifice photometric depth. However, photometric depth is not equivalent to photometric redshift depth. The fewer the filters, the more prone the system is to color-redshift degeneracies; these make impossible to unambiguously determine the redshift for a galaxy, even if observed at relatively high . The Hubble Ultra Deep Field (Beckwith et al. 2003) offers a good example. Despite the fact that the limiting magnitude in the HUDF is mag deeper than the HDF, the lack of a band filter in the HUDF makes the photometric redshift depth of both fields similar (Coe et al. 2006).
This letters explores the impact on photometric redshift performance of factors as the number of filters , constant vs. logarithmically increasing bandwidth, half-band overlaps, and near-IR observations. We also briefly discuss a practical implementation of a medium band filter system: the ALHAMBRA survey.
2. Simulations
2.1. Description of the filter systems
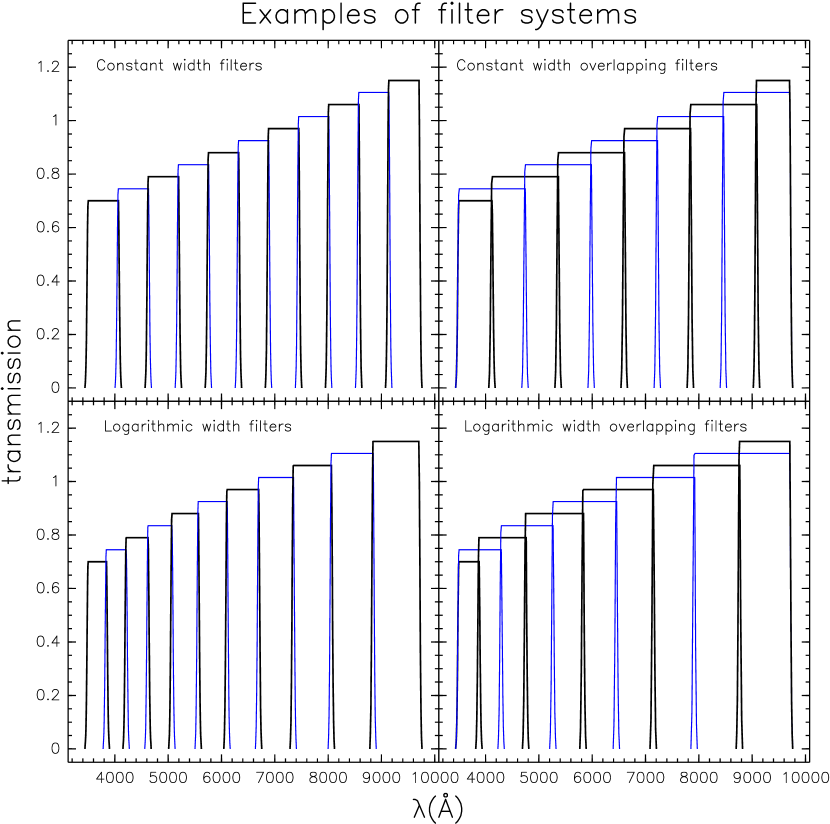
We assume that filters are almost “top-hat”, with a transmission which is constant in the central part and steeply falls on the edges, formed by half-Gaussian wings with a HWHM of Å. Although somewhat idealized, this is very similar to the characteristics of the filters provided by BARR Associates for the ALHAMBRA survey. We consider four type of photometric systems, depending on whether they have constant or logarithmically increasing () bandwidth, and whether they have half-width overlaps or just a minimal overlap corresponding to the filter wings. The filters cover the Åinterval. Fig. 1. shows examples of the 4 types of filter systems considered.
2.2. Mock catalogs
To generate realistic galaxy distributions, we use the HDF catalogs of Fernández-Soto, Lanzetta & Yahil (1999) and Yahata et al. (2000). It is possible to obtain accurate and reliable photometric redshifts and type classifications, based on the extended Coleman, Wu and Weedman (1980) set for these galaxies up to (Benítez 2000, Fernández-Soto et al. 2001). We use the distribution of , Bayesian spectral type and Bayesian photometric redshift obtained from these catalogs with the software BPZ (http://acs.pha.jhu.edu/txitxo, Benítez 2000) and the empirically calibrated spectral library of Benítez et al. 2004. The original input catalogs contain 822 galaxies with . For each filter set combination, our simulation includes galaxies, generated by randomly choosing objects from the HDF catalogs. The depth reached by our simulations (up to ) precludes using an input catalog based on spectroscopic redshifts, which would not be complete enough at those magnitudes. Since the accuracy of the input photometric redshifts is , we perturb them by a similar, randomly distributed amount to produce a more realistic redshift distribution.
We assume a constant total exposure time of s (28hrs) per pointing, and vary the number of filters . The average exposure is thus . Instead of using a fixed observing time per filter we distribute the exposures trying to reach constant for a same AB magnitude, with two constraints: the minimal exposure time per filter is, for practical reasons, at least s, and we do not expose more than twice the length of the average exposure, i.e. to avoid spending too much of the total time on the filters which are less efficient. For wavelengths Åthe efficiency is so low that we set this limit to be .
Using this information, we generate the expected magnitudes in all the filter systems described in the above section using functions included in the BPZ package. For Å filters the corresponding limiting magnitudes are bluewards of Å and quickly degrades to at Å. As it is obvious, for a fixed total exposure time, the limiting flux in a filter will be roughly inversely proportional to the square root of the filter width .
As a last step we add random photometric noise whose amplitude has been estimated using the WHT exposure time calculator111 Based on the SIGNAL software, by Chris Benn scaling it to a 3.5m telescope. The product of exposure time by telescope area is hrs m2, and therefore the results obtained here are equivalent to e.g. what could be obtained in a few hours of total exposure time with a m telescope.
We also scale the as a function of the magnitude of the galaxies. We do not take into account the dependence of size, etc. with magnitude. These are second order effects which will have a similar impact on all the filter systems and therefore are not expected to significantly affect the comparison among them.
3. Comparison among different filter systems
The photometric redshifts for the mock catalogs are estimated using the BPZ package. The software provides a Bayesian estimate of the redshift and a spectral type classification. The expected reliability of the photo-z can be gauged through the Bayesian odds. The value of this parameter corresponds to the amount of redshift probability concentrated on a region around the probability maximum. Low values of the odds indicate a multimodal or very extended, little informative , indicating that the photometric information is insufficient to obtain a unambiguous estimate of the galaxy redshift. By selecting objects with high odds, e.g. , one can produce highly reliable samples (Benítez 2000), with very good redshift accuracy and a very low rate () of “catastrophic” outliers. Therefore, it is possible to accurately characterize the effective completeness of a photometric redshift catalog by using the amount of galaxies with odds above a certain threshold, which tells us how many galaxies we can expect to have meaningful, univocal photometric redshifts.
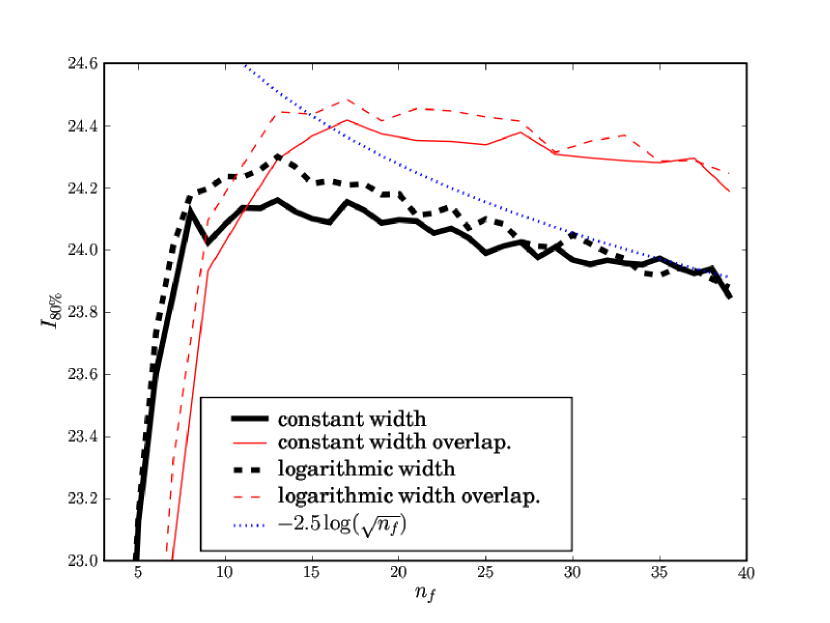
For a set-up with a total exposure time and total number of filters , the signal–to–noise in an individual filter, assuming that we are limited by the sky background, would roughly change as . A way of comparing depths across different systems is the in a fixed width band (obtained by combining all the individual filters included in that band): . Therefore, by increasing the number of filters we would expect the effective limiting magnitude at a fixed level to diminish quite drastically, as const, e.g. equivalent to the loss of a full magnitude going from to filters.
Fig. 2 describes how the completeness magnitude limit behaves for each of the filter systems. We see that for contiguous filters, the completeness depth sinks fast for , and that the optimum number of filters is , after which the effective completeness magnitude decreases, but much more slowly than expected from the change in the photometric limiting magnitude. This shows that for systems with low , the color-redshift degeneracies introduced by an insufficient wavelength resolution dominate over the improvement in achieved by the increased filter width.
Fig. 3 shows what happens when we add moderately deep near-IR observations with limiting (Vega) magnitudes of . There is a very significant, almost mag increase in the completeness magnitude, and the behavior of the low systems relatively improves, but still the most efficient overall performer is a logarithmically increasing bandwidth, half-band overlapping system with filters, which reaches a completeness limit mag deeper than a typical filter system with the same exposure time, while having a better accuracy.
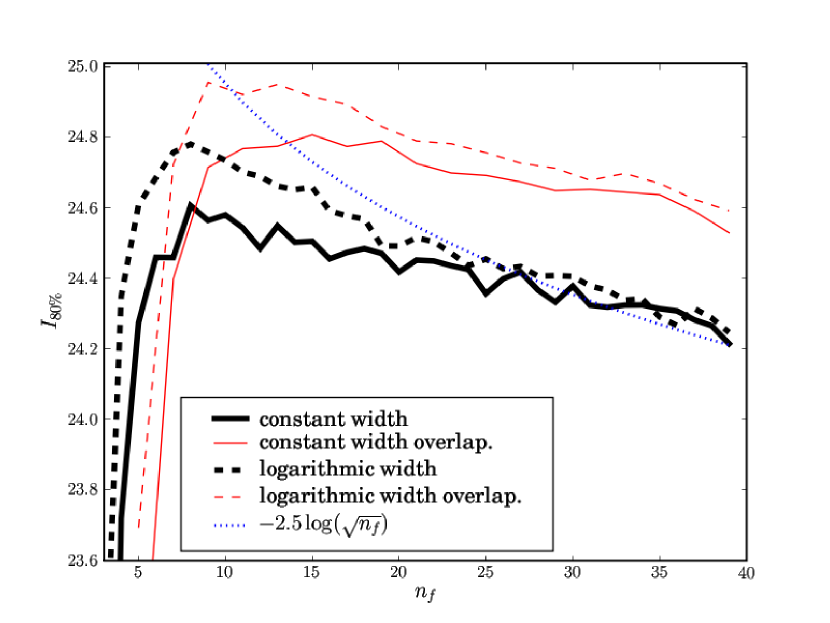
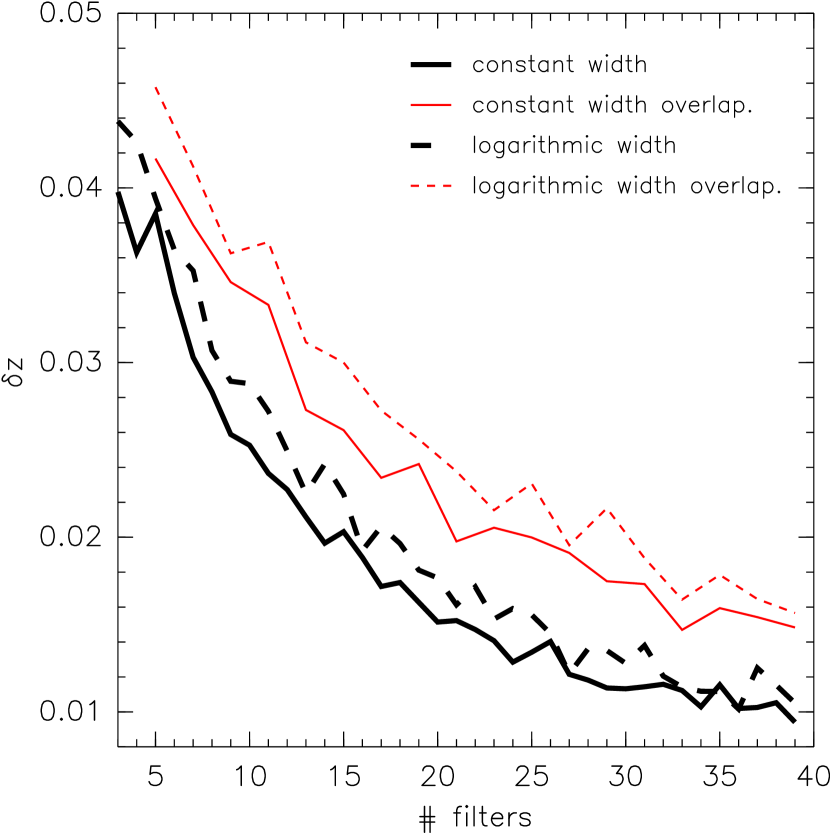
Another obvious quantity to consider is the accuracy of the photometric redshifts for the high sample, estimated using the of the quantity , plotted in Fig. 4. Here we see that, as expected, the redshift precision quickly and monotonously improves with and that adjacent filter systems perform much better than overlapping ones. From Fig. 3 we can see that a adjacent system with reaches a completeness depth similar to traditional systems with , but an accuracy significantly better: vs .
4. The ALHAMBRA Survey
Considering the above results, plus additional requirements on emission line detection, the ALHAMBRA (Advanced, Large, Homogeneous Area, Medium Band Redshift Astronomical) survey decided to use a constant-width, non overlapping filter system, complemented with near-IR observations. ALHAMBRA had an additional requirement, the detection of a large fraction of galaxies with emission lines, which favored the choice of filters. The ALHAMBRA rest-frame detection limits for a typical AB galaxy are EW(H)Å out to , and EW(OII)Å out to . From comparison with Hippelein et al. 2003, ALHAMBRA expects to detect % of the H emitters at , and % of the OIIobjects to ; since of field galaxies at those redshifts have detectable emission lines (Tresse & Maddox 1998) we expect to detect lines for a large fraction of our whole sample.
The survey is imaging 4 sq. degrees with the camera LAICA at the Calar Alto 3.5m telescope and also obtaining deep observations with Omega2000 at the same telescope.The survey characteristics, scientific goals and preliminary results are described in detail in Moles et al. (2008). A good test of the simulations presented in this paper is a comparison with ALHAMBRA. The mock catalogs predict that, with 20 filters, ALHAMBRA should be able to reach a precision of for galaxies. Preliminary results show that the measured redshift error (Moles et al. 2008) is similar or less than , supporting the validity of the simulations presented in this paper.
5. Conclusions
We explore the performance of four different uniform filter systems with constant and logarithmically increasing () widths, and with half-width overlaps or just a minimal overlap corresponding to the filter wings, and use, as a measure of survey effective depth, the fraction of galaxies with a compact, unimodal probability redshift distributions as a function of magnitude. Our simulations employ a realistic input catalog, based on HDF photometric redshifts, and correspond to a combination of total exposure time and telescope area of hrs m2. We find that traditional optical filter systems clearly underperform, both in terms of completeness magnitude limit and precision, systems with filters.
Our results suggest that for low , the effect of color-redshift degeneracies dominates the advantages of increased photometric depth, and that even at higher , the effective photometric redshift depth decreases much more slowly with filter width than naively expected from the reduction in . Adding near-IR observations increases the overall depth, alleviating color-redshift degeneracies and improving the relative performance of low systems. However the optimum performance still comes from a system with filters with logarithmically increasing bandwidth (constant resolution) and half-band overlap, which reaches mag deeper, with better redshift precision, than filter systems. For many scientific applications, which require both precision and depth, the use of medium band filters is clearly advantageous. A system with constant-width, non-overlapping filters reaches only mag shallower than filter systems, but has a precision almost 3 times better, vs , as a practical implementation of such a system, the ALHAMBRA survey, shows.
Since it is well known that color-redshift degeneracies worsen with magnitude depth, it can be expected that the relative decoupling between photometric depth and photometric redshift depth described here will be more significant for surveys which reach fainter limits than those considered in our simulations, and less important for shallower observations, where the color/redshift degeneracies are less of a problem. In any case, future projects will have to seek an optimum number of filters based on their particular observing parameters and science goals.
References
- The Dark Energy Survey Collaboration (2005) The Dark Energy Survey Collaboration 2005, ArXiv Astrophysics e-prints, arXiv:astro-ph/0510346
- Arnaboldi et al. (2007) Arnaboldi, M., Neeser, M. J., Parker, L. C., Rosati, P., Lombardi, M., Dietrich, J. P., & Hummel, W. 2007, The Messenger, 127, 28
- Baum (1962) Baum, W. A. 1962, IAU Symp. 15: Problems of Extra-Galactic Research, 15, 390
- Beckwith et al. (2003) Beckwith, S. V. W., et al. 2003, Bulletin of the American Astronomical Society, 35, 723
- Benítez et al. (1999) Benítez, N. , Broadhurst, T. , Bouwens, R. , Silk, J. & Rosati, P. 1999, ApJ, 515, L65
- Benítez (2000) Benítez, N. 2000, ApJ, 536, 571
- Benítez et al. (2004) Benítez, N. et al. 2004, ApJS, 150, 1
- Benítez et al. (2008) Benítez, N. et al. 2008, ApJ, in press, arXiv:0807.0535
- (9) Bolzonella, M., Miralles, J.-M., & Pell ́o, R. 2000, A&A, 363, 476
- Brunner et al. (1997) Brunner, R. J., Connolly, A. J., Szalay, A. S., & Bershady, M. A. 1997, ApJ, 482, L21 & Tsvetanov, Z. 2001, AJ, 121, 3266
- Casertano et al. (2000) Casertano, S., et al. 2000, AJ, 120, 2747
- Connolly et al. (1995) Connolly, A. J., Csabai, I., Szalay, A. S., Koo, D. C., Kron, R. G., & Munn, J. A. 1995, AJ, 110, 2655
- Coe et al. (2006) Coe, D., Benítez, N., Sánchez, S. F., Jee, M., Bouwens, R., & Ford, H. 2006, AJ, 132, 926
- Coleman, Wu, & Weedman (1980) Coleman, G. D., Wu, C.-C., & Weedman, D. W. 1980, ApJS, 43, 393
- Davis et al. (2003) Davis, M. et al. 2003, Proc. SPIE, 4834, 161
- Fernández-Soto et al. (1999) Fernández-Soto, A., Lanzetta, K., & Yahil, A. 1999, ApJ, 513, 34
- Fernández-Soto et al. (2001) Fern ́andez-Soto, A., Lanzetta, K. M., Chen, H., Pascarelle, S. M., & Yahata, N. 2001, ApJS, 135, 41
- Gwyn & Hartwick (1996) Gwyn, S. D. J. & Hartwick, F. D. A. 1996, ApJ, 468, L77
- Hickson, Gibson, & Callaghan (1994) Hickson, P., Gibson, B. K., & Callaghan, K. A. S. 1994, MNRAS, 267, 911
- (20) Hickson, P. & Mulrooney, M.K. 1998, Astrophys. J. (Suppl.), 115, 35-42
- (21) Hippelein, H., Maier, C., Meisenheimer, K., Wolf, C., Fried, J.W., von Kuhlmann, B., Kuemmel, M., Phleps, S., Roeser, H.-J., 2003, A&A, 402, 65
- Kaiser (2007) Kaiser, N. 2007, American Astronomical Society Meeting Abstracts, 210, #51.02
- Koo (1985) Koo, D.C. 1985, AJ, 90, 418
- Koo (1999) Koo, D. C. 1999, ASP Conf. Ser. 191: Photometric Redshifts and the Detection of High Redshift Galaxies, 3
- Lanzetta, Yahil & Fernández-Soto (1996) Lanzetta, K.M., Yahil, A.& Fernández-Soto, A. 1996, Nature, 381, 759
- Le Fèvre et al. (2003) Le F ̀evre, O. et al. 2003, The Messenger, 111, 18
- Loh & Spillar (1986) Loh, E. D. & Spillar, E. J. 1986, ApJ, 303, 154
- Moles et al. (2008) Moles, M., et al. 2008, AJ, 136, 1325
- Sawicki, Lin, & Yee (1997) Sawicki, M. J., Lin, H., & Yee, H. K. C. 1997, AJ, 113, 1
- Schlegel et al. (2007) Schlegel, D. J., et al. 2007, American Astronomical Society Meeting Abstracts, 211, #132.29
- Taniguchi (2004) Taniguchi, Y. 2004, Studies of Galaxies in the Young Universe with New Generation Telescope, 107
- (32) Tresse, L., & Maddox, S.J., 1998, ApJ, 495, 691
- Tyson (2006) Tyson, J. A. 2006, in American Institute of Physics Conference Series, Vol. 870, Intersections of Particle and Nuclear Physics: 9th Conference CIPAN2006, 4452
- Williams et al. (1996) Williams, R. E., et al. 1996, AJ, 112, 1335
- Wolf et al. (2001a) Wolf, C., Meisenheimer, K., Roser, H.-J. 2001, A&A, 365, 660
- Wolf et al. (2001b) Wolf, C. et al. 2001a, A&A, 365, 681
- Yahata et al. (2000) Yahata, N., Lanzetta, K. M., Chen, H.-W., Fernández-Soto, A., Pascarelle, S. M., Yahil, A., & Puetter, R. C. 2000, ApJ, 538, 493