Equilibrium properties of a grafted polyelectrolyte with explicit counterions
Abstract
We study the equilibrium conformations of a grafted polyelectrolyte (PE) in the presence of explicit counterions (CI) using Monte Carlo simulations. The interplay between attractive Lennard-Jones interactions (parametrized by ), and electrostatics (parametrized by , where counterion valency, Bjerrum length and monomer diameter), results in a variety of conformations, characterized as extended (), pearls with beads (), sausage () and globular (). For large , we observe a transition from with increasing , i.e., a change from poor to good, to reentrant poor solvent, whereas, at lower , the sequence of transitions is, . The conformation changes are directly related to the nature of binding of CI onto the PE. The transition between is continuous and associated with critical fluctuations in the shape driven by fluctuations in the fraction of condensed CI.
I INTRODUCTION
The equilibrium properties of a polyelectrolyte (PE) are governed by an interplay between long-range attractive forces between monomers, electrostatic interactions arising predominantly from mobile counterions (CI), and polymer elasticity. Of these forces, electrostatics has been the most difficult to handle, both analytically and computationally, especially in the regime where the strength of the electrostatic interaction, parametrized by the ratio of the electrostatic condensation energy of the multivalent counterions and thermal energy, is high. While the behaviour at high temperature or low electrostatic energy is well described by the mean field Poisson-Boltzmann (PB) theory brilliantov-98 ; lee-04 ; muthu-04 , several computer simulation studies on PE, starting from deserno-00 , have reported qualitative deviations from PB at low temperatures or high electrostatic energy deserno-00 ; stevens-93 ; winkler-98 ; dunweg99 ; holm-01 ; holm-02 ; muthu-02 ; netz ; wada .
These studies reveal that the main cause for the deviation, is that PB theory underestimates the extent of CI condensation at high electrostatic coupling and low temperatures, and neglects spatial correlations. For instance, a study of the the equilibrium conformations of a PE as a function of charge density and solvent quality (restricting to weak electrostatics and poor solvent conditions) using a Debye-Huckel framework dunweg99 , demonstrated that with increasing charge density, the PE globule splits into a string of pearls, in agreement with scaling arguments dobrynin96 . Simulations with explicit CI muthu-02 verified the above and further showed a collapse of the PE at higher electrostatic coupling, due to attractive, dipolar interactions arising from the condensation of CI onto the monomers. Apart from these studies on free PE, the conformations of a constrained PE, such as a grafted PE, in the regime of low electrostatic coupling were examined using molecular dynamics (MD) simulations crozier-03 .
In this paper, we study the equilibrium phase diagram of a grafted PE, across a range of electrostatic couplings and solvent quality, using Monte Carlo (MC) simulations and scaling arguments. Our study highlights the competition between the monomer-monomer, monomer-counterion interactions and polymer elasticity. As a consequence, the PE exhibits a variety of phases, which we characterize as extended (), pearls with beads (), sausage () and globular (). With increasing electrostatic interaction, the PE exhibits the following sequence of conformations : . Thus, as a function of increasing electrostatic interaction, we go from poor to good to reentrant poor solvent. These conformation changes are intimately tied to the nature of binding of CI onto the PE. For weak electrostatic interactions, the CIs condense onto the PE and partially screen the monomer charge. However when the electrostatic interactions are stronger, we find that new composite degrees of freedom, such as dipoles comprising of monomer and CI charges, emerge. In addition, we find that the transition between to the reentrant is continuous and associated with critical fluctuations in the shape driven by fluctuations in the fraction of condensed CI.
II Model and Simulation details
Our model PE is a linear chain of spherical beads, of charge and diameter , connected through harmonic springs. One end of the PE is anchored to the wall at . To ensure charge neutrality, we introduce oppositely charged counterions with the same valency and diameter. We neglect hydrodynamic effects and treat the solvent as a dielectric continuum with permittivity . The system is bounded within a cubic box of volume , with impenetrable, non-polarizable walls at and . We apply periodic minimum image boundary conditions along the and directions netz . We ignore any contribution from image charges at the boundaries along the axis.
In our simulation, we model the non-electrostatic interactions by (i) a Lennard-Jones (LJ) potential,
| (1) |
between all particles and (ii) a harmonic spring potential acting between connected beads of the PE,
| (2) |
where we take the spring constant, , for the simulation. For monomer-monomer interaction we choose and for the CI-CI and monomer-CI interactions and . The electrostatic potential between any pair of beads is,
| (3) |
where gives the sign of the ion charge. The electrostatic coupling strength measures the ratio of the coulomb to thermal energy when the distance of separation between two charges is ; here is the valency of the monomer and , is the Bjerrum length. From now on, we will write all distances in units of and energy in units of .
We determine the equilibrium conformations and phase diagram of this grafted, flexible PE, with explicit counterions, over a wide range of values of the electrostatic coupling and LJ parameter , using the standard Monte Carlo Metropolis scheme. We use the well known Umbrella sampling technique torrie74 ; frenkel92 to obtain the free energy profile of the PE-CI system as function of its radius of gyration, . This method uses a weight function to bias the MC sampling of configuration space in such a way that the less probable states of the system are sampled frequently. In our simulation, we introduce the weight function by adding a harmonic potential to the total energy of the system. By varying , we sample the whole configuration space and measure the distribution of , from which we calculate the free energy of the PE.
III Equilibrium Phase Diagram
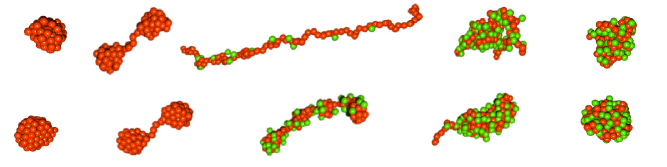
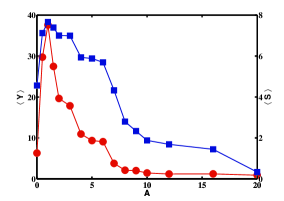
The equilibrium phase diagram of the grafted PE, determined by an interplay between interactions (electrostatics and attractive LJ) and entropy (polymer and CI), is fairly subtle and is shown in Fig. 1. We characterize the phases as Globular (), Sausage (), Pearls with -beads () and Extended (E), by the -dependent scaling of conformational measures, such as the radius of gyration and the anisotropy of the gyration tensor; typical conformations are shown in Fig. 3. Let us remind ourselves of the polymer conformations when . As a function of , the polymer goes from being a self-avoiding random coil in good solvent conditions, characterized by the Flory behaviour, , to a collapsed globule (G) in a poor solvent, characterized by , via a first-order transition at degennes78 .
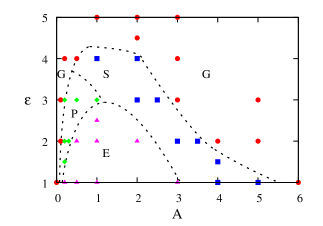
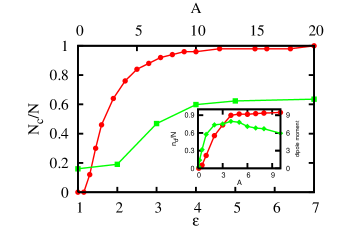
As we turn on the electrostatic interaction, the PE undergoes a sequence of shape changes, depending on the value of . In the range, , the PE changes from a self-avoiding random walk (SAW) to an extended conformation (E), as varies between and muthu-02 ; netz . This is because, while the electrostatic interaction increases, the CI entropy prevents condensation onto the PE. The net electrostatic interaction between the monomers is repulsive resulting in an extension of the PE, and an . When , a finite fraction of CIs condense on the monomers; at , for instance, of CI condense onto the PE (Fig. 2). This results in reducing the net monopole charge on each monomer, and pairing the monomeric charge with the CI to form dipoles muthu-02 . Such dipoles are the emergent degrees of freedom when ; this leads to an effective attractive interaction, and the configuration resembles a Sausage (S). As is increased to , complete condensation of the CI takes place, resulting in a collapse into a globule (G).
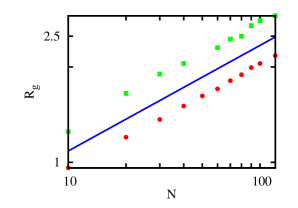
For larger values of the attractive LJ potential, a new set of phases intervene between the globular phase (G) at , and the extended phase (E). These phases occur when (stronger short range attraction) and (negligible CI condensation), and therefore arise from a competition between short range attractive interactions, long range electrostatic repulsion between monomers and polymer entropy, akin to the well-known Rayleigh instability. The resulting conformation is a string of pearls with -beads (), with increasing with kantor95 ; schiessel98 ; dobrynin96 ; dunweg99 (see Fig. 3 ). At large scales, the conformations in the phase is dominated by the electrostatic repulsion between the pearls, and the radius of gyration scales as , with a prefactor proportional to the bead size. The subsequent behaviour as a function of depends on the value of the attractive . In the range, , the PE changes from (where is the maximal allowed by the finite size of the polymer) to an extended (E) conformation, as increases towards . This is because the attractive interactions are not strong enough to compete with the increasing electrostatic (monomer-monomer) repulsion as increases. In this range of , the conformation then changes from , as described in Fig. 3. As we increase the attraction , we lose the extended phase entirely, and the PE goes from , and subsequently to a reentrant phase as we tune the electrostatic repulsion as shown in Fig. 3.
The conformations at large , namely, the S and the reentrant G phases, are a consequence of the emergent dipole degrees of freedom. In the inset of Fig. 2 we plot the net dipole moment and the fractional number of emergent dipoles () of the PE as a function of for . The dipole moment shows a maximum before the globular phase is reached – at this stage, the number of dipoles is small. As we increase , the number of dipoles increase, but the net dipole moment starts to decrease, as the PE conformation gets more compact in the G phase. The scaling of the radius of gyration in the two G-phases (at low and high ) is the same — (poor solvent !), as shown in Fig. 4.Thus, the reentrant G-phase, while structurally similar to the initial G-phase at , is different only in its electric dipole characterisitics.
At larger values of the attractive potential , the PE conformations go directly from or even from at still higher values of , where the latter -phase has a dipole moment. These direct transitions are consistent with the behaviour of the fraction of condensed CI, which increases with , for a fixed (Fig. 2). The enhancement of CI condensation, which is a result of electrostatic correlations, results in a strong screening of the monomer-monomer interactions.
Before we end this section, a word about finite size effects. In our simulations on finite PEs, the scale for the maximum bead number in the phase is set by system size, and in the thermodynamic limit of , there should be a finite fraction of beads. At this stage we are unsure about how the phase boundaries discussed above would shift as we increase , or even whether the S phase exists in the thermodynamic limit.
IV Continuous transition from : anomalous fluctuations of the sausage
The phase diagram (Fig. 1) shows a transition from (reentrant) , upon reducing the electrostatic coupling from a high value. This transition is a symmetry breaking transition; the appropriate order parameter characterizing the spontaneous breaking of spherical symmetry is the asphericity parameter, where , are the eigenvalues of the gyration tensor of the PE, with as the largest. The asphericity for a globule; Fig. 5 shows how this asphericity changes as a function of . At the transition, this symmetry breaking order parameter changes continuously, suggesting a 2nd-order phase transition. On the other hand the transition at small seems abrupt, suggesting a first-order transition. We also plot the structural quantity , where is the squared end-to-end distance csajka-00 ; netz03a , as a function of ; this quantity is for a gaussian chain and for a rigid rod.
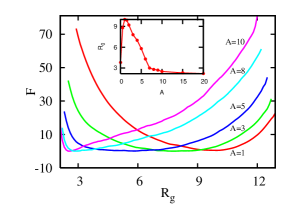
To understand the nature of the phase transitions better, we compute the free energy of the PE with the CI, as a function of , for different values of . The smooth variation of the free energy profile and its minimum with increasing (Fig. 6), as one moves from , is consistent with the continuous transition described above. Indeed at around , when we are in the -phase, the minima in the free energy profile is extremely shallow, suggesting that the fluctuations of shape in this regime would be large, consistent with its proximity to a critical point.
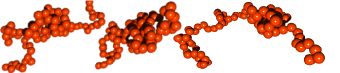
We explicitly study the fluctuations in the configurations in the S-phase; snapshots of the equilibrium configurations displayed in Fig. 7, show very strong shape fluctuations, with significant sampling of both extended and collapsed conformations. These large fluctuations of the PE shape in the S-phase are accompanied by strong fluctuations in the fraction of condensed CI (Fig. 8). The dynamical interplay between the PE shape and condensed CI , is shown in Fig. 8 – whenever there is a transient enhancement of the condensed CI fraction, the PE chain gets more compact (owing to the effective dipolar attraction), and whenever the condensed fraction is low, the chain gets stretched out (owing to strong monomer-monomer repulsion) leading to a large negative value of the cross-correlator , where is the number of Monte Carlo steps .

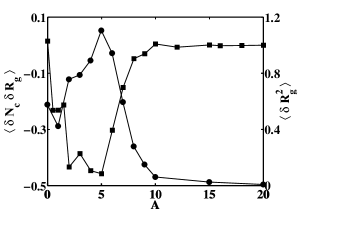
To quantify these fluctuations as a function of we compute the second moment of , , using the free energy . This quantity shown in Fig. 9 exhibits a peak around ( in the regime), with its height increasing with system size, indicating a critical point. The cross-correlator, shows a negative peak at exactly where the peak in appears reiterating the interplay between PE shape and condensation of CI. Our preliminary study to determine the order of the phase transition needs to be reinforced by a more detailed study of the scaling of fluctuations as a function of chain length ; we hope to return to this when we have better computational facilities at our disposal. However, if we take our study as evidence of a continuous transition, then this would imply that upon increasing , the critical line would necessarily terminate in a critical end point.
V Conclusion
Using extensive Monte Carlo simulations, we have explored the phase diagram of a grafted PE with explicit CIs, as a function of the electrostatic coupling and LJ interaction parameter . We have charaterized the phases in terms of the statistics of their conformations, and electrostatic measures, such as fraction of condensed counterions. We have uncovered four distinct phases : globular, string of pearls with -beads, extended, sausage and reentrant globule with nonzero dipole moment.
Our study, which treats the CI explicitly, highlights the strong correlation between collapse of the PE and the condensation of the CI. The dependence of CI condensation on (at low values of ), the emergent formation of dipoles from condensation of CI onto the PE, the anomalous fluctuations of the sausage, are all a consequence of these correlated ion effects. The appearance of new degrees of freedom, viz., dipoles, when , makes it difficult to construct an analytical theory valid for all values of . One possible approach would be to represent the CI by ‘two-species’, a monopole charge density and a dipole density, whose relative fraction depends on . We will explore these ideas in a future submission.
Acknowledgments
The simulations were carried out at the High Performance Computing Facility at IIT Madras. MR thanks HFSP and CEFIPRA 3504-2 for funding.
References
- (1) N. V. Brilliantov, D. V. Kuznetsov, and R. Klein, Phys. Rev. Lett. 81, 1434 (1998).
- (2) N.-K. Lee and S. Obukhov, Europhys. Lett. 66, 350 (2004).
- (3) M. Muthukumar, J. Chem. Phys. 120, 9343 (2004).
- (4) M. Deserno, C. Holm, and S. May, Macromolecules 33, 199 (2000).
- (5) M. Stevens and K. Kremer, Phys. Rev. Lett. 71, 681 (1993).
- (6) R. Winkler, M. Gold, and P. Reineker, Phys. Rev. Lett. 80, 3731 (1998).
- (7) A. V. Lyulin, B. Dunweg, O. V. Borisov, and A. A. Darinskii, Macromolecules 32, 3264 (1999).
- (8) H. J. Limbach and C. Holm, J. Chem. Phys. 114, 9674 (2001).
- (9) H. J. Limbach and C. Holm, Computer Physics Communications 147, 321 (2002).
- (10) S. Liu and M. Muthukumar, J. Chem. Phys. 116, 9975 (2002).
- (11) R. R. Netz, Phys. Rev. Lett. 90, 128104 (2003).
- (12) H. Wada, Y. Murayama, and M. Sano, Phys. Rev. E 72, 041803 (2005).
- (13) A. V. Dobrynin, M. Rubinstein, and S. P. Obukhov, Macromolecules 29, 2974 (1996).
- (14) P. A. Crozier and M. J. Stevens, J. Chem. Phys. 118, 3855 (2003).
- (15) G. M. Torrie and J. P. Valleau, Chem. Phys. Lett. 28, 578 (1974).
- (16) J. S. van Duijneveldt and D. Frenkel, J. Chem. Phys. 96, 4655 (1992).
- (17) P. G. de Gennes, J. Physique Lett. 39, 299 (1978).
- (18) Y. Kantor and M. Kardar, Phys. Rev. E 51, 01299 (1995).
- (19) H. Schiessel and P. Pincus, Macromolecules 31, 7953 (1996).
- (20) F. Csajka and C. Seidel, Macromolecules 33, 3728 (2000).
- (21) R. R. Netz, J. Phys. Chem. B 107, 8208 (2003).