A Systematic Description of Shocks in Gamma Ray Bursts II: Simulation
Abstract
In Paper I we presented a detailed formulation of the relativistic shocks and synchrotron emission in the context of Gamma-Ray Burst (GRB) physics. To see how well this model reproduces the observed characteristics of the GRBs and their afterglows, here we present the results of some simulations based on this model. They are meant to reproduce the prompt and afterglow emission in some intervals of time during a burst. We show that this goal is achieved for both short and long GRBs and their afterglows, at least for part of the parameter space. Moreover, these results are the evidence of the physical relevance of the two phenomenological models we have suggested in Paper I for the evolution of the active region, the synchrotron emitting region in a shock. The dynamical active region model seems to reproduce the observed characteristics of prompt emissions and late afterglow better than the quasi-steady model which is more suitable for the onset of afterglows. Therefore these simulations confirm the arguments presented in Paper I about the behaviour of these models based on their physical properties.
keywords:
gamma-rays: bursts – shockwaves.1 Introduction
Gamma ray bursts show a variety of behaviours both in their early/prompt emissions in all energy bands and in their late emissions in lower energies - usually called the afterglow. There have been a large number of simulations to reproduce some of the aspects of GRB emission. Some of them are based on the phenomenological formulation of the evolution of a relativistic shock and its synchrotron emission (Panaitescu et al., 1997; Panaitescu & Mészáros, 1998; Lu et al., 2006; Dai & Lu, 2002; Mimica et al., 2008). Their main goal has been to show that the idea of shock origin for the GRBs is essentially correct. Others are based on heavy numerical magnetohydrodynamics simulations of relativistic shocks and permit to reproduce some of the properties of GRBs from fundamental principles (Liang et al., 2006; Hededal & Nordlund, 2005; Nishikawa et al., 2008; Frederiksen, 2008; Nagataki et al., 2007; Tchekhovskoy et al., 2008). But they present a small volume of the parameter space. None of these formulations and related simulations can be directly and systematically applied to real bursts data to estimate their parameters.
With the simplified shock model explained in Paper I, we expect that the analytical approximation of the solutions of the kinematics and dynamics equations permit to simulate relativistic shocks and their synchrotron emission more consistently and realistically than previous simple formulations. Moreover, the relative simplicity of the formalism and the availability of analytical expressions for observables such as flux and lags should facilitate the extraction of the parameters and the estimation of the evolution of important physical quantities. In its turn, this knowledge will help us to better understand the properties of the central engines of GRBs and their surroundings.
A real GRB originates from one or more colliding shells. In Paper I we mentioned that simulations of the Fermi processes (Spitkovsky, 2008) show that the energy distribution of electrons and fields as well as the evolution of the synchrotron emission (Nagataki et al., 2007; Tchekhovskoy et al., 2008) are complex and simple distributions such as power-law or even a power-law with exponential cutoff are not good approximations for physical parameters. Nonetheless, within the precision of the available data, they can be sufficiently close approximations in a short time interval. Therefore, we can model an entire burst by dividing it to separate regimes. However, we must first explore the parameter space and understand how various parameters affect the synchrotron emission that is our only observable. This task is not simple because the model has a large number of parameters. We leave the systematic exploration of the parameter space to a future work. Here our goal is to see if at least for some set of parameters this model can reproduce the observed features of the GRB emission.
We consider a few set of parameters, determine various physical quantities explained in Paper I and their evolution, such as , (The definition of parameters are summarized in Table 2 and details can found in Paper I.), and observables such as light curves and spectrum. We remind that these simulations meant to correspond to a time interval in the life of a GRB and do not present the whole emission. For determination of the light curves and spectrum we have used equation (60-Paper I) and we have neglected the terms proportional to which are the contribution of high latitude emission and their Doppler shift.
2 Simulations
Figures 1 to 8 show the evolution of the quantities that determine the kinematics and dynamics of the shock and synchrotron emission. It is notable that they present a variety of behaviours despite the fact that in most cases parameters of the models are not too different from each others. Apriori some of these quantities can be extracted from observations (see Sec.3 of Paper I). They give valuable information about the physical state of the ejecta and its surrounding. This information can be used to constrain engine models.
The first application of these plots is the comparison and verification of the present model against previous works. For instance, comparing plots of as a function of time in Fig. 3 with the simulations of Huang et al. (1999) for relativistic and with simulations of Huang & Cheng (2003) for non-relativistic regime shows that although the general behaviour of this quantity in all simulations is the same, the slope of the evolution is not. According to the self-similar solution in the ultra-relativistic regime the slope of (Blandford & McKee, 1977; Sari et al., 1998; Huang et al., 1999). Here we find roughly the same value at the beginning of the emission, see specially models of afterglows in Fig. 3 where the relative Lorentz factor between two shells is highly relativistic. However, because in the models studied here the physical parameters such as the electric and magnetic fields are varying, the evolution of at the beginning of the shock can be much flatter. On the other hand in non-relativistic regime, very quickly. This happens specially in the prompt shock where the relative Lorentz factor is small and approaches to zero when shells coalesce, see models 1 to 6 in Fig. 3. Therefore the transfer of kinematic energy to radiation is not really a simple power-law as usually assumed. This has important implications for the formation of various features of the light curves (We discuss the light curves in details in the next section). There are very few systematic simulation of prompt emission from first principles to compare with this results. There are however analytical estimations and simulations for the afterglow (Huang et al., 1999; Huang & Cheng, 2003). Their slope of at very late times and somehow flatter at earlier earlier time is similar to models 9 and 10 which meant to simulate the late time afterglow. Nonetheless, the differences between these models as well as models 20 to 22 which are also candidate models for late afterglow show that depending on the evolution of the active region and physical parameters, various kinematical and dynamical outcome can be expected from late afterglow. This is consistent with the observation of very slow X-ray decay of e.g. GRB 050822 (Blustin et al., 2005; Godet et al., 2007) with final decay slope of and very fast decay of e.g. GRB 050730 (Holland et al., 2005; Pandey et al., 2006) and GRB 060607a (Ziaeepour et al., 2006b, 2008) with final
We notice that for models 17 to 19 which simulate the onset of prompt emission with an active region evolving according to quasi-steady state model, , , etc. have a pathological behaviour for one decade of time or so at the beginning of the simulation. We could not understand the reason because the same code has been used for the simulation of external shocks and they do not show any anormal behaviour. By changing the duration of the simulations and the same parameter sets we observed that the anormal interval varies, but the behaviour of normal section was stable and did not depend on the simulated duration. Therefore we conclude that the initial anormal behaviour is a purely numerical effect. Consequently, for these models we consider only the interval of time in which the simulation has good behaviour - from sec. for models 17 and 18, and sec. for model 19.
Another physically important quantity is . In (Sari et al., 1998) its time evolution slope in radiative external shocks is estimated to be . From plots in Fig. 5 we can conclude that in most cases the late time slope of is close to this value. However, we observe a more complex behaviour for this quantity. Notably, in prompt internal shocks it can increases at least during an interval of time. This is the case for models 1, 17, 19, and 24. For most of other models the initial decline of is much slower than the predication of self-similar shocks. This means that the initial radiation in both internal and external shocks can be much harder than what is expected from self-similar shock models. This behaviour can be related to time variation of shocks micro-physics. We come back to this point in the next section.
The column density of the active region is also an interesting quantity which apriori can be measured directly. Plots in Fig. 6 show that the intrinsic column density can evolve very differently from burst to burst, both in prompt internal and external shocks. Moreover its evolution depends on other physical parameters. In fact, from definition of this quantity it is clear that it directly depends on the evolution of density and the size of the active region see Figs. 7 and 8. A remarkable property is that during the sudden rise of the prompt emission such as in model 2, the column density simultaneously increases. The same in true during the build-up of active region in external shocks, models 13 and 15 to 19.
In the previous simulations (Nakar & Piran, 2004; Keshet et al., 2008) the effect of accumulation of matter has been added to the simulations as a factor called compression factor. Because in these simulations it is usually considered that synchrotron emission happens just in the shock front, the only column density seen by the radiation is considered to be the material in the line of sight and downstream of the shock front. Therefore we can not compare the column density of active zone and its evolution in this model with previous simulations. At present the extraction column density of active region from observations is very difficult and depends on how precisely we can determine and remove the contribution of foreground matter on the line of sight of GRBs. We have discussed these issues in Sec.3 of Paper I.
3 Light curves
The most prominent feature of the GRBs is the fast time variation in their emission reflected in the name of these transient sources. Any model of gamma ray bursts must reproduce their light curves and various observed features such as lags, Fast Rise Exponential Decay (FRED) behaviour of pulses, shallow slope regime in the early X-ray and sometimes optical afterglow emission, chromatic breaks, and the slow decay of optical and longer wavelength emissions.
To see if the model discussed in Paper I can reproduce the diversity of gamma-ray light curves and their afterglow in lower energy bands we calculate the time variation of the spectrum, equation (60-Paper I), assuming a power-law distribution for the Lorentz factor of electrons. The parameter sets are the same as what we used for the calculation of the shell dynamics and emission characteristics summarized in Table 2. We should remind that multiple peaks observed in many GRBs are most probably the result of multiple shell collisions. Our aim here is to reproduce the characteristics of a single peak interpreted as the collision between two shells.
We also remind that the parameters for the models with a dynamical active region have been chosen to simulate the prompt gamma-ray emission, except for models 7 to 10. For these models the parameter are chosen according to what we believe to correspond to the collision of the shells/ejecta with the low density slow material, with the wind around the central engine, or ISM. Such collisions are considered to be the origin of the late emissions that produces slowly varying emission at low energies, X-ray, optical, and radio. Although based on physical arguments the dynamical active region seems to be more suitable for the prompt emission, it can be also considered for the external shocks specially at late times. This is the aim of model 9 and 10. The chosen parameters for the simulation of quasi steady models are most relevant to the afterglow, except models 17 to 19 for which they are similar to what we have chosen for the simulations of internal shocks with a dynamical active region. Similar to the previous case we want to see if the quasi steady model can reproduce the observed properties of the prompt emission. The light curves obtained from these simulations are shown in Figs. 9 and 10.
As mentioned in the introduction, in these simulations the high latitude emission - the terms proportional to defined in equation (61-Paper I) in the power spectrum, equation (60-Paper I) is neglected. This is a good approximation for the prompt and early afterglow emissions. However, at late times when the Lorentz factor is decreased, their contribution becomes important. The main effect of these retarded emission is a flattening of the lightcurve. Due to larger Doppler shift of higher latitudes with respect to the emission at zero latitude, it would be more significant in lower energies than higher ones. This effect is independent of the evolution of the active region and applies to all the models explained here. Therefore what ever the late slope of the simulations, we should assume that in full model they would be flatter.
3.1 Light curve of simulated models with dynamical active region
First we concentrate on the simulation of the models with a dynamical active region. Fig. 9 shows a variety of behaviours both in the time evolution of the light curves and in the difference between the form of the light curve at different energy bands. We should remind that as the value of for a dynamical active region model can not be zero, we should assume that these simulations show only the evolution of the collision after the formation of an active region that is used as the initial condition for these simulations. The plots in Fig. 9 show that in some cases such as models 3, 4, and 5 the parameter set does not permit an increase of the emission and it decays. By contrast in models 1, 2, and 6 the initial emission evolves to a much harder and brighter emission.
Model 1 which is hard and square-shape looks like some of the observed hard and very bright bursts such as GRB 060105 (Ziaeepour et al., 2006a), GRB 060813a (Moretti et al., 2006), GRB 061007 (Schady et al., 2006b, 2007), and the super burst GRB 080319b (Racusin et al., 2008a, b). The hardening is also reflected in the increasing and in this model see Figs. 4 and 5. Comparing the parameters of this model with other models, it is clear that the main difference is the evolution of the electric and magnetic fields111When we talk about the evolution of the electric and magnetic fields, we actually mean the evolution of the fraction of kinetic energy of ejecta transferred to these fields. Fractions are scalar values in contrast to fields which are vectors and their variation is more complex.. They both increase with radius, but the electric field rising slope is much sharper than magnetic field. Therefore it can maintain for relatively long time the acceleration of electrons. The growing magnetic field helps to have significant synchrotron emission but if the electric field was low, either all the synchrotron energy was emitted quickly - like model 2 - or the gross of emission was more gradual and made a triangle/Gaussian shape peak. The early decay of the emission in lowest energy bands is most probably due to numerical insufficiency. However, it is possible that the early fall of the optical and ultra-violet light curves are real and due to the hardening of the emission.
In a real burst at some point the fields stop growing, the emission becomes softer and then breaks. Evidently, the evolution of fields according to a power-law with a constant index considered for each of the simulations here can not realistically reproduce the variation of parameters in a single simulation. Model 6, for instance, can be a prototype of long, few seconds, roughly constant emission following the rise of model 1. Model 2 shows a much faster rise similar to what happens in the short bursts. Fig. 3 shows that at maximum emission the shock becomes very quickly non-relativistic, i.e. . One can predict that this should stop the growing of fields and in fact leads to their fast decay and thereby fast decay of the mission. This situation is well presented by model 3 in which the light curve decay in less than 0.1 sec. In this model the lag between high energy bands is msec. It should be possible to reduce the lag and find values consistent with what is observed for short bursts. Most probably this needs an exponential decay of the fields which is not included in the present work. Models 4 and 5 are typical end of emission regime for long bursts in which a large lag, few hundreds of seconds, between energy bands appears. Another interesting aspect of this model is the very slow initial evolution of the optical and ultra-violet bands and relatively late rise of the optical bands. If the burst stays hard the peak of the emission in lower energy bands, X-ray and optical can have much larger lags. For instance, in models 4 and 5 soft X-ray and UV/optical bands are yet rising when the highest energy band in gamma-ray had decayed by more than one order of magnitude. Such large lag in low energy bands can be the origin of the peak observed in the X-ray - specially in short hard bursts see e.g. (Ziaeepour et al., 2007a)- and optical light curve of some long bursts (Oates et al., 2008), although an external shock origin can not be ruled out. On the other hand the steep decay slope of these models specially at softer bands can explain the very steep decline of the X-ray and optical emissions - usually called the tail emissions- seen in the majority of the Swift early afterglows (Zhang et al., 2006). In fact multi-band simultaneous observations of late gamma-ray peaks in bursts such as GRB 060124 (Holland et al., 2006; Romano et al., 2008), GRB 061121 (Page et al., 2006, 2007), and GRB 070724A (Ziaeepour et al., 2007a) have already proved that this regime of X-ray light curves is in close relation with the prompt emission (Zhang et al., 2006; Kumar et al., 2006; Liang et al., 2007) consistent with the prediction of models presented here. In all these simulations the time duration of the emission (width of the peak) in higher energy bands are shorter than lower energies, consistent with the observations (Fenimore et al., 1995)
Models 7 to 10 are simulated with parameters for afterglows. From Fig. 8 it is clear that in model 7 the width of the active region is decreasing although it has a negative . By contrast in model 8 which has a positive the increases. Nonetheless in both cases the column density decreases rapidly, see Fig. 6. These models have a relatively large Lorentz factor and hard emission in X-ray and their light curves are very flat or rising until hundreds of kilo seconds. Apriori this can explain the shallow regime of the X-ray light curves seen in many bursts (Zhang et al., 2006; Liang et al., 2007) if the shock stays only for a limited time of up to few thousands of seconds in this regime early after the onset of the external shock. The late decay of light curves of these models is too fast and inconsistent with observations. Therefore such a model can only be an example of early afterglows. We should also remember that the early emission in X-ray and optical bands is in part due to the tail emission of the prompt shock (Willingale et al., 2007) and therefore a combination of the two component must be considered. We come back to this point in the next section.
In model 9 and 10 all the parameters have values similar to the previous two models but their Lorentz factor is much smaller. In this case the shallow regime is declining, in contrast to the previous models and the late decay has a slope of to consistent with observations (Zhang et al., 2006). The form of the light curve also is grossly consistent with previous simulations (Sari et al., 1998) although the present models include more parameters. In fact if a regime similar to model 9 or 10 happens at late times sec after trigger, in logarithmic scale the shallow part will be a very short and insignificant interval. Thus the observer sees a break from a previous regime, presumably a shallow regime similar to models 7 and 8, to a declining regime with a slope of to that then breaks to a steeper slope of to at very late times. Such a behaviour has been detected in many of Swift bursts (O’Brien P.T. et al., 2006). Our tests show that slopes somehow depend on , larger steeper the decline slope. This is also consistent with previous simulations (Sari et al., 1998). Nonetheless, as we explained in Paper I, flatter slopes can be obtained at low energies if there is an exponential cutoff in the electron distribution at high energies. This option is not included in present simulations and we leave its exploration to a future work. As mentioned before, the inclusion of high latitude emissions also make the decline flatter.
3.2 Light curve of simulated models with quasi-steady active region
Models 11 to 18 in Fig. 10 are simulated with a quasi steady active region, the first six models as external shocks and the last three as internal shocks. The first noticeable feature is the similarity between the global trends of their light curves, in contrast to the variety of behaviours we have seen in models with dynamical active region. This is consistent with the Swift (Gehrels et al., 2004) observations of X-ray and UV/optical late emissions222We discussed that the observed emission in lower energies after the prompt peak most probably consists of a combination of emission from the prompt collision and the afterglow defined as the emission from the collision of ejecta/jet with the surrounding material or ISM (Willingale et al., 2007). Therefore we refer to this emission as late emission rather than the afterglow which usually is considered to be the emission from external shocks (Willingale et al., 2007). Both X-ray and optical light curves look like the light curves of simulated external shocks in Sari et al. (1998). Their similarly to previous simulations is more visible than models 7 and 8 with dynamical active region.
In general these models show a large lag of few thousands of seconds between the time of peak emission at hard and soft X-ray bands, versus UV and optical bands. This is consistent with the previous calculations (Sari et al., 1998). But the general aspects of the light curves are not similar to what is observed in real bursts. Therefore if the early emission was exclusively from external shocks these models were rules out. On the other hand, it has been shown (Willingale et al., 2007) that the X-ray light curves are composed of two overlapping components, one related to the prompt emission, and the other can be so called the afterglow. Moreover, the general form of the light curves in Fig. 10 is similar and consistent with the fit performed in Willingale et al. (2007) for the afterglow component. In this case the shallow regime observed in many bursts presents the interval in which the prompt component is decaying and the afterglow is gradually taking over (Ioka et al., 2006; O’Brien P. & Willingale, 2008). This can be also the reason for the hardening of the emission, because the decaying prompt emission can be at this time softer than growing emission from the external shock. As explained in the previous section, another possibility for explaining the shallow regime is the change in the evolution trend of the active region from quasi-steady state to dynamical after the initial rise of emission in the previous regime. The slower decay rate of the low energy light curves in internal shocks and the large lag of the break in these bands with respect to X-ray break in the external shock emissions is consistent with the lack or very late break seen in the optical light curves of the bursts detected by Swift /UVOT (Oates et al., 2008). A shallower electron distribution at low energies and an exponential break at high energy can also be responsible for shallow optical lightcurves (Misra et al., 2007). As for the decay slope after the break in models 11 to 13 it is about and in model 14 about . Similar to dynamical models for late external shock emission a shallower electron distribution leads to a shallower break slope. In model 15 the break slope is very steep and inconsistent with observations. Therefore this model can simulate the rise of the afterglow and not its decay. Model 16 also has a steep slope but its Lorentz factor is not very large and high latitude emissions should significantly flatten the decay slope.
In these simulations we have neglected the energy dependence of , the width of the active region. The initial ejecta responsible for the internal shock is expected to be compact and dense. Thus, its emission in all bands come roughly from the same region and the assumption of an energy independent is justified. Following the prompt collision(s) and scattering of the particles, one expects the formation of a low energy tail which nonetheless can have enough strong electric and magnetic fields to accelerate electrons and produce low energy synchrotron emission. To consider such a possibility we have also simulated the same models with the same parameters listed in Table 2 but with . The selected index of for energy dependence is arbitrary, and we leave a more precise estimation of this parameter to a future work in which we try to reconstruct real bursts according to the models presented here. The results of these simulations are presented in Fig. 11. The general properties of the light curves are preserved but lower energy bands have relatively higher fluxes and later breaks consistent with the theoretical explanation in Paper I.
Models 17 to 19 are simulated with parameters relevant to internal shocks. They are generally hard and suitable for the rising regime of the prompt emission. In the dynamical active region model the initial . Therefore somehow an initial active region must form before it evolves according to dynamical model. The quasi steady model is a suitable approximation for this regime. The hardness of the simulations is consistent with the rapid hardening of the emission at the beginning of the collision. At high energies model 18 has a FRED shape light curve but the lag between gamma-ray energy bands is sec. much longer than what is observed in long bursts, although very long faint bursts with supernova counterpart can accommodate such long lags.
Finally Fig. 12 show the light curves for models 20 to 24 in which the active region width evolves from an initial non-zero value at according to a power-law, see equation (29-Paper I). The expression for evolution in this model apparently looks like quasi-steady state model, but in reality it is more similar to the dynamical model because in short intervals of time and on which the dynamical model depends, have a close to power-law evolution, see Figs. 2 and 3. Therefore, the evolution of is also a close to a power-law in a short time intervals. This fact is reflected in the form of the light curves of models 20 to 22 that present external shocks. They are very similar to models 7 to 10 generated by the dynamical model and their lightcurves have very shallow initial slopes and steep break. Their slopes after the break seem to be too steep. However, the contribution of the high latitude emissions as explained at the beginning of the Sec. 3 should flatten their decay slopes. Moreover, our tests and also the difference between the after-break slopes of models 20 and 21 show that a flatter electron distribution reduces the steepness of the break. In particular, a power-law with exponential break distribution can make flatter late time breaks at lower energies and faster break at high energies. This feature has been also considered to explain the behaviour of late X-ray emission of some bursts (Misra et al., 2007; Dempsey & Duffy, 2007). Models 23 and 24 can be good candidate for the decay of emission during the prompt internal shock.
In summary, the general behaviour of light curves in the simulations of active region models studied here are consistent with observations if we admit switching between models during the evolution of both internal and external shocks. Many of unexplained features of both prompt and afterglows are explained in these simulations such as: the energy dependence of the prompt emission peak width, the steep decay of the early afterglow and its connection to prompt emission, and the shallow regime which can be in part due to the way the active region evolves - in another word to the microphysics of the shock - and in part due to the combination of tail emission from prompt shock and the onset of external shock. Anther notable conclusion from the simulations of external shocks is that in all cases there is a chromatic break in the light curves due to the accumulation of in-falling matter into the shock. Therefore, changes of physical parameters and thereby the way the active region evolves, can completely smear an achromatic break due to the kinematical jet break in a collimated ejecta. We observed a jet break in all the simulations although the model considered here has a spherical symmetry and therefore no kinematical jet break. Multiple jet breaks observed in a significant fraction of late emissions of the gamma-ray bursts also can be explained by switching between simple evolution models for the active region presented here as well as the change in the physical quantities such as the energy distribution of electrons. Evidently, it is up to magnetohydrodynamical simulations of relativistic and non-relativistic shocks and Fermi processes to verify the validity and conditions for the presence of the simple models presented here, the possibility of switching between models, different regimes, etc.
4 Spectral behaviour
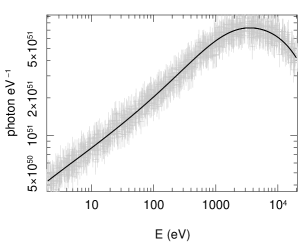
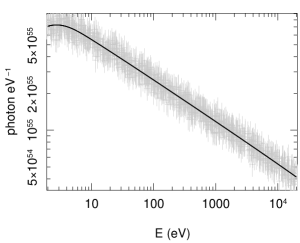
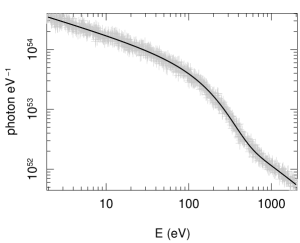
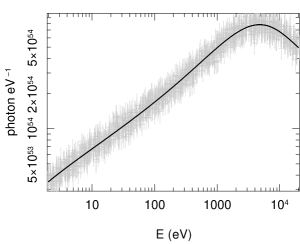
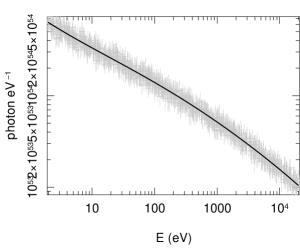
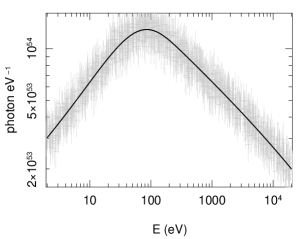
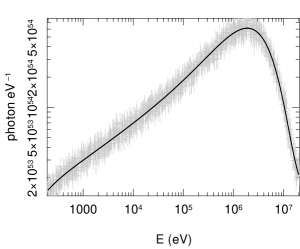
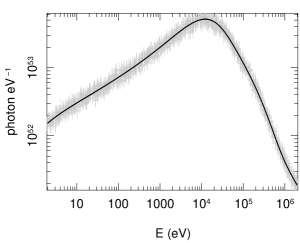
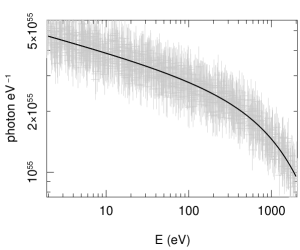
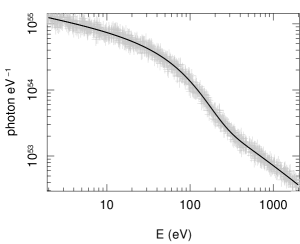
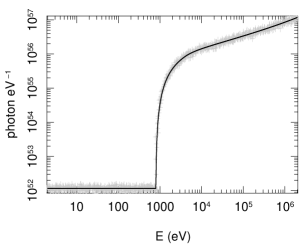
In the GRB data analysis usually all the photons detected during a given interval of time, e.g. the duration of the observation by the gamma-ray telescope - - is used for the determination of an averaged spectrum. Therefore for comparing the theoretical spectrum, equation (60-Paper I), with data we must integrate it with respect to for a given radius/time interval and divide it by the duration length. However, here we do not consider a lower limit for the detectable flux in the simulated models, and therefore is the same as the simulation time. For this reason we simply determine the total spectrum for the duration of the simulations without dividing it by time. The results are shown in Fig. 13 for dynamical and in Fig. 14 for quasi steady active region models explained in Table 2.
4.1 Spectrum of simulated models with dynamical active region
From variety of behaviours we have seen in the light curve of dynamical models we must expect the same level of variation in the spectrum, and it is exactly what we find in Fig. 13. We should remind that the spectrum of the observed bursts are usually time averaged on the total duration of the burst, or belongs to the total duration of a peak. Thus, their behaviour can be very different from the spectrum in a shorter interval of time. Each of The simulations presented in this work correspond to a fraction of a burst, and therefore we should not expect that it has a spectrum similar to time averaged observed spectrum of complete bursts.
The spectra of models 1, 2, and 6 are much harder than observed time averaged spectra. However, considering their light curves, they correspond to a short time at the beginning of the burst, and therefor their impact on the integrated spectrum would be small. In fact some bright hard bursts such as GRB 060105 (Ziaeepour et al., 2006a), GRB 080319B (Racusin et al., 2008a), and GRB 080706 (Mangano et al., 2008) (long bursts) and GRB 051221 (Parsons et al., 2005; Fan & Xu, 2006), GRB 060313 (Pagani et al., 2006), and GRB 080123 (Ukwatta et al., 2008) (short bursts) seem to have a very flat or even rising spectrum at the onset of the burst.
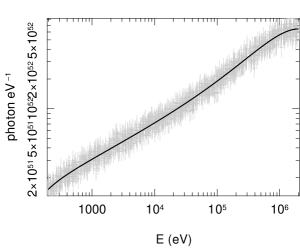
At highest energies, few times eV, models 3, 4, and 5 which present the end of a peak, see Fig. 9 have a power-law with an exponential cutoff spectrum at eV and at lower energies the slope is positive. This is consistent with magnetohydrodynamics simulations (Hededal & Nordlund, 2005; Nishikawa et al., 2008) and shock emission models (Medvedev, 2006). At eV where their spectra are roughly flat, with an error at the level or higher than what is shown in the plots ( of the simulated values), they can be fit with a power-law consistent with observation of long Swift GRBs (Sakamoto et al., 2007). Although these models present only the end of a peak, the general behaviour of the broad band spectra is consistent the broad band spectrum of GRB 080916C which has been observed simultaneously by a large number of space and ground based instruments such as Fermi (Goldstein & van der Horst, 2008), Swift (Kennea, 2008; Stratta et al., 2008), Konus-Wind (Golenetskii et al., 2008), etc. This means that the effect of hard initial rise and soft tail emission after the decay of emission is small. Moreover, from similarity of these spectra with the spectrum of the only burst for which we have broad spectrum up to GeV bands we can conclude that these models present typical prompt emissions.
A common feature between all these spectra is their low luminosity at optical energies. This is consistent with the lack of very bright peak in optical frequencies when multiple-band observations of late gamma-ray peaks were possible. Examples are GRB 060526 (Campana et al., 2006; Dai et al., 2007) and GRB 061121 (Page et al., 2006, 2007). In GRB 060526 the X-ray emission increased about times during a relatively soft but long peak observed also in gamma-ray. The optical emission during this peak increased only by a factor of in V band from the continuum. In GRB 061121 also the X-ray increased about times but V band peak was only times larger than the continuum and in B band only times. Most authors consider the null assumption of a single power-law spectrum at low energies and try to explain the low luminosity of bursts at low energies by dust absorption. In the case of GRB 061121 apriori a dust to gas model similar to the value for Milky Way can explain observations (Page et al., 2006). However, we ignore the exact amount of dust in the host galaxy and we can not rule out a break at low energies consistent with magnetohydrodynamics simulations (Hededal & Nordlund, 2005; Nishikawa et al., 2008).
Models 7 to 10 simulate external shocks and have a much steeper spectrum at high energies. The spectrum of model 7 which can correspond to the rise of the external shock is hard with a break at few keV. The spectrum of model 8 and the soft X-ray spectra of models 9 and 10 can be fit by a single power-law with negative index. At very soft X and UV bands the spectrum index of models 9 and 10 becomes steeper but at optical bands it becomes again flatter. This should correspond to the transition region from to where is the average minimum synchrotron characteristic energy in the observer frame. The spectrum indexes in X-ray band varies from in model 8 to for model 9 and roughly flat for eV for model 7. The large scatter of the X-ray spectrum index in these simulations is consistent with the observations of the Swift -XRT (Burrows et al., 2005).
4.2 Spectrum of simulated models with quasi-steady active region
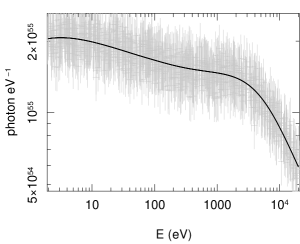
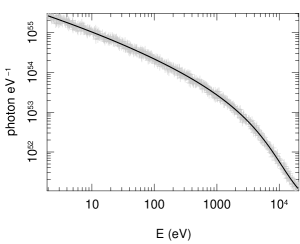
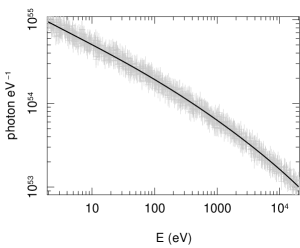
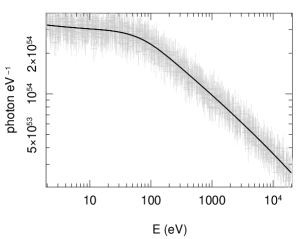
Fig. 14 shows that the spectrum of external shock simulations according to this model is very similar to what have been obtained for the dynamical models. Except model 11 which is hard and corresponds to the rising of the emission, others can be fit by a simple power-law or power-law with exponential cutoff at high and/or low energies. Like dynamical models, their spectrum index in X-ray band are mostly shallow with and get even shallower in optical bands. But when the averaged minimum characteristic energy is in the plotted bands, as in model 12, there is a transient steep region similar to what we saw in dynamical models. Models 11 and 15 are hard with a positive index at low energies. As these models can only be relevant for the rising of the external shock emission which is usually overlapped with the tail emission of the prompt, it is very difficult to compare this results directly with observations.
Fig. 15 shows the spectrum of the same models but with an energy dependent as explained in Sec.3.2. As expected, they are softer. Models 11 and 15 have negative slopes at low energies and a cutoff at high energies. Other models have the same form of the spectrum as in Fig. 14 but softer.
Models 17 to 19 in Fig. 14 which present internal shocks with quasi-steady state active region are hard and has spectra similar to prompt models with dynamical active region.
For various fundamental and observational reasons it is very difficult to compare these models with observations and with previous simulations or theoretical estimations. As we mentioned at the beginning of this section, these simulations does not correspond to a complete burst but just to part of a burst that can be simulated with a single and simple evolution model. Moreover, the emission after the prompt gamma-ray peak is most probably a combination of emission from the prompt internal shock and the afterglow / external shocks (Willingale et al., 2007). It is not always easy to distinguish these components and in any case the separation would be model dependent. Nonetheless, if we assume that the missing sectors do not change the spectrum significantly, we can compare these simulations with observations and previous theoretical estimations. For instance models 7, 11, and 15 which present the early emission of the afterglow with what is called fast cooling regime in (Sari et al., 1998), the general form of the spectrum is similar. Notably, their slope at high energies is when for all models except model 16. This value is consistent with the value of predicted in Sari et al. (1998). In model 16 the index and the value of slope at high energies is consistent with estimation of Sari et al. (1998).
As for comparison with observations, it strongly depends on the time interval of observations. For instant, the available spectrum fit for the Swift bursts belong mainly to the first couple of thousands of seconds because at later times the emission is faint and it is very difficult to determine the spectrum. However, as we mentioned before the early X-ray and optical emission are most probably due to the tail emission from the remnant of the prompt shock and therefore they can not be compared with what is expected from external shock. This mixing can be the reason for the large scatter in the spectral index of the X-ray spectrum (Willingale et al., 2007). For instance GRB 070724A (Ziaeepour et al., 2007a), GRB 070721B (Ziaeepour et al., 2007b), GRB 061004 (Ziaeepour et al., 2006d) have an average spectrum index of when others such as GRB 050128 (Cummings et al., 2005), GRB 070208 (Sato et al., 2007), and GRB 060804 (Ziaeepour et al., 2006c) have an index of .
On the other hand, one of the principle differences between the prediction of these models and what is usually considered in the literature for the broad X-ray and optical spectrum is a single power law with or without cutoff at high or low energies. The simulated models here show the possibility of variant slopes and presence of cutoffs even in the energy range accessible to one instrument. This can be the reason for the absence of an optical afterglow specially when the burst is hard. Nonetheless, the under-luminous optical emission can be also explained by the presence of dust in the host galaxy or even in the circumburst environment (Schady et al., 2007). One argument against the presence of a large amount of dust in the host galaxy of GRBs is the fact that most of them have relatively low metalicity (Wolf & Podsiadlowski, 2007). On the other hand, if the absorbers are limited to the star-forming clouds and their surroundings, then the local quantity of dust can be significant although the total fraction of dust in the host galaxy can be low. Present observations and reduction techniques are not yet sufficient to clarify this issue. In conclusion, these simulations show that the spectrum of emission itself can be in part responsible for the lack of observation of optical and lower energy afterglows in the observed GRBs.
5 Summary
We discussed the results of a few numerical simulations of GRBs based on the model explained in Paper I. We showed that the behaviour of these models is in general consistent with some regimes in the observed GRBs. It is difficult to verify the reality of some of the features seen in these simulations. For instance, a long lag between the peak of the X-ray and optical afterglows is predicted by some of these simulations. We need long multi-wavelength observations to be able to see such a feature in real bursts, and usually such data do not exist. Nonetheless, there are exceptions. Long follow-up of some bursts such as GRB 081029 (Immler et al., 2008) and GRB 081007 (Soderberg et al., 2008) show a wide late peak in optical wavelengths undetected in the X-ray. It can be from the afterglow, although other possibility such as the appearance of a supernova can not be ruled out. These observations increase the confidence on this model and analytical results presented here. Moreover, they encourage long term monitoring of GRBs to see if similar behaviour can be found in other bursts.
To complete these simulations we need to put together the simulation of various regimes and make the light curves and spectra corresponding to the whole burst. This should help to better understand the contribution of internal and external shocks in the light curves and spectrum as well as features such as the shallow regime, breaks, etc. We leave these investigations for future works.
Acknowledgments
I would like to thank Keith Mason for encouraging me to work on GRB science. The ideas presented in this work couldn’t be developed without long discussions with the past and present members of the Swift science team at MSSL: A. Blustin, A. Breeveld, M. De Pasquale, P. Kuin, S. Oates, S. Rosen, M. Page, P. Schady, M. Still, and S. Zane, as well as the other members of the Swift team in particular: S. Barthelmy, Ph. Evens, E.E. Fenimore, N. Gehrels, P. Mésźaros, J. Osborne, and K. Page. I thank all of them.
References
- Barthelmy et al. (2005) Barthelmy, S.D., Cummings J.R., Fenimore E., Gehrels N., Hullinger D., Krimm H.; Markwardt C., et al., Space Sci. Rev. 120, (2005) 143, astro-ph/0507410.
- Blandford & McKee (1977) Blandford, R.D. & McKee, C.F., Phys. of Fluids 19, (1977) 1130.
- Blustin et al. (2005) Blustin, A., Barthelmy, S., Burrows D., Chester, M., Cummings, et al., GCN Circ. 3849 (2005).
- Burrows et al. (2005) Burrows, D.N., Hill J.E., Nousek J.A., Kennea J.A., Wells A., Osborne J.P., Abbey A.F., Beardmore, A., et al., Space Sci. Rev. 120, (2005) 165, astro-ph/0508071.
- Campana et al. (2006) Campana, S., Barthelmy, S.D., Boyd, P.T., Brown, P., Burrows, D., et al., GCN Circ. 5162 (2006).
- Cummings et al. (2005) Cummings, J., Sato, G., Antonelli, L., Barthelmy, S., Barbier, L., et al., GCN Circ. 2992 (2005).
- Dai et al. (2007) Dai, X., Halpern, J.P., Morgan, N.D., Armstrong, E., Mirabal, N., et al., ApJ. 658, (2007) 509, astro-ph/0609269.
- Dai & Lu (2002) Dai, Z.G. & Lu, T., ApJ. 565, (2002) L87, astro-ph/0111454.
- Dempsey & Duffy (2007) Dempsey, P. & Duffy, P., MNRAS 378, (2007) 625, arXiv:0704.0168.
- Fan & Xu (2006) Fan Y. & Xu, D., MNRAS 372, (2006) L19, astro-ph/0605445.
- Fenimore et al. (1995) Fenimore, E.E., in’t Zand, J.J.M., Norris, J.P., Bonnel, J.T., & Nemiroff, R.J., ApJ. 101, (1995) 448L, astro-ph/9504075.
- Frederiksen (2008) Frederiksen, J.T., ApJ.Lett. 680, (2008) L5, arXiv:0803.3618.
- Gehrels et al. (2004) Gehrels, N., Chincarini, G., Giommi, P., Mason, K.O., Nousek, J.A., Wells, A.A., White, N.E., Barthelmy, S.D., et al., ApJ. 611, (2004) 1005, astro-ph/0405233.
- Godet et al. (2007) O. Godet, et al., A.& A. 471, (2007) 385, astro-ph/0702262.
- Goldstein & van der Horst (2008) Goldstein, A. & van der Horst, A., GCN Circ. 8245 (2008).
- Golenetskii et al. (2008) Golenetskii, S., Aptekar, R., Mazets, E., Pal’shin, V., Frederiks, D., et al., GCN Circ. 8258.
- Greiner et al. (2008) Greiner, J., Krühler, T., McBreen, S., Ajello, M., Giannios, D., et al., arXiv:0811.4291.
- Hededal & Nordlund (2005) Hededal, Ch.B. & Nordlund, A., astro-ph/0511662.
- Holland et al. (2005) Holland, S.T., Barthelmy, S.D., Burrows, D.N., Gronwall, C., Kennea, J., et al., GCN Circ. 3704 (2005).
- Holland et al. (2006) Holland, S.T., Barthelmy, S.D., Burrows, D.N., Gehrels, N., S. Hunsberger, S., et al., GCN Circ. 4570, (2006).
- Huang et al. (1999) Huang, Y.F., Dai, Z.G., & Lu, T., MNRAS 309, (1999) 513, astro-ph/9906370.
- Huang & Cheng (2003) Huang, Y.F. & Cheng K.S., MNRAS 341, (2003) 263, astro-ph/0301387.
- Immler et al. (2008) Immler, S., Burrows, D., Chester, M.M., Gehrels, N., Holland, S.T., et al., GCN Circ. 7226 (2008).
- Ioka et al. (2006) Ioka, K., Toma, K., Yamazaki, R., & Nakamura, T., et al., A.& A. 458, (2006) 7, astro-ph/0511749.
- Kennea (2008) Kennea, J.A., GCN Circ. 8253 (2008)
- Keshet et al. (2008) Keshet, U., Katz, B., Spitkovsky, A., & Waxman, E., (2008), arXiv:0802.3217.
- Kumar et al. (2006) Kumar, P., McMahon, E., Barthelmy, S.D., Burrows, D., Gehrels, N., Goad, M., Nousek, J., & Tagliaferri, G., MNRASL 367, (2006) L52, astro-ph/0602060.
- Lazzati et al. (2006) Lazzati, D., Morsony, B.J., & Begelman, M.C., Nuovo Cimento 121, (2006) 1177, astro-ph/0612320.
- Lazzati et al. (2007) Lazzati, D., Morsony, B.J., & Begelman, M.C., Phil.Trans.Roy.Soc.Lond. A 365, (2007) 1141, astro-ph/0611192.
- Liang et al. (2006) Liang, E., Noguchi, K., & Sugiyama, S., AIP Conf. Proceedings for Swift GRB Workshop (AIP 2006), astro-ph/0603593.
- Liang et al. (2007) Liang, E.W., Zhang B.B. & Zhang, B., ApJ. 670, (2007) 565, arXiv:0705.1373.
- Lu et al. (2006) Lu, R.J., Qin, Y.P., Zhang, Z.B., & Yi, T.F., MNRAS 367, (2006) 275, astro-ph/0509287.
- Mangano et al. (2008) Mangano, V., Cummings, J., Cusumano, G., Gehrels, N., La Parola, V., et al., GCN Circ. 7847, GCN Rep. 147.1 (2008).
- Medvedev (2006) Medvedev, M.V., ApJ. 637, (2006) 869, astro-ph/0510472.
- Mimica et al. (2008) Mimica, P., Giannios, D., & Aloy, M.A., proceedings of the conference ”Supernovae: lights in the darkness”, October 3-5, 2007, Mao (Menorca), arXiv:0801.1325.
- Misra et al. (2007) Misra, K., Bhattacharya D., Sahu D.K., Sagar R., Anupama G.C., Castro-Tirado A.J., Guziy S.S., Bhatt B.C., A.& A. 464, (2007) 903, astro-ph/0701413.
- Moretti et al. (2006) Moretti, A., Barthelmy, S.D., Cummings, J., Guidorzi, C., Markwardt, C.B., et al., GCN Circ. 5442 (2006).
- Nagataki et al. (2007) Nagataki, S.,Takahashi, R., Mizuta, A., & Takiwaki, T., ApJ. 659, (2007) 512, astro-ph/0608233.
- Nakar & Piran (2004) Nakar, E. & Piran, T., MNRAS 353, (2004a) 647, astro-ph/0403461.
- Nishikawa et al. (2008) Nishikawa, K.I., Hardee, P., Mizuno, Y., Medvedev, M., Zhang, B., Hartmann, D.H., & Fishman, G.J., eventh European Workshop on Collisionless Shocks, Paris, 7- 9 November 2007, arXiv:0802.2558.
- Oates et al. (2008) Oates, S.R., Page, M.J., Schady, P., de Pasquale, M., Koch, T.S., et al., to be published in MNRAS(2009), arXiv:0901.3597.
- O’Brien P.T. et al. (2006) O’Brien, P.T., Willingale, R., Osborne, J., Goad, M.R., Page, K.L., et al., ApJ. 647, (2006) 1213, astro-ph/0601125.
- O’Brien P. & Willingale (2008) O’Brien P. & Willingale, R., arXiv:0808.3492.
- Pagani et al. (2006) Pagani, C., Barthelmy, S.D., Cummings, J., Gehrels, N., Grupe, D., et al., GCN Circ. 4867 (2006).
- Page et al. (2006) Page, K.L., Barthelmy, S.D., Beardmore, A.P., Brown, P., Burrows, D., et al., GCN Circ. 5823, GCN Rep. 15.2 (2006).
- Page et al. (2007) Page, K.L., Willingale, R., Osborne, J.P., Zhang, B., Marshall, F.E., et al., ApJ. 663, (2007) 1125, arXiv:0704.1609.
- Panaitescu et al. (1997) Panaitescu, A., Wen, L., Laguna, P., & Mészáros, P., ApJ. 482, (1997) 942, astro-ph/9610064.
- Panaitescu & Mészáros (1998) Panaitescu, A.& Mészáros, P., ApJ. 492, (1998) 683, astro-ph/9703187.
- Pandey et al. (2006) Pandey, S.B., Castro-Tirado, A.J., McBreen, S., Perez-Ramirez, M.D., Bremer, M., et al., A.& A. 460, (2006) 415.
- Parsons et al. (2005) Parsons, A.P., Barthelmy, S.D., Burrows, D., Capalbi, M., Cummings, J., et al., GCN Circ. 4363 (2005).
- Racusin et al. (2008a) Racusin, J.L., Gehrels, N., Holland, S.T., Kennea, J., Markwardt, C.B., et al., GCN Circ. 7427, GCN Rep. 134.1 (2008a).
- Racusin et al. (2008b) Racusin, J.L., Karpov, S.V., Sokolowski, M., Granot, J., Wu, X.F., et al., Nature 455, (2008b) 183, arXiv:0805.1557.
- Romano et al. (2008) Romano, P., Campana, S., Chincarini, G., Cummings, J., Cusumano, G., et al., Nuovo Cimento 121, (2008) 1067, astro-ph/0612494.
- Roming et al. (2006) Roming, P.W.A., Vanden Berk, D., Palshin, V., Pagani, C., Norris, J., et al., ApJ. 651, (2006) 985, astro-ph/0605005.
- Sakamoto et al. (2007) Sakamoto, T., Barthelmy, S.D., Barbier, L., Cummings, J., Fenimore, E., et al., arXiv:0707.4626.
- Sari et al. (1998) Sari, R., Piran, T., & Narayan, R., ApJ. 497, (1998) 17, astro-ph/9712005.
- Sato et al. (2007) Sato, G., Barthelmy, S.D., Campana, S., Conciatore, M.L., Evans, P.A., et al., GCN Circ. 6074, GCN Rep. 31.1.
- Schady et al. (2006b) Schady, P., Cummings, J., Guidorzi, C., Pagani, C., Palmer, D., et al., GCN Circ. 5707, GCN Rep. 7.1 (2006b).
- Schady et al. (2007) Schady, P., De Pasquale, M., Cummings, J., Page, M.J., Pandey, S.B., et al., MNRAS 380, (2007) 1041, astro-ph/0611089.
- Schady et al. (2007) Schady, P., Mason, K.O., Page, M.J., De Pasquale, M., Morris, D.C., et al., MNRAS 377, (2007) 273, astro-ph/0702122.
- Spitkovsky (2008) Spitkovsky, A., ApJ. 682, (2008) L5, arXiv:0802.3216.
- Soderberg et al. (2008) Soderberg, A., Berger, E. & Fox, D. GCN Circ. 8662 (2008).
- Stratta et al. (2008) Stratta, G., Perri, M., Preger, B., Barthelmy, S.D., Burrows, D.N., et al., GCN Rep. 166.1 (2008).
- Tchekhovskoy et al. (2008) Tchekhovskoy, A., McKinney, J.C., & Narayan, R., MNRAS 388, (2008) 551, arXiv:0803.3807.
- Ukwatta et al. (2008) Ukwatta, T.N., Baumgartner, W.H., Chester, M.M., Gehrels, N., Holland, S.T., et al., GCN Circ. 7203, GCN Rep. 111.1 (2008).
- Umeda et al. (2005) Umeda, H., Tominaga, N., Maeda, K. & Nomoto, K., ApJ. 633, (2005) L17, astro-ph/0509750.
- Willingale et al. (2007) Willingale, R., O’Brien, P., Osborne, J.P., Godet, O., Page, K.L., et al., ApJ. 662, (2007) 1093, astro-ph/0612031.
- Wolf & Podsiadlowski (2007) Wolf, C. & Podsiadlowski, P., MNRAS 375, (2007) 1049, astro-ph/0606725.
- Zhang et al. (2006) Zhang, B., Fan, Y.Z., Dyks, J., Kobayashi, Sh., Mésźaros, P., et al., ApJ. 642, (2006) 354, astro-ph/0508321
- Ziaeepour et al. (2006a) Ziaeepour, H., Blustin, A., Burrows, D., Cummings, J.,et al., GCN Circ. 4429 (2006a).
- Ziaeepour et al. (2006b) Ziaeepour, H., Barthelmy, S.D., Gehrels, N., Goad, M.R., Kennea, J., et al., GCN Circ. 5233, (2006b).
- Ziaeepour et al. (2006c) Ziaeepour, H., Barthelmy, S.D., Burrows, D.N., Cummings, J.R., Gehrels, N., et al., GCN Circ. 5394 (2006c)
- Ziaeepour et al. (2006d) Ziaeepour, H., Burrows, D.N., Cummings, J.R., Oates, S.R., Pagani, C., et al., GCN Circ. 5691 (2006d).
- Ziaeepour et al. (2007a) Ziaeepour, H., Barthelmy, S.D., Beardmore, A.P., Burrows, D., De Pasquale, M., et al., GCN Circ. 6654, GCN Rep. 74.2 (2007a).
- Ziaeepour et al. (2007b) Ziaeepour, H., Barthelmy, S.D., Beardmore, A.P., Burrows, D., Evans, P.A., et al., GCN Circ. 6640, GCN Rep. 73.2 (2007b).
- Ziaeepour et al. (2008) Ziaeepour, H., Holland, S.T., Boyd, P.T., Page, K., Oates, S., et al., MNRAS 385, (2008) 453, arXiv:0712.3269.
| Symbol | Definition |
|---|---|
| All quantities without, except constants, are defined with respect to the rest frame of far but at the same redshift observer. | |
| ′ | All quantities with a prime are defined with respect to the rest frame of slower shell. |
| Relative of two colliding shell in the rest frame of slower shell. | |
| Characteristic synchrotron frequency for slowest electrons, Eq. (78-Paper I) | |
| Relative Lorentz factor of two shells in the rest frame of slower shell calculated with first order radiative correction. | |
| intrinsic column density of the active region. | |
| the index of electrons Lorentz factor distribution. |
| No. | (cm-3) | cm-3 | max | |||||||||||||
|---|---|---|---|---|---|---|---|---|---|---|---|---|---|---|---|---|
| D. A. R. | 1 | 0.5 | 2.5 | 0 | 2 | -3 | 0 | -0.5 | 0.02 | -5 | 2 | 200 | ||||
| 2 | 0.1 | 2.5 | 0 | 2 | -3 | 0 | -1 | 0.3 | -3 | 1.005 | 200 | |||||
| 3 | 0.2 | 2.2 | 0 | 2 | 1 | 0 | 0.1 | 0.2 | 0 | 1.005 | 200 | |||||
| 4 | 0.2 | 3 | 0 | 1.5 | 0 | 0 | -0.3 | 0.2 | -0.5 | 1.1 | 200 | |||||
| 5 | 0.5 | 2.7 | 0 | 2 | -2 | 0 | 0.1 | 0.2 | 1.5 | 200 | ||||||
| 6 | 0.6 | 2.1 | 0 | 3 | -1 | 0 | -0.8 | 0.1 | -1 | 5 | 3 | 200 | ||||
| 7 | 2.5 | 1 | 50 | -3 | 0 | 0.5 | 0.1 | 0 | 1 | 5 | 1 | |||||
| 8 | 2.5 | 0 | 50 | 1 | 0 | -0.01 | 0.2 | -0.01 | 50 | 5 | 1 | |||||
| 9 | 0.01 | 2.5 | 1 | 10 | 3 | 0 | 0.5 | 0.1 | 0 | 1 | 5 | 1 | ||||
| 10 | 0.01 | 2.5 | 0 | 10 | 1 | 0 | -0.01 | 0.2 | -0.01 | 10 | 5 | 1 | ||||
| Q. S. A. R. | 11 | 0.05 | 2.5 | 0 | 200 | 0 | 5 | -0.5 | 0.1 | -2 | 10 | 5 | 1 | |||
| 12 | 0.01 | 2.5 | 2 | 20 | 0 | 0.1 | 0.01 | 0.5 | 0.01 | 10 | 2 | 1 | ||||
| 13 | 0.01 | 2.5 | 2 | 20 | 0 | 1 | 0.01 | 0.5 | 0.01 | 1 | 2 | 1 | ||||
| 14 | 0.05 | 2.5 | 0 | 200 | 0 | 5 | -0.5 | 0.1 | -1 | 10 | 1 | |||||
| 15 | 0.01 | 2.5 | 2 | 200 | 0 | 5 | -1 | 0.1 | -0.1 | 1 | 5 | 1 | ||||
| 16 | 5 | 3 | 0 | 10 | 0 | 0.5 | 0.01 | 0.2 | 0.01 | 50 | 2 | 1 | ||||
| 17 | 0.5 | 2.5 | 0 | 2 | 0 | 4 | 0.01 | 0.2 | -2 | 1.5 | 200 | |||||
| 18 | 0.2 | 2.5 | 0 | 2 | 0 | 4 | 0.2 | 0.2 | 2 | 1.5 | 200 | |||||
| 19 | 0.5 | 2.5 | 0 | 2 | 0 | 4 | -0.5 | 0.2 | -2 | 1.5 | 200 | |||||
| Eq. (29) in Paper I | 20 | 0.1 | 2.5 | 0 | 20 | 0 | 0.5 | 0.01 | 0.2 | 0.01 | 10 | 5 | 1 | |||
| 21 | 0.1 | 2.2 | 0 | 10 | 0 | 0.1 | 0.01 | 0.2 | 0.01 | 10 | 2 | 1 | ||||
| 22 | 0.1 | 2.5 | 0 | 10 | 0 | 1 | 0.05 | 0.2 | 0.05 | 1 | 5 | 1 | ||||
| 23 | 0.5 | 2.5 | 0 | 2 | 0 | 5 | 4 | 0.2 | 4 | 1.5 | 200 | |||||
| 24 | 0.5 | 3 | 0 | 2 | 0 | 5 | -0.5 | 0.1 | -2 | 1.5 | 200 |
Dynamical Active Region (D.A.R.), Quasi-Steady Active Region
(Q.S.A.R.).
444*The aim for using large negative values for in the first
and second parameter sets were simulating an exponential rise of the electric
field.
1)
|
2)
|
3)
|
4)
|
5)
|
6)
|
7)
|
8)
|
9)
|
10)
|
11)
|
12)
|
13)
|
14)
|
15)
|
16)
|
17)
|
18)
|
19)
|
20)
|
21)
|
22)
|
23)
|
24)
|
1)
|
2)
|
3)
|
4)
|
5)
|
6)
|
7)
|
8)
|
9)
|
10)
|
11)
|
12)
|
13)
|
14)
|
15)
|
16)
|
17)
|
18)
|
19)
|
20)
|
21)
|
22)
|
23)
|
24)
|
1)
|
2)
|
3)
|
4)
|
5)
|
6)
|
7)
|
8)
|
9)
|
10)
|
11)
|
12)
|
13)
|
14)
|
15)
|
16)
|
17)
|
18)
|
19)
|
20)
|
21)
|
22)
|
23)
|
24)
|
1)
|
2)
|
3)
|
4)
|
5)
|
6)
|
7)
|
8)
|
9)
|
10)
|
11)
|
12)
|
13)
|
14)
|
15)
|
16)
|
17)
|
18)
|
19)
|
20)
|
21)
|
22)
|
23)
|
24)
|
1)
|
2)
|
3)
|
4)
|
5)
|
6)
|
7)
|
8)
|
9)
|
10)
|
11)
|
12)
|
13)
|
14)
|
15)
|
16)
|
17)
|
18)
|
19)
|
20)
|
21)
|
22)
|
23)
|
24)
|
1)
|
2)
|
3)
|
4)
|
5)
|
6)
|
7)
|
8)
|
9)
|
10)
|
11)
|
12)
|
13)
|
14)
|
15)
|
16)
|
17)
|
18)
|
19)
|
20)
|
21)
|
22)
|
23)
|
24)
|
1)
|
2)
|
3)
|
4)
|
5)
|
6)
|
7)
|
8)
|
9)
|
10)
|
11)
|
12)
|
13)
|
14)
|
15)
|
16)
|
17)
|
18)
|
19)
|
20)
|
21)
|
22)
|
23)
|
24)
|
1)
|
2)
|
3)
|
4)
|
5)
|
6)
|
7)
|
8)
|
9)
|
10)
|
11)
|
12)
|
13)
|
14)
|
15)
|
16)
|
17)
|
18)
|
19)
|
20)
|
21)
|
22)
|
23)
|
24)
|
1)
|
2)
|
3)
|
|---|---|---|
4)
|
5)
|
6)
|
7)
|
8)
|
9)
|
10)
|
11)
|
12)
|
13)
|
14)
|
15)
|
16)
|
17)
|
18)
|
19)
|
11)
|
12)
|
13)
|
14)
|
15)
|
16)
|
20)
|
21)
|
22)
|
|---|---|---|
23)
|
24)
|
1)
|
2)
|
3)
|
|---|---|---|
4)
|
5)
|
6)
|
7)
|
8)
|
9)
|
10)
|
11)
|
12)
|
13)
|
14)
|
15)
|
16)
|
17)
|
18)
|
19)
|
11)
|
12)
|
13)
|
14)
|
15)
|
16)
|
20)
|
21)
|
22)
|
|---|---|---|
23)
|
24)
|