Direct observation of charge order and orbital glass state in multiferroic LuFe2O4.
Abstract
Geometrical frustration of the Fe ions in LuFe2O4 leads to intricate charge and magnetic order and a strong magnetoelectric coupling. Using resonant x-ray diffraction at the Fe edge, the anomalous scattering factors of both Fe sites are deduced from the ( ) reflections. The chemical shift between the two types of Fe ions equals 4.0(1) eV corresponding to full charge separation into Fe2+ and Fe3+. Polarization and azimuthal angle dependence of the superlattice reflections demonstrates the absence of differences in anisotropic scattering revealing random orientations of the Fe2+ orbitals characteristic of an orbital glass state.
pacs:
71.70.Ch; 75.40.Cx; 78.70.CkNew materials that exhibit strong magnetoelectric coupling are fascinating because a large coupling between ferroelectric and magnetic interactions is rare, and its origin often unclear. Competing interactions lead to novel ground states that give rise to unusual material properties, i.e coexistence of spontaneous magnetic and ferroelectric order Kimura et. al. (2003). The ability to control electric polarization with a magnetic field or the magnetization with an electric field Zhao et. al. (2006); Yamasaki et. al. (2007); Bodenthin et. al. (2008) makes these multiferroic materials promising candidates for novel applications such as 4-state memory and switchable magneto-optical devices. In most ferroelectric materials, electric polarization arises from covalent bonding between anions and cations or the orbital hybridization of electrons. Alternatively ferroelectric polarization may arise from frustrated charge order as reported for LuFe2O4 Ikeda et. al. (2005). This compound is of particular interest because, in addition to ferroelectricity, magnetism originates from the same Fe ions and this holds the promise of strong magnetoelectric coupling. The ferroelectric and magnetic order take place at and near ambient temperature which provides the potential for room temperature multiferroics.
The crystal structure of LuFe2O4 consists of a triangular double layer of iron ions, forming trigonal bipyramids with five oxygen nearest neighbors, in which an equal amount of Fe2+ and Fe3+ are believed to coexist at the same site Sekine and Katsura (1976). The occurrence of different charge order schemes has already been studied in more detail theoretically and experimentally Xiang and Whangbo (2007); Zhang et. al. (2007). LuFe2O4 adopts a ferroelectric ground state below 350 K, while below 250 K two-dimensional magnetic order is established in the triangular planes which enhances the ferroelectric polarization by 20%, illustrating coupling between the magnetic and ferroelectric order Ikeda et. al. (2005); Iida et. al. (1993). The observation of the (1/3 1/3 13/2) reflection using resonant x-ray Bragg diffraction (RXD) further supports the existence of charge ordering Ikeda (2008).
RXD has become a powerful technique to study charge, orbital and magnetic arrangements. Tuning the energy of the incoming radiation to an absorption edge permits recording Bragg reflections with enhanced sensitivity to the specific ion and its electronic configuration. In case of the Fe edge, the incident x-rays virtually excite an electron from the 1s core level to the empty 4p states, followed by a decay of the electron back to the core hole. This effect results in a significant variation in the atomic scattering factors of the Fe ions for x-ray energies close to the Fe edge. The atomic scattering factors are also affected by variations in charge state, ordered aspherical electron densities or ordered magnetic moments. In particular asphericity of the atomic electron density results in anisotropy of the tensor of x-ray susceptibility (ATS). Each of these phenomena has a specific dependence on the polarization of the incoming radiation and the orientation of the sample with respect to the scattering geometry. The significance of RXD has been demonstrated, among others, in the manganites Herrero-Martin et. al. (2004), nickelates Scagnoli et. al. (2005) and magnetite Nazarenko et. al. (2006).
In a perfectly charge ordered state, each site may be considered as having an excess and a deficiency of half an electron respectively, compared to the average ion valence of Fe2.5+. Alternatively charge disproportionation with fractional charges may exist as exemplified in nickelates Alonso et. al. (1999); Staub et. al. (2002). Frustration arises because every excess charge prefers a deficiency charge as a neighbor which is not possible on a triangular lattice. However, in the presence of a second triangular layer a net transfer of charge from the first layer to second occurs because then it is possible to have charge order on each layer in a honeycomb lattice arrangement Wannier (1950); Nasu et. al. (2008).
The crystal field of the trigonal bipyramids splits the 3 states of LuFe2O4 into two doublets ( and ) and a singlet () Nagano et. al. (2007). Fe3+ with five 3d electrons is spherical while Fe2+ with six 3d electrons exhibits doubly degenerate orbital degree of freedom in the ground state.
In this paper we present RXD data with azimuthal angle and polarization analysis and our results clarify that the charge order is close to electronic states of Fe2+ and Fe3+, in contrast to small values of disproportionation observed in nickelates Staub et. al. (2002) and manganites Herrero-Martin et. al. (2004). Moreover the absence of scattering due to ATS demonstrates a glass state of the Fe2+ orbitals in agreement with calculations Nagano et. al. (2007).
Polycrystalline LuFe2O4 was prepared by a solid state reaction as reported in ref. Iida et al. (1990). Starting materials of Lu2O3 and Fe2O3 with 99.99% purity were mixed, pressed into pellets and sintered at 1200∘C during 6 h in H2/He/CO2 atmosphere (H2/CO2 ratio 1/3) and quenched into ice water. After grinding, the obtained powder was hydrostatically pressed and sintered at the same conditions during 3h. The crystal growth was carried out using Optical Floating Zone Furnace with four 1000W halogen lamps as a heat source, growth rate 1 mm/h, 2 bar pressure of CO 2/CO mixture (5/2 ratio). The single crystal was cut and samples have been polished perpendicular to the [001] and [110] directions. The magnetic ordering temperature was determined with a SQUID magnetometer at 240 K and pyroelectric current measurement confirmed ferroelectric order below 330 K and enhanced ferroelectric order below 220 K.
Various ( ) superlattice reflections were recorded at the Fe edge at beamline ID20 of the ESRF Paolasini (2007). Polarization analysis was performed using a MgO (2 2 2) analyser crystal of which the polarization efficiency was determined at 0.98 for the energy of the Fe edge. In addition, RXD was recorded at the MS beamline at the SLS (see also supplement sup ) using the Pilatus 2D detector Broennimann et. al. (2006). The background, mainly originating from the fluorescence of the sample, was determined from selected border regions of the area detector and subtracted. The integrated diffracted intensity was corrected for polarization, absorption and sample geometry. The absorption, , was obtained from the (006) reflection by iteration of the calculated anomalous intensity according to spacegroup and deduced from the ratio between calculated and integrated intensity recorded with the 2D detector. Besides was recorded at the X-ray Absorption Spectroscopy beamline at the Australian Synchrotron using powdered LuFe2O4 pressed with cellulose and Fe foil as energy calibration. It confirmed the validity of the method to obtain from the (006). RXD recorded at the SLS was used to analyse the energy dependence while RXD recorded at ID20 was used to investigate polarization dependence and rotation about the scattering vector q (azimuthal angle ). is defined zero when [110] and [001] are in the scattering plane.
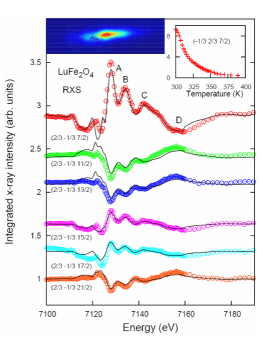
The (h/3 k/3 7/2) reflections show identical RXD sup while the magnitude and sign of the RXD observed at the (2/3 -1/3 l/2) reflections depends on l (Fig. 5). The relative magnitude and shape is constant between 10 K and 300 K and the diffracted intensity gradually disappears above the ferroelectric ordering temperature as illustrated in the inset of Fig. 5. Thomson scattering associated with the crystallographic distortion that accompanies the ferroelectric polarization dominates the diffracted intensity before and after the edge. The variation of XRD with l suggests that the scattering amplitude related to the anomalous diffraction of the Fe ions adds phase shifted contributions to the scattering amplitude from the structural distortion, depending on the l index. The structure factor is with the atomic form factor of atom and its position in the unit cell. To analyse the energy dependent intensity we separate into an energy independent and an energy dependent term, , where the first term is the Thomson scattering of Fe, Lu and/or O ions and the second term is anomalous diffraction due to the Fe ions. These terms are written as and where and are the real and imaginary component of the non resonant structure factor and and are the real and imaginary component of the anomalous scattering factor of the Fe ions. and are related through the Kramers-Kronig (KK) relation.
For the superlattice reflections of this study almost cancels except for the fact that Fe ions in different local electronic environments exhibit different energies of the and the states. This results in different transition energies, for example a chemical shift of 4.5 eV has been reported for between Fe2+ and Fe3+ in water complexes Benfatto et. al. (2002). In addition, ATS arises when the states are split. The extended orbitals are sensitive to local distortions and orbital order of the shell gives rise to splitting of the states, for example via the associated Jahn Teller effect.
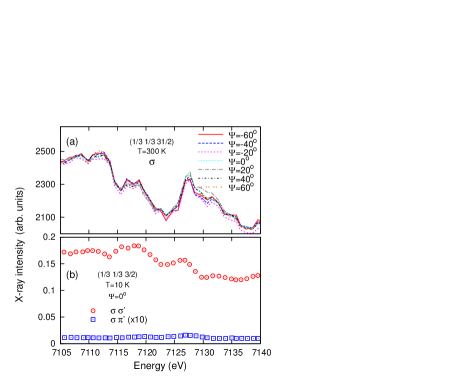
Differences in ATS give rise to a modulation in RXD intensity as function of azimuthal angle that is related to the symmetry of the distortion. Combined with the Thomson scattering, whose diffracted intensity is independent of azimuthal angle, this results in a change of the relative amplitude. Fig.2a shows this is not observed in LuFe2O4 in contrast to orbitally ordered manganites Herrero-Martin et. al. (2004). Furthermore, a significant contribution in diffraction with rotated polarization is expected for ATS, whereas polarization analysis shows that the diffracted intensity with rotated polarization, , is weak and accounted for by the unrotated contribution within the polarization resolution of the analyzer (See Fig. 2b). The (1/3 1/3 l/2) reflections of Fig. 2 have arbitrary angles with the [001] direction ( = 73∘ and = 18∘) so that ATS is not canceled to zero by symmetry if there is orbital order. Moreover, polarization analysis of various other (1/3 1/3 l/2) reflections and several azimuthal angles recorded for l=29 yielded the same result sup .
Both aspects signal the absence of local asymmetric distortions associated with orbital order and point to a rather symmetrical expansion or contraction of the trigonal bipyramids in the plane, changing the electronic density at the resonant ion while the symmetry of the scattering factor is unaltered.
The energy dependencies of the (h/3 k/3 l/2) reflections are examined with two different charge states of the Fe ions, labeled 1 and 2, and the structure factor at (h/3 k/3 l/2) equals
| (1) | |||||
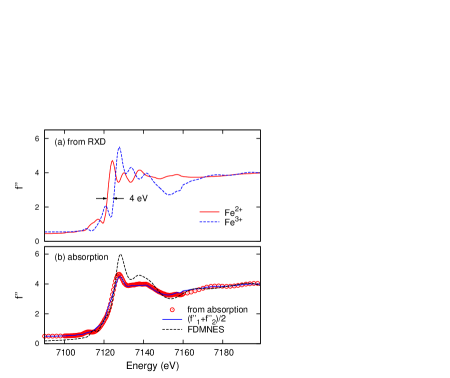
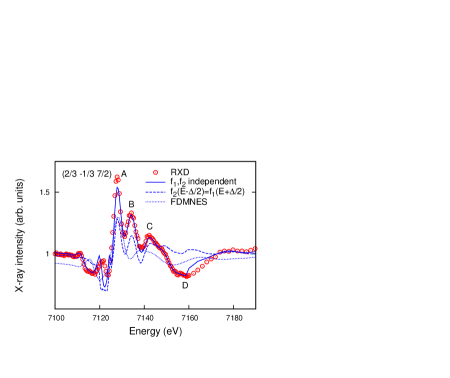
Where and are real constants of arbitrary magnitude. In particular is non zero due to the charge order and breaking of inversion symmetry. The sum is obtained from using the optical theorem. In this work we aim to deduce and from the RXD spectra without any assumptions on the local distortion. To test the robustness of the specific energy dependencies, the series of (2/3 -1/3 l/2) reflections are refined with different methods. Besides fully independent and , we added the constraint , where equals the chemical shift. Moreover, we have calculated with FDMNES using the muffin tin approximation Joly (2001); sup in and used to fit the XRD data. The chemical shift between and is similar in the three refinements and equals 4.0(1) eV. The first refinement resulted in distinct energy dependencies for and . This is understood as a result of the experimental uncertainty of the XRD spectra and minimizing was added in a further refinement to promote similarity between and . Fig.5 illustrates the resulting fits and and are presented in Fig. 3. Both and exhibit characteristic features at similar energies above the edge however their magnitudes are different. Fig.4 compares the three different models for the (2/3 -1/3 7/2) reflection.
The chemical shift between and of 4.0(1) eV corresponds to the chemical shift between Fe2+ and Fe3+ in FeO and Fe2O3 and confirms Fe2+/Fe3+ charge order. Besides the invariable chemical shift there are dissimilarities between the models. The double feature indicated with B,C in Fig. 4 is not reproduced by the fit based on the FDMNES calculations. In addition, the broad feature, labeled D, cannot be accounted for with . Yet, features B,C and D are either in or out of phase with the Thomson scattering (see Fig. 5). This signifies that the Fe-O bonds are distinct at each Fe site.
Long range of the Fe2+ orbitals leads to ATS that is distinct from that of the spherical Fe3+ ion. Such difference in ATS between the Fe2+ and Fe3+ ions is absent and evidence of random orientations of the Fe2+ orbitals. Our findings are consistent with the unconventional orbital state calculated by Nagano with frustrated orbital orientations and large degeneracy in the ground state Nagano et. al. (2007).
The orbital state critically influences the superexchange interaction and is essential to understand the magnetoelectric properties of LuFe2O4. In contrast to the manganites, where the orbital liquid state is discussed to be associated with the ferromagnetic and metallic state Tokura and Nagaosa (2000), LuFe2O4 shows orbital disorder in the ferroelectric state. As such it is more appropriate to classify LuFe2O4 as an orbital glass, adding further frustration to the already frustrated magnetic interactions of Ising spins on a triangular lattice.
Fe3O4 and LuFe2O4 both exhibit ferrimagnetic order combined with magnetoelectric effects Khomskii (2006) but their charge and orbital states are evidently distinct. Fe3O4 shows merely fractional charge order Nazarenko et. al. (2006) and recently order of the orbitals was observed below the Verwey transition Schlappa et. al. (2008). While the superexchange is prevailing in Fe3O4, coulomb interactions dominate in LuFe2O4, resulting in charge order and crystallographic distortions that do not accommodate orbital alignment. The reduced amplitude of of Fe2+ just above the edge (see Fig.3a) is possibly indicative of this frustration and subject of further investigation.
Finally it is noted that cooling from 380 K in an electric field of 1 MV/m (EFC) did not result in a significant change of the ( ) superlattice reflections which contradicts the suggestion that ferroelectric charge order is the ground state only after EFC Angst et. al. (2008).
In conclusion, our RXD data show an almost complete Fe2+/Fe3+ charge order as origin of the superlattice in LuFe2O4. The Fe scattering factors are isotropic and in agreement with frustrated and random orientations of the Fe2+ orbitals, forming an orbital glass state.
We thank the beamline staff of X04SA and in particular Phil Wilmot and Dominique Meister for its excellent support, Chris Glover and the Australian Synchrotron for XANES measurement, Alec Duncan and the Centre for Marine Science and Technology for the use of Matlab routines, and acknowledge the ESRF for provision of beamtime. This work was partly performed at the SLS of the Paul Scherrer Institut, Villigen, Switzerland. We acknowledge financial support from the NCCR MaNEP Project, the Swiss National Science Foundation, AINSE and Access to Major Research Facilities Programme which is a component of the International Science Linkages Programme established under the Australian Government’s innovation statement, Backing Australia’s Ability.
References
- Kimura et. al. (2003) T. Kimura et. al., Nature 426, 55 (2003).
- Zhao et. al. (2006) T. Zhao et. al., Nat. Mat. 5, 823 (2006).
- Yamasaki et. al. (2007) Y. Yamasaki et. al., Phys. Rev. Lett. 98, 147204 (2007).
- Bodenthin et. al. (2008) Y. Bodenthin et. al., Phys. Rev. Lett. 100, 027201 (2008).
- Ikeda et. al. (2005) N. Ikeda et. al., Nature 436, 1136 (2005).
- Sekine and Katsura (1976) T. Sekine and T. Katsura, J. Solid State Chem. 17, 49 (1976).
- Xiang and Whangbo (2007) H. J. Xiang and M.-H. Whangbo, Phys. Rev. Lett. 98, 246403 (2007).
- Zhang et. al. (2007) Y. Zhang et. al., Phys. Rev. Lett. 98, 247602 (2007).
- Iida et. al. (1993) J. Iida et. al., J. Phys. Soc. Jpn. 62, 1723 (1993).
- Ikeda (2008) N. Ikeda, J. Phys. Condens. Matter 20, 434218 (2008).
- Herrero-Martin et. al. (2004) J. Herrero-Martin et. al., Physical Review B 70, 024408 (2004).
- Scagnoli et. al. (2005) V. Scagnoli et. al., Phys. Rev. B 72, 155111 (2005).
- Nazarenko et. al. (2006) E. Nazarenko et. al., Phys. Rev. Lett. 97, 056403 (2006).
- Alonso et. al. (1999) J. Alonso et. al., Phys. Rev. Lett. 82, 3871 (1999).
- Staub et. al. (2002) U. Staub et. al., Phys. Rev. Lett. 88, 126402 (2002).
- Wannier (1950) G. H. Wannier, Phys. Rev. 79, 357 (1950).
- Nasu et. al. (2008) A. Nasu et. al., Phys. Rev. B 78, 024416 (2008).
- Nagano et. al. (2007) A. Nagano et. al., Phys. Rev. Lett. 99, 217202 (2007).
- Iida et al. (1990) J. Iida, S. Takekawa, and N. Kimizuka, Journal of Crystal Growth 102, 398 (1990).
- Paolasini (2007) L. Paolasini, J. Synchrotron Rad. 14, 301 (2007).
- (21) More details can be found in the Supplement.
- Broennimann et. al. (2006) C. Broennimann et. al., J. Syn. Rad. 13, 120 (2006).
- Benfatto et. al. (2002) M. Benfatto et. al., Chem. Phys. 282, 441 (2002).
- Joly (2001) Y. Joly, Phys. Rev. B 63, 125120 (2001).
- Tokura and Nagaosa (2000) Y. Tokura and N. Nagaosa, Science 288, 462 (2000).
- Khomskii (2006) D. I. Khomskii, J. Magn. and Magn. Mat. 306, 1 (2006).
- Schlappa et. al. (2008) J. Schlappa et. al., Phys. Rev. Lett. 100, 026406 (2008).
- Angst et. al. (2008) M. Angst et. al., Phys. Rev. Lett. 101, 227601 (2008).
Supplement
In this supplement we present additional details of our study that might be of interest for the specialist reader. In the first section we present details of the FDMNES calculations, in the second section details of resonant x-ray diffraction (RXD) recorded at other superlattice reflections and in the third section details of the experimental geometry.
I 1. FDMNES
The FDMNES calculation presented in Fig 3.a of the paper was performed using the muffin tin approximation Joly (2001) with space group (no. 166), crystal parameters = 3.4406, = 3.4406, = 25.280, = 90∘, = 90∘, = 120∘ and atom positions of Lu at (0,0,0), Fe at (0, 0, 0.21518) and O at (0, 0, 0.1291) and (0, 0, 0.2926). The result converged at a cluster radius of 6.
II 2. In plane symmetry
The symmetry of the ferroelectric structure of LuFe2O4 is not unambiguously known at this stage and there are possibly several tensors of x-ray susceptibility (ATS) allowed. These terms are significant in systems where charge order is connected with orbital order, such as manganites and magnetite, resulting in strong azimuthal angle dependences as well as observable contributions in the rotated channels Grenier et al. (2004); Herrero-Martín et al. (2004). In contrast, charge order without orbital order as observed in for example NdNiO3, results in RXD that is independent of azimuthal angle Scagnoli et al. (2005). The (1/3 1/3 31/2) and (1/3 1/3 3/2) reflections have angles = 18∘ and 73∘ with the [001] direction so that ATS is not canceled to zero by symmetry if there is orbital order. Moreover we recorded azimuthal angles of 0∘, 30∘ and 60∘ for the (1/3 1/3 29/2) reflection ( = 19∘) and polarization dependencies for various (1/3 1/3 l/2) reflections with l=23-37 ( = 23∘-15∘) (at beamline ID20 of the ESRF) which yielded the same result.
Figure 5 illustrates resonant X-ray diffraction (RXD) for (h/3 k/3 7/2) reflections ( = 54∘) recorded at the MS beamline of the SLS. The RXD of these six reflections is identical, consistent with eq. (1) in the paper.
| (h,k,l) | Pζ | ||||
|---|---|---|---|---|---|
| (1/3, 1/3, 7/2) | 10.00 | 66.29 | 14.09 | 19.73 | 0.37 |
| (1/3, -2/3, 7/2) | 10.00 | -48.32 | 12.97 | 20.31 | 0.46 |
| (-1/3, -1/3, 7/2) | 10.00 | -106.19 | 14.39 | 19.29 | 0.33 |
| (-1/3, 2/3, 7/2) | 10.00 | 127.84 | 15.70 | 18.44 | 0.21 |
| (-2/3, -1/3, 7/2) | 10.00 | -169.65 | 15.48 | 18.27 | 0.21 |
| (2/3, -1/3, 7/2) | 10.00 | 10.06 | 12.69 | 20.49 | 0.49 |
| (2/3, -1/3, 11/2) | 10.00 | 11.39 | 21.03 | 20.99 | 0.07 |
| (2/3, -1/3, 13/2) | 10.00 | 14.56 | 25.27 | 21.05 | -0.10 |
| (2/3, -1/3, 15/2) | 10.00 | 17.15 | 29.75 | 21.43 | -0.23 |
| (2/3, -1/3, 17/2) | 10.00 | 20.69 | 34.61 | 20.83 | -0.38 |
| (2/3, -1/3, 21/2) | 10.00 | 30.45 | 43.68 | 20.01 | -0.56 |
III 3. Surface Diffractometer
RXD as illustrated in Fig. 1 of the paper and Fig. 5 of this supplement were recorded at the surface diffractometer of the X04SA beamline web using the Pilatus 2D detector Broennimann et al. (2006). This station is a large 2+3-circle surface diffractometer with two circles for the sample and three for the detector, plus a hexapod for precise alignment of the sample surface relative to the diffractometer axes. The diffractometer was operated with a vertical sample surface orientation.
Horizontal polarization of the incoming radiation was used which corresponds to incident polarization when the scattering plane is horizontal. When the scattering plane is not horizontal the incident beam contains both and polarized components. The polarization of the incident radiation is most conveniently characterized by the Poincaré vector which equals +1(-1) for () incident radiation Blume and Gibbs (1988). Table 1 gives for the superlattice reflections presented in this study. Table 1 also summarizes the angles that define the orientation of the sample (, ) and detector (, ) with respect to the incoming radiation. The sample is mounted at the centre of rotation and and are the angles in the horizontal plane between the incoming beam and the sample surface and detector position respectively. is the sample rotation about an axis normal to the sample surface and is the angle between the horizontal plane and the detector position respectively. No polarization analysis of the diffracted beam was performed and the pixel detector records both rotated and unrotated polarizations.
References
- Joly (2001) Y. Joly, Phys. Rev. B 63, 125120 (2001).
- Grenier et al. (2004) S. Grenier, J. Hill, D. Gibbs, K. Thomas, M. v. Zimmermann, C. Nelson, V. Kiryukhin, Y. Tokura, Y. Tomioka, D. Casa, T. Gog, and C. Venkataraman, Phys. Rev. B 69, 134419 (2004).
- Herrero-Martín et al. (2004) J. Herrero-Martín, J. García, G. Subías, J. Blasco, and M. C. Sánchez, Physical Review B 70, 024408 (2004).
- Scagnoli et al. (2005) V. Scagnoli, U. Staub, M. Janousch, A.M. Mulders, M. Shi, G. Meijer, S. Rosenkranz, S. Wilkins, L. Paolasini, J. Karpinski, S. M. Kazakov, and S. W. Lovesey, Phys. Rev. B 72, 155111 (2005).
-
(5)
Details of the geometry can be found at
http://sls.web.psi.ch/view.php/beamlines/ms/sd/ endstation/index.html. - Broennimann et al. (2006) C. Broennimann, E. Eikenberry, B. Henrich, R. Horisberger, G. Huelsen, E. Pohl, B. Schmitt, C. Schulze-Briese, M. Suzuki, T. Tomizaki, H. Toyokawa, and A. Wagner, J. Syn. Rad. 13, 120 (2006).
- Blume and Gibbs (1988) M. Blume and D. Gibbs, Phys. Rev. B 37, 1779 (1988).