Mixing: An Overview
Jörg Marks for the BABAR Collaboration
Physikalisches Institut der Universität Heidelberg
Philosophenweg 12,
D-69120 Heidelberg, GERMANY
Abstract
Recently, the factory experiments BABAR and Belle as well as the CDF collaboration found evidence for mixing in the meson system. The current status (beginning of summer 2008) of the experimental results of mixing is summarized.
1 Introduction
The most surprising result of last year’s spring conferences on particle physics was the report of the evidence for mixing by both the BABAR and Belle collaborations [1, 2]. At the end of 2007, the CDF collaboration found evidence for mixing [3] in a different environment but in the same decay channel as BABAR.
The first mixing results were obtained in the neutral kaon system [4], 50 years ago. Mixing in the system [5] was established in 1987 and measurements of the mixing parameters in the system were published in 2006 by the CDF and D0 collaborations [6].
Within the Standard Model (SM), mainly the first two generations contribute to the mixing and the mixing parameters and CP violation are expected to be very small. The observation of the mixing completes the picture of quark mixing, since the system, in contrast to the other three neutral systems, involves down-type quarks in the mixing loop. On the other hand, non-Standard Model processes could enhance either the mixing or the CP violation or both. Therefore, the measurement of large mixing parameters in the system or sizable CP violation would be a strong indication for New Physics (NP).
In this paper, we present an overview of mixing. After an introduction to the charm mixing phenomenology and analysis techniques, results of the mixing parameters and CP violation as related to mixing are summarized. They are obtained from hadronic two-body, multi-body final states and from quantum correlated decays of the experiments BABAR, Belle, Cleo and CDF. Mixing results from semileptonic decays can be found elsewhere [7, 8].
2 Mixing formalism and notation
The neutral mesons are created as eigenstates of the strong interaction and can be distinguished by an internal quantum number, e.g. charm. Due to the weak interaction, an initially defined state of or will evolve with time into a mixture of and . The time evolution can be described by an effective weak Hamiltonian in the time dependent Schrödinger equation
where and are mass and decay width matrices. The solutions of the Schrödinger equation are the mass eigenstates
with . They are linear combinations of the flavor eigenstates and . The mass eigenstates, and , propagate independently in time with their own lifetime and mass
The ratios and are related to the difference in lifetime and mass of the mass eigenstates. These variables are referred to as mixing parameters and are the observables to be measured.
The probability to find the state from an initial state after a time is
and the one to find a is
After a certain time, the opposite flavor component appears. Mixing will occur if either the mass difference or the lifetime difference of the two states is non-zero. Depending on the size of and , an oscillating behavior can be observed, e.g. as in the case of the system.
If CP violation is neglected the state () is CP-even (CP-odd). However, CP violation in mixing can be parametrised in terms of the quantities and , where ( ) is the amplitude of a () to decay into a final state and is the Hamiltonian of the decay. A value of would indicate CP violation in mixing. A non-zero value of would indicate CP violation in the interference between mixing and decay.
There are two contributions to the charm mixing processes, the short range box contributions and a long range part with on- and off-shell intermediate hadronic states. In contrast to the other neutral systems, the box diagrams of the system involve loops of down type quarks. Due to the GIM mechanism and the CKM matrix suppression, the lowest-order short distance calculation gives tiny results ( and [10]). Theoretical predictions for the long-range contributions are very difficult, as the quark is either not heavy enough or too heavy to be treated by the different theoretical frameworks. Evaluations in the Operator Product Expansion (OPE) framework have shown that the mass and lifetime differences are enhanced with increasing order in the OPE [11] compared to an OPE quark level analysis [12]. This yields for both and .
In the SM, CP violation in the charm sector is expected to be small and to be below the sensitivity of the experiments. Any measurement of CP violation in mixing would be a strong indication of NP.
Calculations within the SM have large uncertainties and, therefore, the ability to detect NP contributions is limited. Nevertheless, the mixing measurements allow for a restriction of the parameter space of NP models. Golowich et al. (summary in [9]) have explored which NP models yield sizable values for and . They addressed 21 NP models from various areas and found that in case of 17 models tightened restrictions on the model parameter space can be placed [13].
3 Experimental techniques
The most significant measurement of the mixing parameters was performed by the BABAR collaboration in the decay [1]. Therefore, basic ideas and techniques of mixing analyses are explained using this decay channel.
3.1 Flavor tagging
In order to perform a mixing measurement, the inital state has to be prepared and tagging of the flavor at production time is required. The standard technique in charm physics is the use of decays 111The charge conjugate modes are included throughout this paper.. Here, the charge of the pion determines the flavor of the at production time.
The flavor at decay time is determined by the final state particle properties. Lets consider the decay of an initial which decays without mixing as . In case of mixing, the converts to a and decays as . Therefore, the charge of the determines the flavor at decay time and thus if mixing occurred. Events of the decay mode are classified as right-sign (RS) and events of the decay mode are classified as wrong-sign (WS).
Beside the Cabbibo-favored (CF) processes mentioned above, the also decays doubly Cabbibo-suppressed (DCS) as . As a consequence, the WS event sample contains not only events which have undergone mixing followed by a CF decay, but also DCS decays. The rate of the DCS events relative to the CF events is suppressed by a factor , where is the Cabbibo angle. The rate of events with mixing is about another factor hundred smaller. Moreover, both decay amplitudes interfere.
3.2 Extracting mixing parameters
While the DCS events decay just exponentially, the mixed decays should have a more complex time structure due to the mixing process. The time evolution of the WS decay rate can be approximated by
| (1) |
where is the rate of the DCS events, and denote the mixing parameters and is the time in units of the decay time. CP conservation and small mixing parameters are assumed. There are three contributions to , the DCS decays (I), the interference of the DCS and mixed decays (II) and the mixed decays (III). Each has a different time dependence. Measuring the time dependence of the WS decay rate allows to determine the mixing parameters and . Because of the strong phase difference between the CF decay amplitude and the DCS decay amplitude the mixing parameters are only defined up to a phase factor . Therefore, the mixing parameters are measured as and . The phase depends on the decay mode and in case of multibody decays it may vary over phase space.
The mixing rate defined as the time integral over the term III in Eq. 1 is independent of the strong phase () and can be measured in semileptonic decays.
3.3 Event selection
The value of the production process is about 6 MeV which leads to a narrow peak in the difference of the and the mass (). Selecting data in the peak region of the distribution suppresses backgrounds very effectively. The mass reconstructed from identified kaon and pion tracks is required to be in the expected mass window and the momentum in the center-of-mass system (CMS) has to be larger than 2.5 GeV in order to remove mesons from decays. The kaon and pion tracks are refit to originate from the same vertex and form a which is fit together with the slow pion to a common vertex. This provides an event-wise measurement of the proper time and the error of the proper time . The typical average value is 240 m with a resolution of 100 m.
In the plane of and , the BABAR analysis selects 1,129,000 RS and 64,000 WS candidates from a data sample of 384 .
4 Mixing measurements
4.1
The RS and WS event candidates in the plane of and contain different contributions of signal and backgrounds. Both are described by probability density functions (PDF). Their parameters are determined simultaneously for the RS and WS data sample in an unbinned maximum likelihood fit with four variables per event.
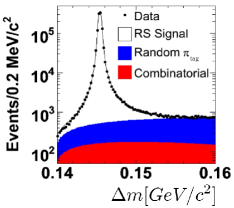
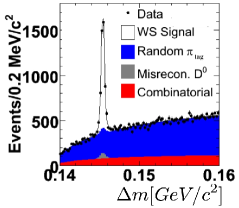
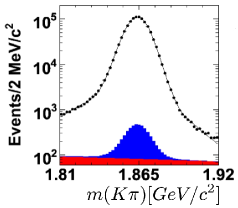
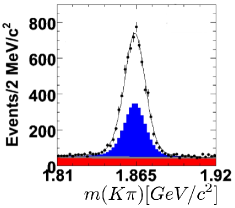
Figure 1 shows the projections in and in of the RS and WS candidates. The black points denote the data and the solid lines show the fitted PDF’s. The white surface below the curve is the extracted signal. The dominant background component (blue) originates from properly reconstructed mesons combined with a random slow pion .
From the fitted signal yields, the WS branching fraction in the decay is extracted. The BABAR measurement [14] of agrees well with the Belle result [15] of , where the uncertainties are statistical and systematic, respectively.
The WS signal contains mainly DCS events with a small fraction of mixing events. In order to separate the mixing signal, decay time information is used as described in Sec. 3.2. The lifetime and the lifetime resolution function is determined from the RS event sample. The WS event sample is fit according to Eq. 1. The result is shown as solid curve in Figure 2.
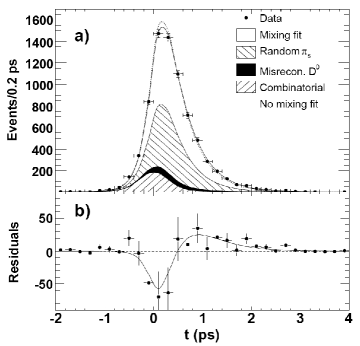
The mixing parameters are measured to be , and . The dotted curve shows the fit with the assumption of no-mixing. The histogram in the lower part of Figure 2 displays the difference of the data and the no-mixing fit (dots), while the curve is the difference between the mixing and the no-mixing fit model. The mixing model describes the deviations seen in the residuals. Thus, the deviations of the points from zero can be accounted for by the mixing. The significance of the mixing signal is evaluated based on the change of the negative log-likelihood with respect to the maximum. Figure 3 (left part) shows the confidence-level contours calculated from the change in log-likelihood () in the two dimensions of and considering statistical uncertainties only. The likelihood maximum is indicated as black dot and is located in an unphysical region (). The most likely physical allowed value ( and ) has a log-likelihood of 0.7 units. The value of for no-mixing is 23.9 units. Including the systematic uncertainties, this corresponds to a significance of 3.9 standard deviations and thus, constitutes evidence for mixing.
To search for CP violation, Eq. 1 is applied to the WS and samples separately, fitting for the parameters , and for decays (+) and decays (-). Both sets of mixing parameters (, ) and (, ) are fully compatible with each other and differ by more than three standard deviations from the no-mixing hypothesis. The values and are calculated. is fully compatible with zero. Both sets of mixing parameters do not differ. Therefore, no evidence for CP violation is observed.
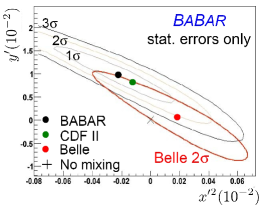
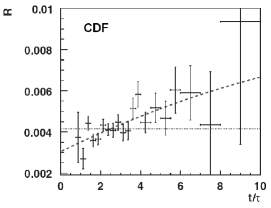
At the end of the year 2007, the CDF II collaboration published evidence for mixing in decays using an integrated luminosity of 1.5 in collisions [3]. The measurement exploits the time dependence of the number of WS and RS decays. In the range from 0.75 to 10 units of the decay time (), WS and RS signal events are selected. A least-squares parabolic fit of Eq. 1 to in 20 bins of as shown in the right part of Figure 3 determines the mixing parameters , and . The no-mixing hypothesis is indicated as dotted line. Despite the different production environment and analysis techniques, the agreement with the BABAR mixing results is astonishing (see green dot in the left part of Figure 3). Bayesian probability contours in the plane are calculated. The data are inconsistent with the no-mixing hypothesis with a probability equivalent to 3.8 standard deviations.
The Belle measurement of mixing in published in 2006 is based on an integrated luminosity of 400 [15]. Mixing parameters of , and are obtained. In Figure 3 the results are compared to the BABAR and CDF measurements. Belle excludes the no-mixing hypothesis with a significance of two standard deviations considering statistical uncertainties only.
4.2 Strong phase
The measurements of the mixing parameters and are only defined up to a strong phase (amplitude ratio of the CF to the DCS decays in ). The CLEO collaboration recently published a measurement of using quantum correlated pairs222CLEO uses the inverse amplitude ratio for the definition of the strong phase . which were produced in 281 of collisions on the (3770) resonance [16]. Two general decay classes are considered, single tags and double tags. For the single tags, one is reconstructed independently of the other. This class provides uncorrelated decay information. In case of the double tags, both mesons are reconstructed, and they decay correlated. The final states can be hadronic or semileptonic. Depending on the final state, different enhancement factors to the ratio of the correlated and uncorrelated decay rates apply. The enhancement factors are functions of the mixing parameters and the strong phase. Therefore, the measurement of the time integrated yields of the correlated and uncorrelated decays allows to extract the mixing parameters and the strong phase by a fitting procedure. Using external branching fraction measurements in the fit, CLEO obtains . Including additional external measurements of the mixing parameters in the fit provides an alternate measurement of and allows for a determination of and .
With these measurements, CLEO established a new technique of time-independent measurements of mixing parameters and the first measurement of the strong phase.
4.3 from lifetime measurements
The decay time of mesons (+) and mesons (-) decaying into final states of specific CP (such as and ) can be considered to first order as exponential with a small correction term that depends on the mixing parameters:
where is the lifetime of the CF decay . The lifetimes can be combined into the quantities and :
with . In the limit of CP conservation333The sign depends on the CP eigenvalue., and .
Belle found significantly different decay time distributions for decays to the CP-eigenstates and compared to the one to the CP-mixed state and measured with a significance of 3.2 standard deviations including systematic uncertainties [2]. The dataset corresponds to 540 . The measured lifetime asymmetry parameter reveals no evidence for CP violation.
At the end of 2007, BABAR published a measurement of from the lifetime of the three decay modes , and [17] using 384 of data. A value of is obtained, which is evidence for mixing at the three standard deviation level. No indication for CP violation was found, as indicated by the value . Combining this result with a previous untagged BABAR measurement [18] yields the combined measurement .
The charm subgroup of the Heavy Flavour Averaging Group (HFAG) provides combined values for mixing parameters [22]. Besides BABAR and Belle, results from E791, FOCUS and CLEO contribute to the average values and . The precision is dominated by the factory experiments. The measurement clearly indicates mixing at a lifetime difference which is about and the no-mixing case is excluded at 4.5 standard deviations. There is no indication for CP violation from the averaged asymmetry measurements.
4.4 Time-dependent Dalitz analysis
Up to now, we considered only two body decays of the . CLEO pioneered a method to measure and from a time-dependent Dalitz analysis of the resonant substructure in the decay [19]. This method allows to measure the sign of .
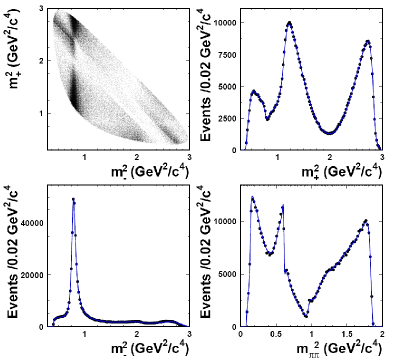
Belle extends the analysis of the self-conjugate process to a dataset of 540 [20]. The Dalitz plot is shown in the upper left distribution of Figure 4. It is described by a model containing contributions of 18 different quasi two body decays, which interfere. The time-dependent decay amplitudes of the and are functions of the Dalitz variables (, ) and the mixing parameters and . Therefore, and can be extracted from an unbinned maximum likelihood fit to the Dalitz variables and the measured decay time. The data points are shown in Figure 4 and the curves represent the fit results.
Assuming negligible CP violation, and are obtained, where the uncertainties are statistical, experimental systematic and decay-model systematic. The no-mixing case is excluded at 2.2 standard deviations.
Allowing for CP violation, the fit of the additional parameters and indicates no evidence for CP violation in mixing or interference between mixed and unmixed amplitudes. Since the fit parameters are consistent for both the and sample, there is also no evidence for direct CP violation.
BABAR finds evidence for mixing using a time-dependent amplitude analysis of the decay in a data sample of 384 [21]. The decay contains WS and RS events (see Sec. 3.1). The signal and background yields are extracted from a binned extended maximum likelihood fit to the and distributions. The time-dependent relative WS decay rate is a function of the Dalitz variables (, ) and the mixing parameters in the form and , where is the strong phase between the DCS and the CF amplitude of . The phase is different from and has to be measured elsewhere. From a time-dependent fit to the WS data, and are derived with a correlation of . The significance is equivalent to 3.2 standard deviations.
5 Combined results
The HFAG determined world average values of the mixing parameters and in a global fit which takes into account all the relevant data from the various experiments [22]. Most of the more recent results have been presented in this talk. They are dominated by the factory measurements with significant contributions from CLEO-c and Tevatron. The no-mixing case is excluded at about seven standard deviations ( and ). The mass difference differs from zero by 3 standard deviations, the lifetime difference deviates from zero by about 4.1 standard deviations. The fit also determines , and . The measurement of CLEO of the strong hadronic phase discussed in 4.2 was not considered because external measurements of and entered in the fitting procedure.
Another set of parameters was determined allowing for CP violation. The values obtained for the CP sensitive parameters , and indicate no evidence for CP violation within the current sensitivity of the experiments.
The measurement from the lifetime (see Sec. 4.3) yields . Therefore, the as CP-even state lives shorter than the CP-odd state . The sign of is measured in the Dalitz analysis (see Sec. 4.4) as . Therefore, the CP-even state is heavier than the CP-odd state .
Preliminary Monte Carlo studies of the LHCb collaboration indicate that the statistical uncertainties of the mixing parameters and measured in a time-dependent WS analysis of decays and a lifetime analysis of decays to and in 10 of data may decrease by a factor five [23].
In summary, three experiments found evidence for mixing measuring lifetime and mass differences at the level of 1 %. The combined results of all experiments exclude the no-mixing case at seven standard deviations. The measurements are compatible with the SM expectations. It seems likely that the mixing is dominated by long-distance processes, which are difficult to calculate. Therefore, identifying NP contributions from mixing alone is not easily possible. Neither a single experiment nor the combination of all results provide any hint for CP violation in mixing.
References
- [1] B. Aubert et al. (BABAR Collab.), Phys. Rev. Lett. 98, 211802 (2007).
- [2] M. Staric et al. (Belle Collab.), Phys. Rev. Lett. 98, 211803 (2007).
- [3] T. Aaltonen et al. (CDF Collab.), Phys. Rev. Lett. 100, 121802 (2008).
- [4] W. F. Fry et al., Phys. Rev. 103, 1904 (1956).
- [5] C. Albajar et al. (UA1 Collab.), Phys. Lett. B 192, 247 (1987); H. Albrecht et al. (ARGUS Collab.), Phys. Lett. B 192, 245 (1987).
- [6] V.M. Abazov et al. (D0 Collab.) Phys. Rev. Lett. B 97, 021802 (2006); A. Abulencia et al. (CDF Collab.), Phys. Rev. Lett. B 97, 242003 (2006).
- [7] B. Aubert et al. (BABAR Collab.), Phys. Rev. D 72, 014018 (2007).
- [8] U. Bitenc et al. (Belle Collab.), arXiv:0802.2952 (2008).
- [9] E. Golowich, Proceeedings of the CHARM Workshop (2007).
- [10] A. F. Falk et al., Phys. Rev. D 97, 054034 (2002).
- [11] I.I.Y. Bigi and N.G. Uraltsev Nucl. Phys. B 592, 92 (2001).
- [12] E. Golowich et al. Phys. Lett. B 625, 53 (2005).
- [13] E. Golowich et al. Phys. Rev. D arXiv:hep-ph/0705.3650 (2007).
- [14] B. Aubert et al. (BABAR Collab.), Phys. Rev. Lett. 98, 211802 (2007).
- [15] L.M. Zhang et al. (Belle Collab.), Phys. Rev. Lett. 96, 151801 (2006).
- [16] J. L. Rosner et al. (CLEO Collab.), arXiv:0802.2264 (2008).
- [17] B. Aubert et al. (BABAR Collab.), arXiv: 0712.2249 (2007).
- [18] B. Aubert et al. (BABAR Collab.), Phys. Rev. Lett. 91, 221801 (2003).
- [19] D. M. Asner et al. (CLEO Collab.), Phys. Rev. D 72, 012001 (2005).
- [20] L.M. Zhang et al. (Belle Collab.), Phys. Rev. Lett. 99, 131803 (2007).
- [21] B. Aubert et al. (BABAR Collab.), arXiv: 0807.4544 (2008)
-
[22]
A. Schwartz et al., arXiv:0803.0082 (2008);
see http://www.slac.stanford.edu/xorg/hfag/charm/index.html . - [23] P. Spradlin et al. (LHCb Collab.), arXiv:0711.1661 (2007);P. Spradlin et al. (LHCb Collab.), LHCb Pub. Note, LHCb-2007-049 (2008).