The VLA Survey of the Chandra Deep Field South.
IV. Source Population
Abstract
We present a detailed analysis of 256 radio sources from our deep (flux density limit of Jy at the field centre at 1.4 GHz) Chandra Deep Field South 1.4 and 5 GHz VLA survey. The radio population is studied by using a wealth of multi-wavelength information in the radio, optical, and X-ray bands. The availability of redshifts for of the sources in our complete sample allows us to derive reliable luminosity estimates for the majority of the objects. X-ray data, including upper limits, for all our sources turn out to be a key factor in establishing the nature of faint radio sources. Due to the faint optical levels probed by this study, we have uncovered a population of distant Active Galactic Nuclei (AGN) systematically missing from many previous studies of sub-millijansky radio source identifications. We find that, while the well-known flattening of the radio number counts below 1 mJy is mostly due to star forming galaxies, these sources and AGN make up an approximately equal fraction of the sub-millijansky sky, contrary to some previous results. The AGN include radio galaxies, mostly of the low-power, Fanaroff-Riley I type, and a significant radio-quiet component, which amounts to approximately one fifth of the total sample. The ratio of radio to optical luminosity depends more on radio luminosity, rather than being due to optical absorption.
Subject headings:
radio continuum: galaxies — X-rays: galaxies — galaxies: active — galaxies: starburst1. Introduction
The extragalactic radio source population ranges from normal galaxies with luminosities W Hz-1 to galaxies whose radio emission is as much as times greater owing to regions of massive star formation or to an active galactic nucleus (AGN). The population of radio sources in the sky with flux densities mJy is dominated by AGN driven emission generated from the gravitational potential associated with a supermassive black-hole in the nucleus. For these sources, the observed radio emission includes the classical extended jet and double lobe radio sources as well as compact radio components more directly associated with the energy generation and collimation near the central engine. Below 1 mJy there is an increasing contribution to the radio source population from synchrotron emission resulting from relativistic plasma ejected from supernovae associated with massive star formation in galaxies or groups of galaxies, often associated with mergers or interactions (e.g., Windhorst et al., 1995; Richards et al., 1998; Fomalont et al., 2002). However, the mix of star forming galaxies (SFG) and AGN and their dependence on epoch is not well determined.
For example, Gruppioni et al. (2003), by using 15-m Infrared Space Observatory (ISO) and 1.4 GHz data have suggested that starburst galaxies start to become a significant fraction of the radio source population for mJy, exceeding only at Jy. On the other hand, Huynh et al. (2005), by fitting radio number counts of the Hubble Deep Field South and other surveys with evolutionary starburst models, have estimated that the number of SFG exceeds of the total already at mJy.
The most commonly accepted paradigm has been that the sub-mJy population is largely made up of SFG. A (small but growing) number of researchers, however (e.g., Gruppioni et al., 1999; Ciliegi et al., 2003; Seymour et al., 2008; Smolčić et al., 2008), have pointed out that radio sources (radio galaxies and radio-loud AGN) could also make a significant contribution to the sub-mJy population. It has been further suggested (Jarvis & Rawlings, 2004; Simpson et al., 2006) that radio-quiet AGN (see below) might become relevant at sub-mJy levels.
The Chandra Deep Field South (CDFS) area is part of the Great Observatories Origins Deep Survey (GOODS) and as such is one of the most intensely studied region of the sky. High sensitivity X-ray observations are available from Chandra (Giacconi et al., 2002; Lehmer et al., 2005; Luo et al., 2008). The GOODS and Galaxy Evolution from Morphology and Spectral energy distributions (GEMS) multiband imaging programs using the HST Advanced Camera for Surveys (ACS) give sensitive high resolution optical images (Giavalisco et al., 2004; Rix et al., 2004). Ground based imaging and spectroscopy are available from the ESO 2.2m and 8m telescopes (see references in Mainieri et al., 2008, Paper II).
We observed the CDFS with the NRAO Very Large Array (VLA) for 50 hours at 1.4 GHz mostly in the BnA configurations in October 1999 and February 2001, and for 32 hours at 5 GHz mostly in the C and CnB configurations between June and October 2001 (details are given in Kellermann et al., 2008, Paper I). The effective angular resolution was and the minimum root-mean-square (rms) noise was as low as Jy per beam at 1.4 GHz and Jy per beam at 5 GHz. A total of 266 radio sources were catalogued at 1.4 GHz, 198 of which are in a complete sample with signal-to-noise ratio (SNR) greater than 5 and located within 15′ of the field center. The corresponding flux density ranges from 42 Jy at the field center to 125 Jy near the field edge. These deep radio observations complement the larger area, but less sensitive, lower resolution observations of the CDFS discussed by Afonso et al. (2006) and by Norris et al. (2006).
In addition to our deep radio data, our set of ancillary data is quite unique and allows us to shed new light on the nature of the sub-mJy radio source population. These data include reliable optical/near-IR identifications for of the radio sources, optical morphological classification for of the sample, redshift information for of the objects, and X-ray detections for of the sources, with upper limits for all but three of the others. This is the largest and most complete sample of Jy sources in terms of redshift information.
The purpose of this paper is to study the composition of the radio-detected VLA-CDFS sample in terms of source properties by using all available information. More details on the VLA-CDFS can be found in Paper I, which addresses the radio data, in Paper II, which discusses the optical and near IR counterparts to the observed radio sources, and in Tozzi et al. (2008) (Paper III), which studies the X-ray properties.
The sample radio-optical data are described in § 2, while § 3 deals with the X-ray data. § 4 analyzes the overall properties of our sample and derives the radio number counts for various classes together with some model predictions, while § 5 discusses our results. Finally, § 6 summarizes our conclusions. Throughout this paper spectral indices are defined by and the values km s-1 Mpc-1, , and have been used. This paper supersedes the preliminary results presented by Padovani et al. (2007b).
2. The sample radio-optical properties
2.1. Expected radio properties
Before we turn to the radio sources, we first define the typical ranges in radio power and radio-to-optical flux density ratio for the type of objects which are most likely to be part of our survey: galaxies (normal, radio, and star forming), and active galactic nuclei (AGN).
Normal galaxies, with radio powers W Hz-1, are thought to have their radio emission dominated by synchrotron radiation from interstellar relativistic electrons (Philips et al., 1986; Sadler et al., 1989). Radio galaxies are considered to have gigahertz radio power W Hz-1 (e.g., Sadler et al., 1989; Ledlow & Owen, 1996), associated with relativistic jets, kiloparsec scale morphology, which extends well beyond the region of optical luminosity, and, at least at low redshift, mostly elliptical hosts. This radio power is at the faint end of the luminosity function of radio galaxies (e.g., Urry & Padovani, 1995) and, therefore, represents a ‘natural’ threshold for ”radio-loudness” in galaxies, although recent papers have suggested the presence of non-thermal, jet emission in early type galaxies as faint as W Hz-1: e.g., Balmaverde & Capetti (2006). Fanaroff & Riley (1974) recognized that radio galaxies separate into two distinct luminosity classes, each with its own characteristic radio morphology. High-luminosity Fanaroff-Riley (FR) IIs have radio lobes with prominent hot spots and bright outer edges, while in low-luminosity FR Is the radio emission is more diffuse. The luminosity distinction is fairly sharp at 178 MHz, with FR Is and FR IIs lying below and above, respectively, the fiducial luminosity W Hz-1. At higher radio frequencies the division is at W Hz-1, with some dependency also on optical luminosity (Owen & White, 1991) and therefore a somewhat large overlap. Finally, SFG can also be relatively strong radio emitters but are hosted by spiral and irregular galaxies at the relative low redshifts of our sample (see § 2.2). These star forming radio sources dominate the local () radio luminosity function below W Hz-1 but reach only W Hz-1 (e.g., Sadler et al., 2002; Best et al., 2005), as compared to W Hz-1 or more for the powerful radio-galaxies. In terms of the rest-frame ratio of radio to optical flux density, which we define as (where is the V-band flux density), SFG have relatively small values. For example, the majority of the ultra-luminous infrared galaxies in Vega et al. (2008) have , which corresponds to , while Machalski & Condon (1999) have found that 98% of their normal and starburst galaxies have (converting from their definition). It is important to note that these two studies reach only and respectively, and therefore one cannot exclude the possibility that higher redshift sources might have larger values (see § 2.2). We assume for the time being as the maximum fiducial value for SFG. We note that Seymour et al. (2008) have used the (observed) ratio as a discriminant between AGN and SFG. Although we have band photometry for less than half of our sample, we find a very strong correlation between observed and rest-frame , from which we infer that Seymour et al.’s dividing line corresponds to , consistent with our own (but see § 4).
About of AGN have, for the same optical power, radio powers orders of magnitude higher than the rest. Two different definitions of radio-loudness have been used in the literature (see, e.g., Kellermann et al., 1989; Stocke et al., 1992). The first is based on the rest-frame ratio of the (5 GHz) radio to optical flux density, with radio-loud sources having values . Assuming (see below), and converting to 1.4 GHz, the commonly accepted dividing line between radio-loud and radio-quiet AGN translates then to , which is the same as the maximum value for SFG adopted above. The other definition is based on gigahertz radio power and appears to be redshift-dependent, with a dividing line ranging from W Hz-1 for the Palomar Green sample (optically bright and at relatively low-redshift) up to W Hz-1 for the Large Bright Quasar Survey sample (optically fainter and at higher redshift). The two definitions overlap somewhat (Padovani, 1993). The radio power limit is, not surprisingly, very close to the maximum power which can be reached by SFG. In the following we will use a single value, W Hz-1, appropriate for our relatively low redshift sample (see below), and comment also on how our results depend on this value.
2.2. The CDFS-VLA sample
Our sample includes all CDFS-VLA sources with a highly reliable (likelihood ratio as defined in Paper II) optical counterpart (apart from one source very close to a bright star for which we could not get reliable photometry) and eight empty fields, for a total of 256 objects, 194 of which belong to the complete sample. We include all sources when studying the overall sample properties but we obviously restrict ourselves to the complete sample when dealing with number counts and fractions of sources of a given class.
Our usage of band data to derive the radio-to-optical flux density ratio is dictated by two facts: 1. almost complete coverage for our sources (we estimated magnitudes from other bands for 20 sources using mean colors); 2. consistency with previous definitions of radio-loud AGN. However, our results are broadly independent of this choice.
One hundred and eight () sources have spectroscopic redshifts, while photometric redshifts are also available for 78 () objects (see details in Paper II). In total, we have redshift information for of our objects, with this fraction reaching for the complete sample. The distribution peaks at , with a sharp cut-off at (see Fig. 11 in Paper II). The mean redshift is (median 0.67).


Fig. 1 shows the band magnitude versus the 1.4 GHz radio flux density for the CDFS-VLA sample. The lines represent different values of the logarithm of the radio-to-optical flux density ratio, ranging from 5 (top right) down to (bottom left). We note that of the sources have observed values beyond the star forming regime, with some of the sources reaching extremely high values of , equivalent to radio-to-optical flux density ratios .
This is better seen in Fig. 2 (top panel), which shows the distribution of rest-frame . For K-correction purposes we used the observed radio spectral index, when available, and the mean value, , when that was not the case. In the optical band K-correction values appropriate for the morphological type of the objects were adopted, based on Coleman et al. (1980). Sources without morphological classification were assumed to be ellipticals111Note that, given the larger K-corrections of ellipticals, any other assumption would result in larger values. (see below), while for compact objects (likely AGN), was assumed. The mean value is . The distribution of for the objects without redshift (derived assuming ) is widely different ( according to a Kolmogorov-Smirnov test) from that of the remaining sources. The mean values for the two sub-samples are in fact and respectively, with of the sources without redshift being in the star forming regime. Their larger values are due to their fainter magnitudes, as the radio flux density distributions for the two sub-samples are not significantly different.
Fig. 2 (lower panels) shows the distribution for various morphological classes (see Paper II for more details), namely ellipticals and lenticulars (51), spirals (60), irregular galaxies (including mergers; 42), compact objects (8), and sources which are either not easily classifiable, too faint, or complex (95). The various types have somewhat different values, as shown in Table 1. Compact sources have the largest value, followed by irregulars, and then galaxies which are not easily classifiable. Ellipticals/lenticulars and spirals have the lowest radio-to-optical flux density ratios. The distribution for galaxies not classifiable is significantly different () from that of spiral/irregular galaxies and also from that of ellipticals/lenticulars (). Somewhat surprisingly, spirals and irregulars, which we can group together as likely hosts of SFG, have larger than ellipticals/lenticulars, with the two distributions being significantly different (). Only of elliptical/lenticular galaxies have , while of spirals and irregulars are above this value. We find a significant difference also between spirals and irregulars (). It has been suggested that the radio-to-optical flux density ratio alone cannot be used to discriminate between AGN and SFG (e.g., Afonso et al., 2005; Barger et al., 2007). We confirm that this is indeed the case.
Possible causes for the fact that spirals and irregulars in our sample reach relatively high radio-to-optical flux density ratios, include: a) evolution. Our sample has , reaching , as compared to the local star forming samples for which has been previously derived. We have quantified possible evolutionary effects by assuming a radio evolution (Hopkins, 2004) and passive -band evolution for Sa and Sc galaxies (Coleman et al., 1980). In the Sa case is predicted to decrease at higher redshifts, because the optical evolution is stronger than the radio one. For Sc galaxies, on the other hand, there is a weak evolution with . This means that at and at should be . This effect could explain up to half of the sources with redshift; b) uncertainties in morphological classification. While Paper II has shown that overall our morphological classification is robust, there could still be subtle effects, which might introduce some bias. For example, while the distributions of magnitudes of ellipticals/lenticulars and spiral galaxies in our sample are very similar, irregulars are on average two magnitudes fainter. If some galaxies are preferentially classified as such when they are faint, this will result in artificially large values for irregulars, with the effect being amplified by the fact that the K-correction for irregulars is the smallest one; c) K-correction. We assumed standard K-corrections, which imply that all spectral energy distributions (SEDs) for sources of a given class are the same. This is obviously unrealistic and will certainly introduce a scatter in the distribution; d) the presence of sources like the one discovered by Norris et al. (2008): a classic triple radio source at and W Hz-1 with the SED of a spiral galaxy. Finally, it is important to notice that not all spirals and irregulars are SFG, as potentially many of these sources could be AGN. It is then clear that we need to add luminosity information.
| Galaxy class | N | N | |||
|---|---|---|---|---|---|
| Ellipticals and lenticulars | 51 | 47 | |||
| Spirals | 60 | 59 | |||
| Irregulars | 42 | 36 | |||
| Spirals and Irregulars | 102 | 95 | |||
| Compact | 8 | 6 | |||
| Other | 95 | 38 | |||
| No redshift, | 70 | 70 | |||
| No redshift, | 70 | 70 | |||
| No redshift, | 70 | 70 | |||
| No redshift, | 70 | 70 |
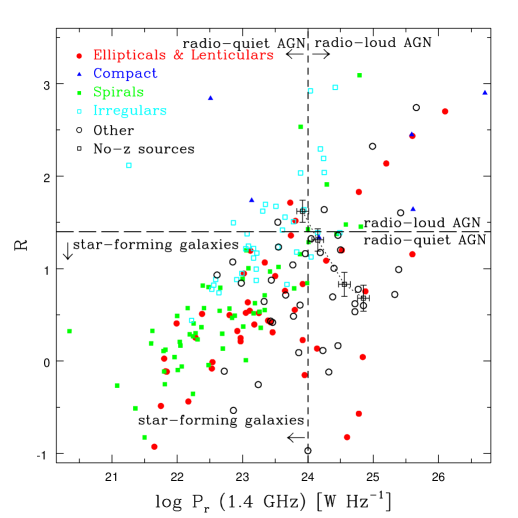
Fig. 3 shows versus the 1.4 GHz radio power for the sources with redshift information. Apart from the obvious correlation between and (the former being equal to ), Fig. 3 shows that all but three sources with have W Hz-1. Turning to morphological source classification, the following points can be made: a) the large majority (85%) of spirals and irregulars have W Hz-1, with this fraction reaching and 100% for W Hz-1 and W Hz-1 respectively; b) spirals and irregulars with have relatively high radio powers ( W Hz-1) and basically all of the sources with are above (or very close to) the W Hz-1 limit; c) 5/6 of compact sources are consistent with being radio-loud AGN; d) ellipticals and lenticulars span a very large range of radio powers, consistent with that of radio-galaxies; there is substantial overlap at low powers between early- and late-type galaxies, with 75% of the former having W Hz-1; e) all ”other” sources have powers in the range of radio galaxies and half of them actually reach into the radio-loud AGN regime. Most of the various types have quite distinct radio powers, as shown in Table 1. Compact sources have the largest radio powers, followed by galaxies which are not easily classifiable, and ellipticals/lenticulars. Spirals/irregulars have the lowest values. The radio power distribution for the sources without morphological classification is significantly different () from that of spirals and irregulars and also () from that of early-type galaxies.
We have also optical spectral classification, from Szokoly et al. (2004), for a relatively small fraction () of the sample, which we use to gather further information. This includes Broad Line AGN (BLAGN), high excitation line objects (HEX), low excitation line objects (LEX), Narrow Emission Line Galaxies (NELG), and objects with normal galaxy spectra (ABS). Broadly speaking, BLAGN correspond to type-1 AGN, HEX mostly to type-2 AGN, while the properties of NELG, LEX, and ABS are consistent with those of normal galaxies but in many cases this is simply a limitation of the optical data.
The spectral classification adds the following information: a) AGN have, on average, radio powers larger than those of LEX, ABS, and NELG ( W Hz-1 as compared to W Hz-1); b) all but one LEX, ABS, and NELG have W Hz-1 and of them concentrate in the bottom-left quadrant of Fig. 3, consistent with the fact that this is where SFG are located.
As for the radio-to-optical flux density ratio, evolution will also affect the maximum radio power of SFG. For (Hopkins, 2004), this could reach W Hz-1 and W Hz-1 at and respectively.
Fig. 3 does not include sources without redshift. If we assign a redshift equal to the mean value of the sample to such sources, they would have and (Table 1), that is most of them would fall into a region outside that of SFG (see Fig. 3). For , which are more likely values given the dependence we find between redshift and magnitude, radio powers would obviously increase, with values decreasing due to the larger K-correction (as of such sources have no morphological information and we assume that they are ellipticals), as shown in Fig. 3. However, the point remains that the majority of these sources would not have values very typical of SFG.
In summary, is not a very good discriminant between SFG and AGN. Radio power fares somewhat better but the overlap between the two classes is still quite large. This is obviously particularly bad for the sources for which no optical morphology is available.
3. Adding X-ray information
We now consider the X-ray information to learn more about the nature of the radio sources. Fig. 4 plots the rest-frame radio-to-optical flux density ratio vs. the keV power for the sources with redshift information. X-ray powers and upper limits are available for all but three sources and for all of those in the complete sample (see Paper III). The vertical short-dashed line at ergs s-1 indicates the approximate dividing line between AGN and normal galaxies (e.g., Szokoly et al., 2004).
To properly take into account the upper limits on X-ray power we used ASURV (Lavalley et al., 1992), the Survival Analysis package which employs the routines described in Feigelson & Nelson (1985) and Isobe et al. (1986), which evaluate mean values by dealing properly with non-detections. Survival analysis methods also evaluate probability of correlation and linear regression fits by dealing properly with non-detections. A correlation found between luminosities, when such non-detections are included, is a true correlation, while flux density - flux density diagrams, which are sometimes used, will reveal the intrinsic relationship between luminosities only under very limited circumstances (no censored points, linear relationship). Since upper limits make up the majority () of the sample, the uncertainties on our results are likely to be larger than the ones given by the software package.
We find a very strong () correlation between and R for the whole sample, which is even stronger () for spirals and irregulars. Two striking features of Fig. 4 are: a) the fact that of all X-ray detections have ergs s-1, with this fraction reaching if one includes upper limits as well; b) the almost complete lack of objects in the top left quadrant, as only of the sources have and ergs s-1 (only half of those are irregulars). Indeed, sources have , almost an order of magnitude larger than sources, which have . This suggests that a large fraction of our sources are AGN and that many high sources with spiral/irregular morphology cannot be SFG as their X-ray powers are too high.
As was the case for the radio power, most of the various types have quite distinct X-ray powers, as shown in Table 1. Compact sources have the largest X-ray powers, followed closely by galaxies which are not easily classifiable, and ellipticals/lenticulars. Irregulars/spirals have the lowest values. The X-ray power distribution for spirals and irregulars is significantly different222The ASURV package evaluates the difference between two distribution using five different tests. We quote here the lowest probability. from that of the sources without morphological classification () and also from that of early-type galaxies (). The spectral classification adds the fact that AGN, on average, have X-ray powers larger than those of LEX, ABS, and NELG ( ergs s-1 as compared to ergs s-1), although of LEX and ABS sources are in the AGN region (all BLAGN and all but but two HEX have AGN-like X-ray powers); in particular, all NELG have only upper limits on their X-ray fluxes.
As before, Fig. 4 does not include sources without redshift. If we assign a redshift equal to the mean value of the sample to such sources, they would have and (Table 1), that is many of them would fall into a region outside that of SFG. For , which are more likely values given the dependence we find between redshift and source magnitude, would decrease but X-ray powers would obviously increase, as shown in Fig. 4, with the result that the majority of these sources would not have values typical of SFG.
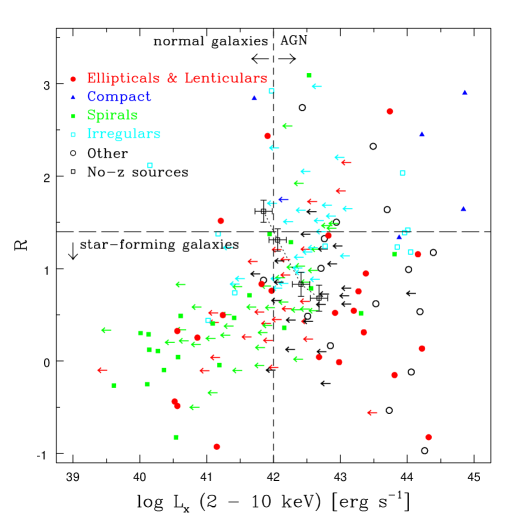
Fig. 5 plots KeV X-ray power versus the 1.4 GHz radio power for the sources with redshift information. The horizontal, long-dashed line at ergs s-1 indicates the approximate dividing line between AGN and normal galaxies (e.g., Szokoly et al., 2004), while the vertical, short-dashed line at indicates the approximate maximum radio power (at ) due to star-formation, which roughly coincides with the dividing lines between low-redshift radio-loud and radio-quiet AGN. The dot-long-dashed line is the X-ray-radio power relation for nearby SFG (Ranalli, Comastri & Setti, 2003), the dotted lines represent the approximate locus of radio galaxies in the AGN catalogue of Padovani, Giommi & Fiore (1997), while the dot-short-dashed and short-long-dashed lines are the best fits for radio-quiet and radio-loud quasars from Brinkmann et al. (2000), where their 2 keV powers were converted to the keV band assuming . For K-correction purposes we used the observed radio and X-ray spectral indices, when available, and the mean values, and , when that was not the case.
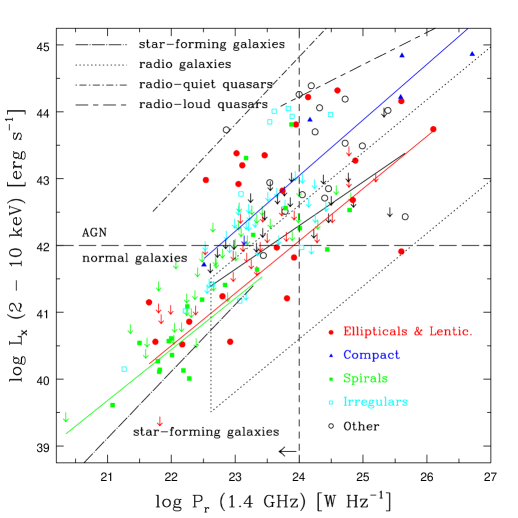
Fig. 5 shows that there is a correlation between radio and X-ray luminosity for the whole sample. ASURV confirms this with a very high significance () giving . Basically all sources in the radio-loud AGN region have AGN-like X-ray powers. The opposite, however, is not true, that is not all sources with ergs s-1 have W Hz-1. This makes sense, as not all AGN are radio-loud. Turning to morphological source classification, the following points can be made: a) 38% of spiral and irregular galaxies have X-ray detections inconsistent with the powers typical of galaxies ( ergs s-1); that is, a sizable fraction of these sources are most likely powered by AGN. The best fit correlation using ASURV (green line) excluding sources with W Hz-1 for consistency with Ranalli, Comastri & Setti (2003) and X-ray detections with ergs s-1 to select against AGN, is (). Given the relatively large fraction of X-ray upper limits (), we regard this as not inconsistent with the X-ray-radio power relationship for nearby SFG (dot-dashed line); b) as was the case for the radio power, ellipticals and lenticulars span a very large range of X-ray powers, consistent with that of radio-galaxies (red line); again, there is substantial overlap at low X-ray powers between ellipticals and spirals; c) ”other” sources have mostly ergs s-1, with the best fit correlation (black line) into the radio-galaxies area; d) compact sources have X-ray powers ergs s-1 and times larger than the other classes at a given radio power.
Note that the correlation we find for spirals/irregulars disagrees with Barger et al. (2007), who suggested that the Ranalli et al. correlation was due to selection effects, but agrees with other results (see discussion in Paper III).
We also notice that only a relatively small number of sources cluster around the relationships previously derived for radio-quiet and radio-loud quasars. We will return to this point later in § 4. Here we point out that the fraction of QSOs, defined as sources with ergs s-1, is only of the objects with redshift and X-ray information. Note that this has to be considered a robust upper limit, as radio galaxies are also strong X-ray emitters. For example, the relatively low-redshift () radio galaxies in the AGN catalogue of Padovani, Giommi & Fiore (1997) can reach ergs s-1, and all five 3CR radio galaxies studied by Salvati et al. (2008) () have ergs s-1. BL Lacs are even stronger X-ray emitters, with of those in the AGN catalogue of Padovani, Giommi & Fiore (1997) having ergs s-1, but are likely to be a minority population in our sample (see § 4.3). Indeed, the average radio spectral index for the ergs s-1 sources is , with only of them having and therefore qualifying as flat-spectrum, which is one of the defining properties of BL Lacs.
In summary, the X-ray data appear to be quite powerful in recognizing AGN among the sub-mJy population.
4. The sub-mJy source population
4.1. The redshift sub-sample
We now examine collectively the radio, optical, and X-ray data. We start by considering only sources with redshift information, which include of the complete sample. Based on the results presented in the previous sections, our candidate star-forming galaxies are defined as fulfilling all the following requirements:
-
1.
-
2.
W Hz-1
-
3.
optical morphology different from elliptical or lenticular
-
4.
ergs s-1 for X-ray detections, no limit otherwise.
The first two criteria include of spirals and irregulars, with the remaining fraction being most likely AGN, the third one excludes sources not associated with star formation at the redshifts under consideration, while the fourth one excludes AGN.
| Flux range | Mean Flux Density | Counts | ||||
|---|---|---|---|---|---|---|
| Total | SF | fraction | AGN | fraction | ||
| Jy | Jy | sr-1 Jy1.5 | sr-1 Jy1.5 | % | sr-1 Jy1.5 | % |
| 63 | ||||||
| 97 | ||||||
| 151 | ||||||
| 318 | ||||||
| 1011 | ||||||
| 9639 | 0.0 | 0 |
Objects not fulfilling these criteria were considered to be AGN. Note that the last requirement is conservative in the sense that it maximizes the number of SFG, as some of the sources with X-ray upper limits above the X-ray threshold could still have ergs s-1 (see below).
Radio-quiet AGN were also selected by considering sources with and X-ray detections with ergs s-1. We did not apply any cut in radio power since the objects with W Hz-1 are all at relatively high redshifts () and are therefore expected to have relatively large luminosities even if radio-quiet (see § 2.1).
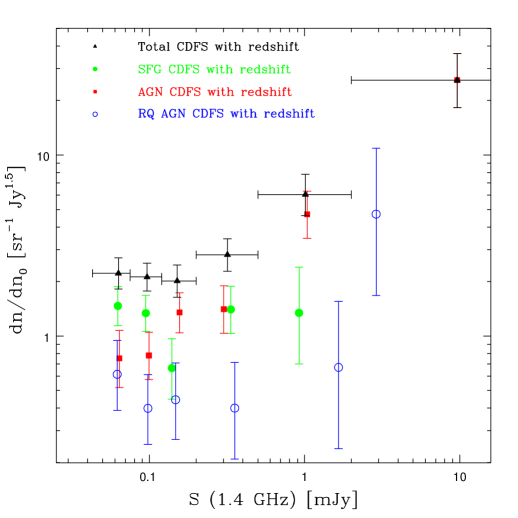
Table 2 and Fig. 6 present the Euclidean normalized number counts for the total redshift sub-sample and also for SFG and AGN, derived as described in Paper I. AGN make up of sub-mJy sources with redshift information but their number drops towards lower flux densities, going from 100% at mJy down to at the survey limit. SFG, on the other hand, constitute of the sub-mJy sample having measured redshifts. SFG are missing at high flux densities but become the dominant population below mJy, reaching at the survey limit. Radio-quiet AGN represent (or of all AGN) of sub-mJy sources but their fraction appears to increase at lower flux densities, where they make up of all AGN at the survey limit.
| R | N | sub-mJy fraction | ||
|---|---|---|---|---|
| W Hz-1 | ergs s-1 | % | ||
| 70 | ||||
| 64 | ||||
| 72 | ||||
| 76 | ||||
| 74 | ||||
| 66 | ||||
| 71 | ||||
| 67 | ||||
| , upper limits | 55 |
We caution that the real uncertainties on the radio-quiet AGN counts are larger than indicated owing to two effects, which go in opposite directions: 1) of our putative radio-quiet AGN have elliptical or undefined morphology, which means their optical fluxes have been K-corrected assuming an elliptical spectrum. This could result in an artificial lowering of if the AGN component is non negligible in the optical band, translating in turn in an overestimation of their number (as we selected sources with ). Our selection criteria could also include some radio galaxies, although their number is expected to be small; 2) the inclusion of X-ray detections only could underestimate the number of radio-quiet AGN, as some sources with upper limits on their X-ray power above ergs s-1 could still have intrinsic powers above this limit.
To assess the dependence of our results on our selection criteria we show in Table 3 how the fraction of sub-mJy SFG changes with different parameters. Namely, we changed the values of (by , ), (by dex), and (by dex). The fraction of sub-mJy SFG changes remarkably little, with a maximum increase and decrease of () and () respectively, well within the error for our standard set of values. The biggest change happens when we include in our selection only sources with upper limits on their X-ray powers ergs s-1, instead of all the X-ray non detections, to check for the effect of our assumption that all sources with X-ray upper limits fall below the AGN dividing line. The fraction of SFG decreases by almost one third to (a difference), which shows that indeed our assumption is a conservative one.
4.2. The whole sample
We now extend our analysis to the whole CDFS-VLA sample. As discussed in § 2.2 and § 3 (see also Figs. 3 and 4), in fact, the bulk of the sources without redshift are unlikely to be SFG. Therefore, it would be unwise to simply extrapolate the results of the redshift sub-sample to the whole sample. For the same reason, any comparison with predicted number counts needs to be done with the full sample.
We then apply our selection criteria described in § 4.1 to all our sources, making various assumptions on the missing redshifts. Table 4 shows that the fraction of sub-mJy SFG is only weakly dependent on the assumed redshift for the sources without spectroscopic and photometric redshifts. This is due to the fact that the increase in power for larger redshifts is compensated by the decrease in due to the larger K-correction, since we assumed elliptical morphology for the sources without that information. For the fraction of sub-mJy SFG equals and in the following we make this assumption.
| redshift | N | sub-mJy fraction |
|---|---|---|
| % | ||
| 88 | ||
| 1.0 | 90 | |
| 1.5 | 89 | |
| 2.0 | 82 |
| Flux range | Mean Flux Density | Counts | ||||
|---|---|---|---|---|---|---|
| Total | SF | fraction | AGN | fraction | ||
| Jy | Jy | sr-1 Jy1.5 | sr-1 Jy1.5 | % | sr-1 Jy1.5 | % |
| 63 | ||||||
| 97 | ||||||
| 152 | ||||||
| 306 | ||||||
| 1032 | ||||||
| 17262 | 0.0 | 0 |
Table 5 and Fig. 7 present the Euclidean normalized number counts for the whole sample and also for SFG and AGN, derived as described in Paper I. The trends are very similar to those of the redshift sub-sample. AGN make up of sub-mJy sources and their counts are seen to drop at lower flux densities, going from 100% of the total at mJy down to at the survey limit. SFG, on the other hand, which represent of the sample, are missing at high flux densities but become the dominant population below mJy, reaching at the survey limit. Radio-quiet AGN represent (or of all AGN) of sub-mJy sources but their fraction appears to increase at lower flux densities, where they make up of all AGN and of all sources at the survey limit, up from at mJy.
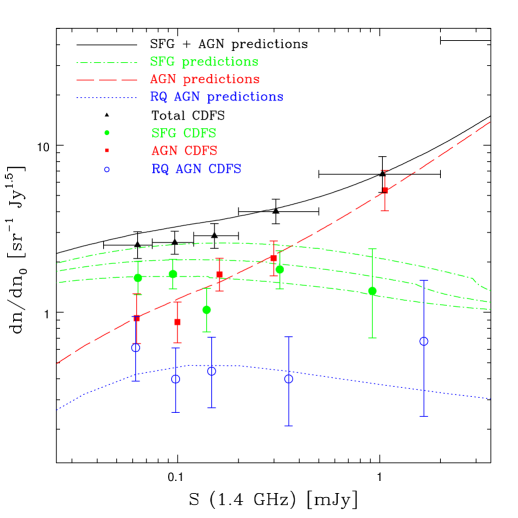
4.3. Expected number of radio sources
In Fig. 7 we overlay some model calculations for the AGN and SFG contribution to the radio source counts. The AGN model includes FR I and FR II radio galaxies and BL Lacertae objects, the only populations significantly present in the counts below a few mJy at 1.4 GHz (Padovani, in preparation). In fact, according to unified schemes, radio quasars, being FR IIs with their powers boosted by relativistic beaming, are expected to disappear from the radio population below mJy (Padovani & Urry, 1992).
Radio galaxy counts were calculated starting from the 2.7 GHz luminosity functions of 2 Jy FR I and II radio galaxies derived by Urry & Padovani (1995), converted to 1.4 GHz assuming . Based on their results, no evolution was assumed for FR Is, while their best fit luminosity evolution ( for an exponential evolution , where is the look-back time and is the evolutionary time scale in units of the Hubble time) was used for FR IIs. BL Lac number counts were estimated from the beaming model of Urry & Padovani (1995) (converted from 5 GHz assuming ), which fits very well not only the original 1 Jy data on which it was based but also the deeper ( mJy) DXRBS sample (Padovani et al., 2007a).
The radio AGN counts are dominated by FR I radio galaxies at sub-mJy levels. In fact, given their higher radio power and stronger evolution, FR IIs reach only mJy. FR Is appear to make up of the radio galaxies with 1 mJy but of the whole sample, and to reach flux densities as low as Jy. BL Lacs can also reach quite faint flux densities (Jy) but make up only a minority of the AGN, in the range mJy.
The surface density for SFG has been derived following Hopkins (2004). Namely, the local luminosity function from Sadler et al. (2002) was adopted, with luminosity evolution to (and constant thereafter) and density evolution . To have a feeling for the likely uncertainties, we have also evaluated the number counts by varying the evolutionary parameters by .
Our AGN counts include a radio-quiet component, as radio-quiet AGN are not radio-silent and are routinely detected at faint flux densities in the radio band. To estimate their expected number counts one would need a sizable sample of such radio-selected sources from which to derive the radio luminosity function and evolution, to then predict their number densities at lower flux densities, as we have done for radio- and star forming galaxies. Unfortunately, such a sample is not available. Radio-quiet AGN, however, are very strong X-ray emitters and indeed dominate the X-ray sky. We therefore took the keV AGN number counts given by Comastri & Brusa (2008) (based on Gilli et al., 2007), which fit the observed X-ray counts down to ergs cm-2 s-1 and make predictions down to ergs cm-2 s-1, to obtain an estimate of the radio-quiet AGN counts in the radio band. We first multiplied the X-ray counts by 0.9, to take into account the fact that radio-loud AGN make up of all AGN, and then converted them to Euclidean normalized counts. To derive radio number counts one would then need to know the intrinsic radio-to-Xray flux ratio distribution, or at least the mean ratio for radio-quiet AGN. This is at present unknown. However, one can obtain robust bounds on this ratio by looking at X-ray selected samples and our own sources.
Polletta et al. (2007) present the SEDs of a hard X-ray selected sample of AGN with ergs cm-2 s-1. These include radio flux densities, mostly upper limits. We used survival analysis to derive a k-corrected mean value (where the radio flux density is in Jy and the X-ray flux is in c.g.s. units). Radio-loud AGN, which we define as sources with W Hz-1 and make up of the sample, were excluded. The radio-quiet AGN in our complete sample, defined as done in § 4.1, have . Both of these values are heavily influenced by selection effects. X-ray selection will tend to favor sources with relatively small radio-to-X-ray flux ratios, while the opposite will be true for radio selection. The truth, as always, will be somewhere in the middle and actually quite far from the two extremes. We then take as our best guess for the radio-to-X-ray flux ratio for radio-quiet AGN the mean of the two values, that is , being fully aware that this will only give an order of magnitude estimate. We note that this value is the same as that obtained from the sample of Brinkmann et al. (2000) by converting their 2 keV powers to the keV band assuming . Establishing why this is so, given the fact that the Brinkmann et al. (2000) sample was derived from a cross-correlation between ROSAT All-Sky Survey and 1.4 GHz FIRST data, is beyond the scope of this paper. We just remark that this validates the usage of this value as typical in the literature (e.g., Simpson et al., 2006; Polletta et al., 2007). Radio number counts for radio-quiet AGN were then obtained by using the hard X-ray counts and the value derived above converted to keV by assuming (i.e., ).
The agreement between observed and expected number counts for the various sub-classes and for the whole sample in Fig. 7 is very good, especially given the many orders of magnitude difference between our flux density limit and those of the samples from which the luminosity functions were derived. Even the radio-quiet AGN counts show a very good agreement with our observational estimates. We point out that the inclusion of a distribution in radio-to-X-ray flux ratio would ”stretch” those counts conserving the total number, with the result that the drop at lower flux densities would be somewhat mitigated.
4.4. Heavily absorbed AGN: the meaning of
Radio selection gives us the chance of identifing obscured AGN which might escape X-ray detection (see, e.g., Donley et al., 2005). One might think that, since their optical flux is heavily absorbed, such sources will have quite large radio-to-optical flux density ratios. Indeed, it has been suggested that the occurrence of such large ratios in micro-Jy sources is indicative of a high degree of extinction (e.g., Norris et al., 2005). Radio-quiet, obscured AGN (the so-called ”type 2” AGN), would then appear to have values very large for their radio power and should stick out in a - radio power plot. To test this hypothesis we plot in Fig. 8 mean and values for broad-lined AGN, both radio-quiet and radio-loud, Seyfert 2s, and star forming and radio galaxies. The data come from the AGN catalogue of Padovani, Giommi & Fiore (1997). Given the redshift distribution of our sample (§ 2.2) and to compare sources within a similar redshift range, we have restricted our selection to . Individual data from the same catalogue333For consistency with our sources the optical magnitudes used in the evaluation of the radio-to-optical flux density ratio refer, as much as possible, to the total, and not the nuclear, magnitude. for of the Compton-thick sources from the compilation of Comastri (2004) are also shown. In such sources, defined as having hydrogen column values cm-2, nuclear radiation is only visible above keV for cm-2, the so-called ”mildly Compton thick” sources, while for larger column densities the entire high-energy X-ray spectrum is absorbed. Compton-thick sources are expected to be heavily absorbed in the optical band as well, and indeed of them are classified as Seyfert 2s/QSO 2s or radio galaxies.
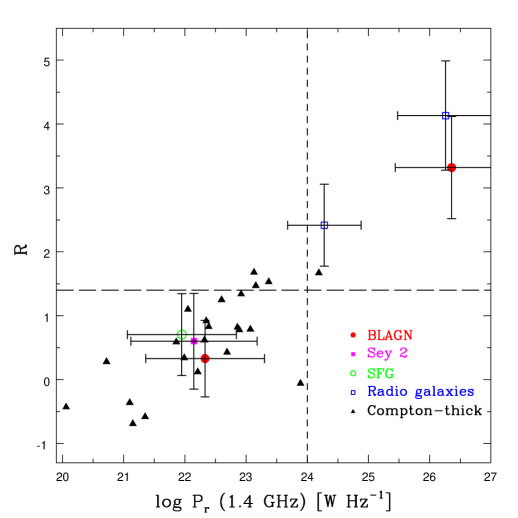
An important result is apparent from Fig. 8: X-ray and optically absorbed sources fall on the same relation as optically unabsorbed ones. In other words, a large value of the radio-to-optical flux density ratio does not indicate a high degree of extinction but, rather, a large radio power. A similar story is told by the Compton-thick sources, which fall on the same relation as the other sources (see also Fig. 3). This can be explained by the fact that there is a limit to how faint the optical flux will be, since once the central AGN is completely obscured the host galaxy will contribute all of the flux. Radio-quiet, broad-lined AGN have values only slightly smaller than Seyfert 2s because, given also the redshift cut-off, they are mostly nearby and therefore with a strong galaxy component. Radio-quiet quasars at all redshifts, which have a stronger AGN-related optical component, have and , that is below the locus of the other sources.
We notice that two sources in Fig. 3 (top-left quadrant) appear to be off the main relation by having values larger than expected for their radio powers. These are at low redshift ( and 0.18). One of them has been studied by Tozzi et al. (2006) (ID 97 in their Table 1), who derived and . The other one is a much weaker X-ray source with an X-ray hardness ratio, defined as , where and are the net counts in the hard and soft band respectively, . This implies cm-2. In both cases, then, there is no strong indications of absorption. Both sources have very faint optical magnitudes for their redshifts, clearly off the locus of the majority of our sources, which explains their high . This suggests that they might be somewhat peculiar.
Based on all of the above, it appears that radio and optical data cannot identify heavily absorbed sources, which might have escaped X-ray detection. This can be investigated further using Spitzer data.
5. Discussion
By using a variety of multi-wavelength information for 256 radio sources in the CDFS area, we have shed light on the long standing problem of the nature of sub-mJy radio sources. We find that SFG make up of such sources. We believe our results are quite robust, since whenever we made some assumptions, we chose those which would maximize the number of SFG. AGN make up the remaining fraction () of radio sources with 1.4 GHz flux densities mJy. The observational evidence, backed up by model calculations and an extrapolation from the hard X-ray band, strongly supports the suggestion that AGN are roughly equally split into radio-loud, mostly low-power radio galaxies, and radio-quiet sources.
The population mix appears to be flux density dependent, with SFG becoming increasingly relevant at lower flux densities until they become the dominant component below mJy, and AGN exhibiting the opposite trend. This seems to be driven by the fall of radio-loud sources, as radio-quiet ones display relatively flat counts (within the rather large errors). SFG do appear to be responsible for most of the well-known up-turn in the counts, with radio-quiet AGN providing only a relatively small () contribution.
The availability of optical morphology and X-ray information (including upper limits) for and all of the sources in the complete sample respectively have been fundamental to classify our sources. X-ray data, in particular, have been vital to eliminate AGN contaminants from spirals and irregulars and to classify sources without morphological information. We have obviated the presence of many X-ray upper limits by using them conservatively and thereby providing robust upper limits to the fraction of SFG. Deeper X-ray data should allow us to better define the fraction of SFG.
As mentioned in the Introduction, our results differ somewhat with the many papers, which over the years have suggested a large dominance of SFG at sub-mJy levels. Many of these results were based on only a small fraction of spectroscopic identifications of the optically brightest objects. Gruppioni et al. (1999) and Ciliegi et al. (2003) have pointed out that, when identifying spectroscopically fainter objects, early-type galaxies constitute the majority. This is easily explained: if we cut our sample at , for example, we would be sampling a region of parameter space typical of SFG, with , , , and (see Figs. 1, 3, and 4). We would then wrongly infer that the sub-mJy population does not include the large number of AGN, which become accessible only when probing fainter magnitudes.
Our results are in broad agreement with a number of recent papers. For example, Ciliegi et al. (2003) have obtained a deep 5 GHz VLA image of the Lockman hole. The analysis of their 63 radio sources, which reach Jy, using a color-color diagram and a radio flux density - optical magnitude plot, suggests that AGN are still the dominant population at their flux density levels.
Smolčić et al. (2008) have applied a new method to disentangle star forming from AGN galaxies using 1.4 GHz radio sources in the VLA-COSMOS survey. This relies on a correlation between optical rest-frame colors of emission-line galaxies and their position in a spectroscopic diagnostic diagram based on emission line flux ratios. They deduce that the radio population in the flux density range Jy mJy is a mixture of SFG, AGN galaxies, and QSO, where the latter are defined as optical point sources. Their method works only up to and therefore beyond that value their results are less secure.
Seymour et al. (2008) have used a variety of (mostly) radio-based diagnostics, including radio morphology, spectral indices, radio to near-IR and mid-IR flux density ratios, to discriminate on a statistical basis AGN from SFG in a deep VLA/MERLIN survey of the XMM-Newton/Chandra Deep Field, which includes 449 sources. They find a dominance of SFG at the faintest flux densities (Jy at 1.4 GHz), with AGN still making up around one quarter of the counts. They also find that the relative contribution of the two classes is flux density dependent, with SFG becoming the more numerous population below mJy.
It is important to note that our selection criteria, by being not only radio-based, provide information on the overall nature of our sources, unlike, for example, those of Seymour et al. (2008) (see also Richards et al., 2007), which separate radio sources into those whose radio emission is AGN and star formation dominated.
Regarding radio-quiet AGN, Jarvis & Rawlings (2004) modeled the radio counts with a population of radio-quiet AGN becoming the dominant component below 1 mJy. We do not confirm this prediction. Simpson et al. (2006), on the other hand, suggested that of radio sources in the mJy range were radio-quiet AGN and that these sources could be more important than SFG for the up-turn in the counts. While our results are consistent with the first point, they are not with the second one.
We notice that radio-quiet AGN counts appear to be similar in shape to those of SFG, scaled down by a factor (see Fig. 7), and quite different from those of the whole AGN population, which includes basically only radio-loud sources above 1 mJy. This argues against radio-quiet AGN being simply the faint end of a continuum of radio powers and should provide relevant information for the solution of the puzzle of the origin of their radio emission.
6. Summary and Conclusions
We have used a deep radio sample, which includes 256 objects down to a 1.4 GHz flux density of Jy selected in the Chandra Deep Field South area, to study the nature of sub-mJy sources. Our unique set of ancillary data, which includes reliable optical/near-IR identifications, optical morphological classification, redshift information, and X-ray detections or upper limits for a large fraction of our sources, has allowed us to shed new light on this long standing astrophysical problem. By analyzing the ratio of radio to optical luminosity and the radio and X-ray powers of the sources with morphological and redshift information, we have selected candidate star-forming galaxies and AGN from a complete sample of 194 objects. As the first two parameters by themselves are not very good discriminants between star-forming galaxies and AGN, optical morphology and especially X-ray data turned out to be vital in establishing the nature of faint radio sources. We have also complemented our data analysis with model calculations based on brighter samples and counts in other bands. Our main results can be summarized as follows:
-
1.
The well-known flattening of the radio number counts below mJy is mostly due to star-forming galaxies, which are missing above mJy but become the dominant population below mJy.
-
2.
AGN exhibit the opposite behavior, as their counts drop at lower flux densities, going from 100% of the total at mJy down to at the survey limit. This is driven by the fall of radio-loud sources, as radio-quiet objects, which make up of sub-mJy sources, display relatively flat counts.
-
3.
Radio-quiet AGN make up about half of all AGN. Their counts appear to be a scaled down version, by a factor , of those of star-forming galaxies, and are very different from those of the radio-loud AGN population. This should provide a clue to the origin of their radio emission.
-
4.
Star-forming galaxies make up of sub-mJy sources down to the flux limit of this survey. This has to be regarded as a robust upper limit, as whenever we had to make some assumptions, we chose to maximize their numbers. This result is at variance with the many papers, which over the years have suggested a much larger dominance of these sources. On the other hand, our results are in broad agreement with a number of recent papers, which found a significant AGN component down to Jy.
-
5.
The results of our model calculations agree quite well with the observed number counts and provide supporting evidence for the scenario described above. Moreover, they imply that sub-mJy radio-loud AGN are dominated by low-power, Fanaroff-Riley type I radio galaxies, as their high-power counterparts and radio-loud quasars are expected to disappear below mJy.
-
6.
We find a correlation between X-ray and radio power for star-forming galaxies, in agreement with most previous studies.
-
7.
Despite some previous claims, we find that the ratio of radio to optical luminosity depends more on radio luminosity, rather than being due to optical absorption, and is therefore not related to a high degree of extinction.
Considering the apparent emerging population of low luminosity AGN at microjansky levels, care is needed when interpreting radio source counts in terms of the evolution of the star formation rate in the Universe.
We plan to expand on this work by using our deeper (Jy per beam over the whole Extended CDFS region) radio observations (Miller et al., 2008) and the recently released 2 Msec Chandra data (Luo et al., 2008).
References
- Afonso et al. (2005) Afonso, J., Georgakakis, A., Almeida, C., Hopkins, A. M., Cram, L. E., Mobasher, B., & Sullivan, M. 2005, ApJ, 624, 135
- Afonso et al. (2006) Afonso, J., Mobasher, B., Koekemoer, A., Norris, R. P., & Cram, L. 2006, AJ, 131, 1216
- Balmaverde & Capetti (2006) Balmaverde, B., & Capetti, A. 2006, A&A, 447, 97
- Barger et al. (2007) Barger, A. J., Cowie, L. L., & Wang, W.-H., 2007, ApJ, 654, 764
- Best et al. (2005) Best, P. N., Kauffmann, G., Heckman, T. M., & Ivezić, Ž. 2005, MNRAS, 362, 9
- Brinkmann et al. (2000) Brinkmann, W., Laurent-Muehleisen, S. A., Voges, W., Siebert, J., Becker, R. H., Brotherton, M. S., White, R. L., & Gregg, M. D. 2000, A&A, 356, 445
- Ciliegi et al. (2003) Ciliegi, P., Zamorani, G., Hasinger, G., Lehmann, I., Szokoly, G., & Wilson, G. 2003, A&A, 398, 901
- Coleman et al. (1980) Coleman, G. D., Wu, C.-C., & Weedman, D. W. 1980, ApJS, 43, 393
- Comastri (2004) Comastri, A. 2004, ASSL Vol. 308: Supermassive Black Holes in the Distant Universe, 245
- Comastri & Brusa (2008) Comastri, A., & Brusa, M. 2008, Astronomische Nachrichten, 329, 122
- Donley et al. (2005) Donley, J. L., Rieke, G. H., Rigby, J. R., & Pérez-González, P. G. 2005, ApJ, 634, 169
- Fanaroff & Riley (1974) Fanaroff, B. L., & Riley, J. M. 1974, MNRAS, 167, 31p
- Feigelson & Nelson (1985) Feigelson, E. D., & Nelson, P. I. 1985, ApJ, 293, 192
- Fomalont et al. (2002) Fomalont, E. B., Kellermann, K. I., Partridge, R. B., Windhorst, R. A., & Richards, E. A. 2002, AJ, 123, 2402
- Gehrels (1986) Gehrels, N. 1986, ApJ, 303, 336
- Giacconi et al. (2002) Giacconi, R., et al. 2002, ApJS, 139, 369
- Giavalisco et al. (2004) Giavalisco, M., et al. 2004, ApJ, 600, L93
- Gilli et al. (2007) Gilli, R., Comastri, A., & Hasinger, G. 2007, A&A, 463, 79
- Gruppioni et al. (1999) Gruppioni, C., Mignoli, M., & Zamorani, G. 1999, MNRAS, 304, 199
- Gruppioni et al. (2003) Gruppioni, C., Pozzi, F., Zamorani, G., Ciliegi, P., Lari, C., Calabrese, E., La Franca, F., & Matute, I. 2003, MNRAS, 341, L1
- Hopkins (2004) Hopkins, A. M. 2004, ApJ, 615, 209
- Huynh et al. (2005) Huynh, M. T., Jackson, C. A., Norris, R. P., & Prandoni, I. 2005, AJ, 130, 1373
- Isobe et al. (1986) Isobe, T., Feigelson, E. D., & Nelson, P. I. 1986, ApJ, 306, 490
- Jarvis & Rawlings (2004) Jarvis, M. J., & Rawlings, S. 2004, New Astronomy Review, 48, 1173
- Kellermann et al. (1989) Kellermann, K. I., Sramek, R., Schmidt, M., Shaffer, D. B., & Green, R. 1989, AJ, 98, 1195
- Kellermann et al. (2008) Kellermann, K. I., Fomalont, E. B., Mainieri, V., Padovani, P., Rosati, P., Shaver, P., Tozzi, P., & Miller, N. 2008, ApJS, 179, 71 (Paper I)
- Lavalley et al. (1992) Lavalley, M., Isobe, T., & Feigelson, E. 1992, ASP Conf. Ser. 25: Astronomical Data Analysis Software and Systems I, 25, 245
- Ledlow & Owen (1996) Ledlow, M. J., & Owen, F. N. 1996, AJ, 112, 9
- Le Fèvre et al. (2005) Le Fèvre, O., et al. 2005, A&A, 439, 845
- Lehmer et al. (2005) Lehmer, B. D., et al. 2005, ApJS, 161, 21
- Luo et al. (2008) Luo, B., et al. 2008, ApJS, 179, 19
- Machalski & Condon (1999) Machalski, J., & Condon, J. J. 1999, ApJS, 123, 41
- Mainieri et al. (2008) Mainieri, V., et al. 2008, ApJS, 179, 95 (Paper II)
- Miller et al. (2008) Miller, N. A., Fomalont, E. B., Kellermann, K. I., Mainieri, V., Norman, C., Padovani, P., Rosati, P., & Tozzi, P. 2008, ApJS, 179, 114
- Norris et al. (2005) Norris, R. P., et al. 2005, AJ, 130, 1358
- Norris et al. (2006) Norris, R. P., et al. 2006, AJ, 132, 2409
- Norris et al. (2008) Norris, R. P., Middelberg, E., & Boyle, B. J. 2008, in From Planets to Dark Energy: the Modern Radio Universe, to appear in the proceedings (arXiv:0804.3998)
- Owen & White (1991) Owen, F. N., & White, R. A. 1991, MNRAS, 249, 164
- Padovani (1993) Padovani, P. 1993, MNRAS, 263, 461
- Padovani, Giommi & Fiore (1997) Padovani, P., Giommi, P., & Fiore, F. 1997, in From the Micro- to the Mega-Parsec, ed. A. Comastri, T. Venturi, & M. Bellazzini, Mem. Soc. Astron. Italiana, 68, 147
- Padovani et al. (2007a) Padovani, P., Giommi, P., Landt, H., & Perlman, E. S. 2007, ApJ, 662, 182
- Padovani et al. (2007b) Padovani, P., Mainieri, V., Tozzi, P., Kellermann, K. I., Fomalont, E. B., Miller, N., Rosati, P., & Shaver, P. 2007, in ASP Conf. Ser. 380, At the Edge of the Universe, ed. J. Afonso, H. C. Ferguson, B. Mobasher, & R. Norris (San Francisco: ASP), 205
- Padovani & Urry (1992) Padovani, P., & Urry, C. M. 1992, ApJ, 387, 449
- Philips et al. (1986) Phillips, M. M., Jenkins, C. R., Dopita, M. A., Sadler, E. M., & Binette, L. 1986, AJ, 91, 1062
- Polletta et al. (2007) Polletta, M., et al. 2007, ApJ, 663, 81
- Ranalli, Comastri & Setti (2003) Ranalli, P., Comastri, A., & Setti, G. 2003, A&A, 399, 39
- Richards et al. (1998) Richards, E. A., et al. 1998, AJ, 116, 1039
- Richards et al. (2007) Richards, A. M. S., et al. 2007, A&A, 472, 805
- Rix et al. (2004) Rix, H.-W., et al. 2004, ApJS, 152, 163
- Rosati et al. (2002) Rosati, P., et al. 2002, ApJ, 566, 667
- Sadler et al. (1989) Sadler, E. M., Jenkins, C. R., & Kotanyi, C. G. 1989, MNRAS, 240, 591
- Sadler et al. (2002) Sadler, E. M., et al. 2002, MNRAS, 329, 227
- Salvati et al. (2008) Salvati, M., Risaliti, G., Véron, P., & Woltjer, L. 2008, A&A, 478, 121
- Seymour et al. (2008) Seymour, N., et al. 2008, MNRAS, 386, 1695
- Simpson et al. (2006) Simpson, C., et al. 2006, MNRAS, 372, 741
- Smolčić et al. (2008) Smolčić, V., et al. 2008, ApJS, 177, 14
- Stocke et al. (1992) Stocke, J. T., Morris, S. L., Weymann, R. J., & Foltz, C. B. 1992, ApJ, 396, 487
- Szokoly et al. (2004) Szokoly, G. P., et al. 2004, ApJS, 155, 271
- Tozzi et al. (2006) Tozzi, P., et al. 2006, A&A, 451, 457
- Tozzi et al. (2008) Tozzi, P., et al. 2008, ApJ, submitted (Paper III)
- Urry & Padovani (1995) Urry, C. M., & Padovani, P. 1995, PASP, 107, 803
- Vanzella et al. (2005) Vanzella, E., et al. 2005, A&A, 434, 53
- Vega et al. (2008) Vega, O., Clemens, M. S., Bressan, A., Granato, G. L., Silva, L., Panuzzo, P. 2008, A&A, 484, 631
- Windhorst et al. (1995) Windhorst, R. A., et al. 1995, Nature, 375, 471
- Wolf et al. (2004) Wolf, C., et al. 2004, A&A, 421, 913