6th International Conference on Photo-Excited Processes and Applications
9-12 Sep 2008, Sapporo, Japan, http://www.icpepa6.com
the contributed paper will be published in Applied Surface Science (2009)
Two-temperature relaxation and melting after absorption of femtosecond laser pulse
Abstract
The theory and experiments concerned with the electron-ion thermal relaxation and melting of overheated crystal lattice constitute the subject of this paper. The physical model includes two-temperature equation of state, many-body interatomic potential, the electron-ion energy exchange, electron thermal conductivity, and optical properties of solid, liquid, and two phase solid-liquid mixture. Two-temperature hydrodynamics and molecular dynamics codes are used. An experimental setup with pump-probe technique is used to follow evolution of an irradiated target with a short time step 100 fs between the probe femtosecond laser pulses. Accuracy of measurements of reflection coefficient and phase of reflected probe light are 1% and , respectively. It is found that, firstly, the electron-electron collisions make a minor contribution to a light absorbtion in solid Al at moderate intensities; secondly, the phase shift of a reflected probe results from heating of ion subsystem and kinetics of melting of Al crystal during where is time delay between the pump and probe pulses measured from the maximum of the pump; thirdly the optical response of Au to a pump shows a marked contrast to that of Al on account of excitation of d-electrons.
keywords:
femtosecond laser ablation , pump-probe , optics of hot Al and AuPACS:
52.38.Mf, 52.25.Os, 02.70.Ns1 Supersonic heating and melting
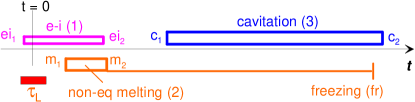
Figures 1,2 show diagrams of processes in pump femtosecond laser pulse (fsLP) action on metal. The three time slices ”ei”, and in Fig. 1 correspond to the following non-equilibrium processes: (e-i) the electron-ion thermal relaxation, (m) the melting of an overheated crystal lattice, and (c) the cavitation decay of a metastable state. Duration of fsLP is shorter than characteristic times of these three processes. They have very various time scales from subpicoseconds to nanoseconds. The electron overheating starts from when a fsLP arrives [1, 2, 3, 4, 5, 6, 7, 8, 9] and disappears at when temperatures equilibrate for Al at our intensities). The time is reckoned from the maximum of pump fsLP in Fig. 1. Since arriving of the pump to a target the conductivity electrons become much hotter than the ions.
Two-temperature (2T) matter with hot electrons transits to a peculiar state with thermodynamic and optical characteristics different from one-temperature (1T) case. In 2T there are appearance of excesses of electron energy and pressure above equilibrium 1T ones. Also there are changes in elastic moduli and band structure. In semiconductor lattice the binding forces become weaker with increase of while in metals situation is opposite. Large changes in optics of Au at high result from excitation of d-electrons. On account of the ion heat capacity (thermal ”inertia” of a lattice) the beginning of melting is delayed relative to the instant where and are the melting temperature and e-i energy exchange rate.
It has been known that:
(i) for metals and semiconductors the fluences near the ablation threshold are significantly higher than the melting threshold [10]. In this sense the Lennard-Jones (LJ) case is an exception [10]. LJ vacancy migration to cohesion energy ratio and triple to critical temperature ratio are large in comparison with metals and semiconductors. While is approximately the same for all three groups. Therefore it is not suprising that in the LJ case In metals for the molten layer is approximately as thick as heated When stretching stress overcome material strength a cavitation (fragmentation of liquid) begins inside molten metal at the instant shown in Fig. 1. In LJ near threshold spallation (fragmentation of solid) starts in deformed crystal [9]. Above threshold the LJ spallation transforms to cavitation as molten LJ layer becomes thicker and the fragmentation zone transits from solid to molten LJ.
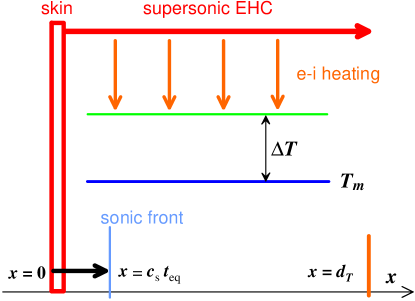
(ii) the electronic heat conduction wave ”EHC” in Fig. 2 is supersonic within the 2T slice ”ei” shown in Fig. 1 [5, 7].
These facts (i,ii) result in the isochoric heating and stress confinement [2, 6]. Estimates of the EHC speed are: is a thermal diffusivity, is a mean free path, is a collision frequency, is the Fermi velocity. Therefore the Mach number of EHC wave is high up to a few picosecond. Within the time period the ”EHC” creates a heated layer thick in Al and thick in Au [2, 3, 5, 6, 7, 9].
The is much thicker than acoustic penetration depth at as illustrated in Fig. 2. As a result of (i) and (ii) there is a volume non-equilibrium melting in the slice [2] with formation of overheated solid grains surrounded by melt. At the slice in Fig. 1 the heat wave velocity becomes much lower than – and then the well-defined melting/recrystallization front is formed [2, 6, 11]. At the melt layer covering a residue [12] of the target is completely solidified.
2 2T hydrodynamics and light reflection
In Lagrangian variables the 2T hydrodynamics (2T-HD) equations [5, 6, 7, 13, 14, 15, 16, 17] are
for kinematics and mass conservation,
| (1) |
for a force balance, and two thermal equations
| (2) | |||||
| (3) |
describing instant local electron and ion heat balances, where is an Eulerian coordinate defined in Fig. 2, is the trajectory of material particle with Lagrangian coordinate which is equal to before the action of a pump fsLP. In 2T-HD simulation the pump intensity is and is the initial material density: (Al) and 19.3 (Au), are pressure and density, is a coefficient of a thermal heat conduction. where is the thickness of the skin-layer shown in Fig. 2 as ”skin”. Unknowns are functions of the Lagrangian variables When knowing the trajectories , the variables can be presented as the functions of the Eulerian coordinates are the internal electron and ion energies, is the absorbed power, is the e-i energy exchange term.
From the profiles as functions of , obtained from the Eqs.(1-3), one can find the corresponding profiles of the dielectric permittivity and the complex index of refraction where is a volume fraction of liquid phase discussed below for case of solid-melt mixture. Next, for the -profile at fixed time (velocity of light is taken to be infinite), Helmholtz equation
| (4) |
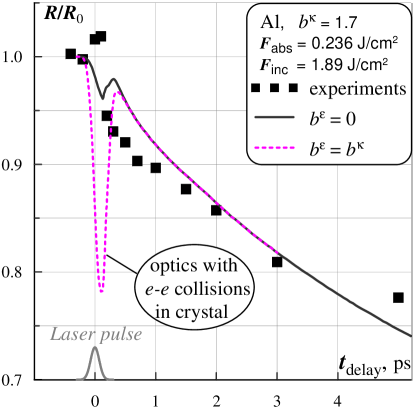
is solved for amplitude of the probe fsLP perpendicular to a target. Equation (4) describes a reflection of the probe light from target. Its solution gives the amplitude and phase of the reflected wave and correspondingly the time evolution of the reflectivity and phase They are compared with the experimental dependencies in Figs.3,4. By contrast, the pump absorption is taken from the experiment [5]. Equation (4) is evaluated by the transfer matrices method [19]. In our experiments the chromium-forsterite laser with the pump and probe (first and second harmonics) is used [5, 17]. A fsLP duration is Values have been measured by microinterferometric technique described in [5, 7, 17, 20].
3 2T thermodynamics, collisions, and thermal transport
The values and in (1-3) are taken as in [5] from the wide range equation of state [21] and from Fermi model for the conduction electrons, is the total pressure. The coupling factor and the heat capacity are taken from [8]. According to the Drude formula the electron heat conductivity in (2) is
| (5) |
is Fermi energy. At when electron degeneracy is significant the collision frequency is (”deg” stands for degenerate),
| (6) |
The factor in (6) approximates the quantum-mechanical molecular dynamic (MD) data [22] showing the drop of the electrical conductivity of Al with the density decrease in the temperature range under consideration. The electron-electron collision frequency is
| (7) |
The Coulomb collisions in (5) is taken as They dominate at very high and limit (5) at by an atomic frequency (saturation of the increases with increasing
The electron-ion collisions in (5,6) is calculated separately for solid and liquid Al
| (8) | ||||
| (9) |
where in K. The coefficients in (9) approximate the quantum-mechanical MD heat conduction of the molten 1T Al [23]. The thermal conductivity is calculated with Kubo-Greenwood formula up to [23]. Values for from (5,6,8) and for electric conductivity with (8) describe well 1T reference data for solid Al between the Debye and triple point temperatures.
4 Optical properties: collisions and interband excitations
The value necessary for (4) is a sum of the Drude and the interband terms [4, 17, 24, 25]
| (10) |
where
in Al In an Al crystal results mainly from the transitions between parallel zones [18]. This term dominates at room temperatures. Its contribution increases the absorption more than by order of magnitude in comparison with pure Drude absorption. In a molten Al disappears [25]. Electron density of states (DOS) in Al is stable against melting [26] and against increase as was checked up to in [27]. Therefore the ion charge and the electron effective mass defining weakly depend on melting and overheating of electrons. A phenomenological dependence of (10) on a total frequency (5,6) has been proposed [18, 4]. At large the term becomes small as compared to the Drude term as it is in liquid.
5 Optics of mixtures
MD simulations show that in Al within the early - few ps) stage the solid-liquid mixture fragmentation space scale is small in comparison with Therefore the can be defined by a volume fraction of liquid in mixture: For the weak mixtures or we have [28]
| (11) |
An approximate interpolation for intermediate of these linear in solutions (11) is
| (12) |
Expressions (11,12) have been used in calculations shown in Figs. 3 and 4. At an early stage it is necessary to consider optics of a solid-liquid mixture given by these expressions because at this stage the thickness of a solid-liquid mixture layer is comparable with the thickness of a skin-layer – a penetration depth of a probe photon.
Values [25] differ moderately. In this case there is another approximation [28]
nonlinear in but linear in small difference Comparison of this approximation with (11,12) shows that results differ small: the maximum deviation achieved at is for Re and less than 3% for Im As was said at early stage optics of solid-liquid mixture is significant. Let us mention that as it will be shown below at this stage there is non-equilibrium melting of an overheated crystal. At intermediate and late stage shown in Fig. 1 existence of vapor-liquid mixture can influence optical reflection if thickness of cavitation layer [5, 7, 14] is less or comparable with The cavitation layer covers the undersurface vapor-liquid layer against probe photons.
6 Role of in optics of aluminum
In an early stage the is high – then the (7) dominates in the total frequency (5) as maximum for our fluences are smaller than 10 kK and the collisions are less frequent. There are different coefficients and for the (7) in expressions for (5) and for optics – in the Drude and in the interband terms (10). In crystals the includes normal and Umklapp processes while the in the solid Al may differ from zero as a result of the Umklapp effect (situation is different for gold, see below). In liquid Al the coefficient – the e-e collisions do not contribute into optical absorption as the Umklapp is impossible. In Al a Fermi sphere is larger than in Au while the Brillouin zones are approximately equal (the lattice constants are for Al and Au both). Therefore the Umklapp effect is more significant in Al. E.g., it results in order of magnitude increase of the electron-ion energy exchange rate [29]. Value of in (7) is a subject of discussions. Below the Debye temperature the tends to zero strongly and becomes less than the Then specific electrical resistance for very pure crystals is The measurements [30] give Here we suppose that does not depend on frequency of electromagnetic field and the coefficient in (7) for resistance is equal to At the same time the theory [30] gives For high the calculations [4] is accepted.
Estimate of the upper limit for follows from the check of the Wiedemann-Franz law done for melt Al in [23], where is Lorentz number. In Drude approximation we have because in melt umklapp is absent and (7) does not contribute to electric conductivity Relative deviation of the ratio from in [23] is less than 10%. This means that electrons in Al remain degenerate up to temperature achieved in [23]. The limit impose restriction on value It is obtained from where expressions (7) and (9) was used. On the other hand, the value is important at early stage because it influences heat propagation into bulk when the propagation is supersonic. To achieve thickness at Al ablation threshold the values should be near this restriction The thickness is necessary to reproduce experimentally defined crater depth For smaller the simulated crater is deeper and fluence threshold is higher than the experimental ones.

Performed optical measurements shown in Figs. 3, 4 together with simulations give additional information about The interesting sharp narrow ”well” at the theoretical in Fig. 3 corresponds to Its minimum is achieved when and hence 7 have the largest amplitudes (at the end of the pump). This well might be very useful for diagnostics. The left wing of the well follows the history of electron heating while the right wing reflects the kinetics of melting because the gradual phase transformation from crystal state to melt in a skin-layer progressively suppresses optical contribution of the e-e collisions (7). Unfortunately the well is not observed. Density of experimental points at the time axis in Figs. 3, 4 is large enough to exclude missing of the well between the two successive points. The accuracy of experimental measurements of a relative reflection is sufficient to catch the well. Analysis of our simulation runs in a fluence range shows that it is necessary to have the below 0.2-0.5 to meet the measurements; for Al the calculated and measured thermomechanical ablation threshold is [5].
7 Melting and decrease of phase angle
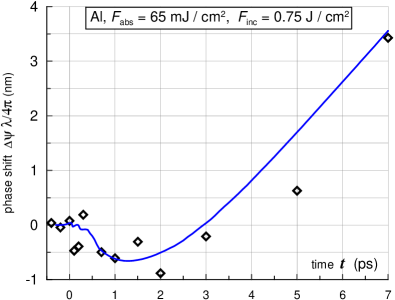
Simulations show that the phase evolution presented in Fig. 4 contains important information concerning the kinetics of melting. The base for this is the difference commented in Fig. 5 between the defined in Section 4 and As a result of attenuation of the band-band transition during melting the value becomes smaller. This is why the in Al is 2.2 nm differing from solid in the direction of the phase rotation to the crater. The value 2.2 nm corresponds to the case of a Fresnel reflection from homogeneous semispace. Remarkably that this small difference is measurable by the pump-probe interferometry. The sign of rotation directions in Fig. 5 defines the sign of the phase difference in Fig. 4. Detection of ultrafast melting of semiconductors [31] is possible due to the same liquid-solid phase difference But in this case the melting transforms semiconductor into a metallic state – therefore is significantly larger (e.g., for GaAs, – and this transformation can be detected easily.
The phase obtained from 2T-HD equations is compared with experimental data in Fig. 4. Expansion movement of reflecting boundary should increase but at the early time it decreases as a result of gradual melting of skin-layer. Agreement between data and theory indicates that theory given below properly describes the melting.
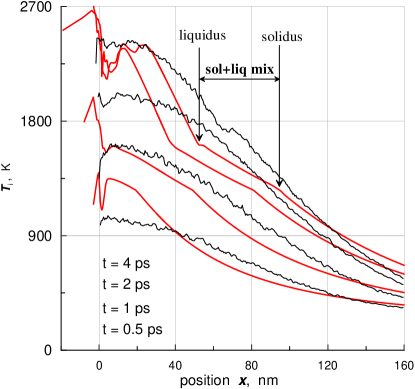
Figure 6 illustrates the heating of ions by hot electrons in 2T-HD model. In MD simulation atoms are heated by the space-time distributed thermostat power source with the temperature distribution taken from 2T-HD. This MD approach is similar to one developed in [2, 32], see also [6] where phenomenological terms describing non-equilibrium melting are added to 2T-HD equations. Particular mechanism of heating (heat flow from electrons or thermostat) has no action upon the kinetics of melting if we suppose that elastic moduli do not depend on as in the case of Al [27]. In Fig. 6 the 2T-HD and MD profiles are approximately the same. Some difference results from equilibrium and non-equilibrium description of melting. The arrows in Fig. 6 mark the slice of melting from equilibrium 2T-HD. The kinks at the ends of this slice result from hidden fusion energy. In MD the degradation of crystal symmetry during the fast heating and melting is distributed in wider range beyond the liquidus/solidus positions. Crystal beyond solidus is in overheated state [2, 32].
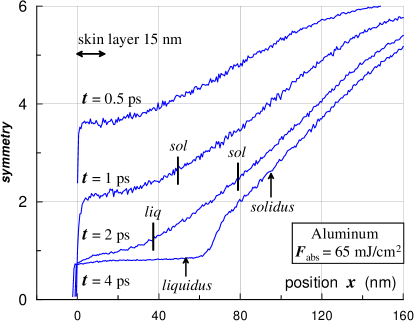
Phase transformation and propagation of melting into bulk is shown in Fig. 7. The profiles of the symmetry index are presented. The index is defined as a number of crystal axis passing through an atom and averaged over atoms within a x-slab, and in a cold fcc lattice. One can see how quickly the rather thick (thicker than layer of mixture is formed. Later the layer of pure melt (the plateau at the instant profile in Fig. 7) appears. Much later the narrow melting front with small overheating separating a melt from a crystal is formed. Maximum thickness of the molten layer for the fluence is
8 Gold optical response and d-electrons
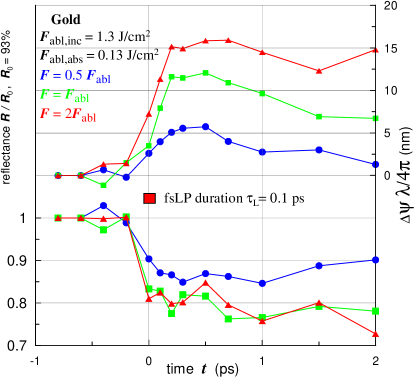
Absorption of pump fsLP causes sharp changes in optical properties at very early time – during the pulse They are shown in Fig. 8. Bulk gold targets are used. This response is caused by fast heating of electrons. If we compare Figs. 3,4 (Al) and Fig. 8 (Au) having similar relative temperatures at 2T stage and similar final temperatures after e-i relaxation we will see obvious large differences. They are related to the differences in the band structures of Al and Au [27]. Estimates of heating history from the maximum to e-i thermalization give for the main seven thermal parameters the values: (0.5, 0.7, 50, 1, 1.5, 1.2, 0.8 ), (1, 1.3, 140, 3, 2.5, 1.5, 2.5), (2, 2.9, 500, 10, 5, 2.4, 8) for the three cases shown in Figs.8,9, where is a thermomechanical ablation threshold, are electron thermal energy and temperature at the end of a pump, is number of electrons exited from the 5d to the 6s,6p band at the maximum is maximum ion temperature achieved after e-i relaxation. An expression for electron thermal energy at fixed density approximates data obtained from the ABINIT [33] simulations up to here is in MJ/kg, and in K. Our curve is above the standard parabola because we include exciting of the d-electrons. But it is below the curve [8] where a red-shift of the d-band with was not considered. Experimental and theoretical values for the depth of a crater at a threshold is 110 nm [7]. The first case with the smallest is near a melting threshold for bulk Au. Our three cases cover a range of energy densities obtained in [15, 34, 35, 36, 37] for ultrathin (25-30 nm) freestanding Au films. Here we consider bulk targets and use different technique of measurements.
The values of presented above have been defined using the ABINIT [33] code, the normalization condition for the number of electrons, and the expression for the amount of electrons in the 6sp band. The ABINIT has been used as in [27] for calculation of the dependent DOS at different supposing that density is equal to (isochoric heating). For given the DOS of the 5d band obtained from ABINIT has been approximated by a rectangular and the DOS of the 6s,6p band has been described as the function in order to calculate At a given a root of the normalization condition
| (13) |
where defines a chemical potential here are edges of the 5d band relative to the bottom point of the 6s,p bands. The first and the second terms correspond to the numbers of electrons in the 6s,p and 5d bands, resp. At room temperature these numbers are and 10. It is known that for Au difference between this approach and calculation of with exact DOS is small [38]. The exact function is obtained together with the DOS in the ABINIT simulation. The excitation degree is given by an expression where stands for the second term in (13) but now with known To estimate possible influence on the value of of position of the bottom point of the 6sp band this position was varied in the range relative to its position at
The values of and collision frequency are necessary for the Drude estimates of Growth of them is responsible for the rise of in Fig. 9. At room temperature is small: 1.2% from electrical and thermal conductivities or 3.3% from optical data [39], Heating of an electron subsystem in our conditions rises to large values: There are three candidates responsible for the growth of (i) an enhancement of in solid or liquid Au with in comparison with case, (ii) and Umklapps in crystal Au, and (iii) the e-e collisions between electrons from the d and the sp bands in solid or liquid Au. Let’s consider these cases.
(i) The frequency and the e-i exchange rate are coupled, [40], where is an energy transfer from a light electron to a heavy ion in one e-i collision, is an interatomic distance in condensed matter, is Debye temperature. Therefore If const as in Al [8, 29], then as usual. But in gold there is significant dependence on An approximation of calculation of with DOS from ABINIT [33] (including the shift of the d-band with is It is valid up to here is Fermi distribution [8]. The begins to grow at from and saturates at the value ten times larger [41]. This means that is enhanced if There is in 1T gold, in K. For we have If as in two cases shown in Figs.8,9 then the enhancement due to increase of gives large frequency
(ii) In Al is small, Sec.5. As was said, the Umklapp processes are weaker in Au as the result of smaller Fermi/Brillouin ratio. Therefore it seems plausible that this candidate is less important than two other candidates.
(iii) Electrons from d versus sp bands have different angular momentum and effective mass. Therefore photons are absorbed in collisions between them. Corresponding frequency is given by (7) with possible dependence The may be at
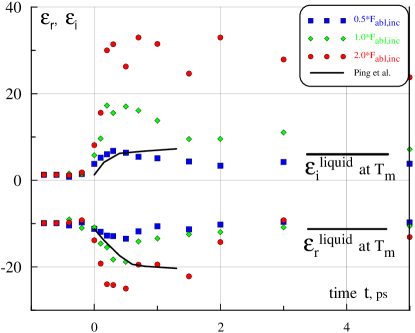
From imaginary and real parts of expression (10) we obtain and The mass at room temperatures [39] remains approximately the same with increase of This follows from our ABINIT simulations. According to [36] in 2T Au where is an absorption edge of the d-band. If we neglect the band-band term in (10), then (0.9; 0.5), (1.7; 0.9), (3.3; 1.3) at the maximum in the three cases shown in Fig. 9.
Our data shown in Fig. 9 agree with data from [36] in but give larger and have a maximum at the time dependence while the dependence from [36] saturates. Perhaps the last difference results from the conductive cooling absent in ultrathin films. Let’s mention that data [36] contain the useful dependence but may be less accurate at a particular frequency. (1.2; 0.4) for the maximum of the dependence from [36] shown in Fig. 9 as the solid curves. As a result of smaller these values are below than our values (1.7; 0.9) for the case with approximately the same energy Nevertheless there are appreciable excitation and frequent collisions. Therefore we can conclude that measurements confirm the theoretical findings presented above that a pump irradiation creates an excited population rising (10) and transfers gold into the state with strongly collisional widened energy levels.
The work is supported by the RFBR grant No. 07-02-00764.
References
- [1] S.I. Anisimov et al., Sov. Phys.-JETP 39 (1974) 375.
- [2] D.S. Ivanov, L.V. Zhigilei, Phys. Rev. B 68 (2003) 064114.
- [3] P. Lorazo, L.J. Lewis, M. Meunier, Phys. Rev. B 73 (2006) 134108.
- [4] D. Fisher, M. Fraenkel, Z. Henis et al., Phys. Rev. E 65 (2001) 016409.
- [5] S.I. Anisimov, N.A. Inogamov et al., Appl. Phys. A 92 (2008) 939.
- [6] A. Volkov, L. Zhigilei, J. Phys.: Conf. Ser. 59 (2007) 640.
- [7] N. Inogamov, V. Zhakhovskii, S. Ashitkov et al., JETP 107 (2008) 1.
- [8] Z. Lin, L. Zhigilei, V. Celli, Phys. Rev. B 77 (2008) 075133.
- [9] S. Anisimov, V. Zhakhovskii, N. Inogamov et al., JETP 103 (2006) 183.
- [10] Yu.V. Petrov et al., Proc. of SPIE 7005 (2008) 70051W-1; A.K. Upadhyay, N.A. Inogamov, B. Rethfeld et al., Phys. Rev. B 78 (2008) 045437.
- [11] W. Duff, L. Zhigilei, J. Phys.: Conf. Ser. 59 (2007) 413.
- [12] The cavitation or run-away layer is thermally weakly coupled with a future crater bottom and therefore may remains molten while the bottom becomes frozen. At the slice in Fig. 1 the cavitation layer is mechanically coupled with the bottom through the fragmentation or nucleation zone, [5, 7, 9], Agranat et al., Appl. Surf. Sci. 253 (2007) 6276.
- [13] S. Amoruso, R. Bruzzese, X. Wang et al., J. Phys. D 40 (2007) 331.
- [14] S.I. Anisimov, N.A. Inogamov et al., Appl. Phys. A 92 (2008) 797.
- [15] J. Colombier, P. Combis, E. Audouard et al., Phys. Rev. E 77 (2008) 036409.
- [16] F. Vidal, T.W. Johnston, S. Laville, O. Barthelemy, M. Chaker, et al., Phys. Rev. Lett. 86 (2001) 2573.
- [17] M.B. Agranat, N.E. Andreev, S.I. Ashitkov et al., JETP Lett. 85 (2007) 271.
- [18] N.W. Ashcroft, K. Sturm, Phys. Rev. B 3(6) (1971) 1898.
- [19] J. Bonse, K.-W. Brzezinka, A.J. Meixner, Appl. Surf. Sci. 221 (2004) 215.
- [20] V.Temnov, K.Sokolowski-Tinten et al.,J.Opt. Soc. Am. B 23 (2006) 1954.
- [21] A.V. Bushman, G.I. Kanel’, A.L. Ni, V.E. Fortov, Intense dynamic loading of condensed matter, Taylor & Francis Translation, 295 p., 1993.
- [22] M. Desjarlais, J. Kress, L. Collins, Phys. Rev. E, 66 (2002) 025401(R).
- [23] V. Recoules, J.-P. Crocombette, Phys. Rev. B 72 (2005) 104202.
- [24] E.D.Palik(ed.) Handbook Opt.Const.Solids. Academic Press, N.Y.,1998.
- [25] J.C. Miller, Philos. Magazine 20 (1969) 1115.
- [26] M. Alemany, L. Gallego, D. Gonzalez, Phys. Rev. B 70 (2004) 134206.
- [27] V.Recoules, J.Clerouin, G.Zerah et al., Phys.Rev.Lett. 96 (2006) 055503.
- [28] L.D. Landau, E.M. Lifshitz, Electrodynamics of continuous media, Pergamon Press, Oxford etc., 1984.
- [29] Yu.V. Petrov, Laser Particle Beams 23 (2005) 283.
- [30] M. Kaveh, N. Wiser, Adv. Phys. 33(4) (1984) 257.
- [31] K.Sokolowski-Tinten, J.Bialkowski et al.,Phys.Rev. B 58 (1998) R11805.
- [32] Z. Lin, L.V. Zhigilei, J. Phys.: Conf. Ser. 59 (2007) 11.
- [33] The ABINIT code is a common project of the Universite Catholique de Louvain, Corning Inc., and other contributors (http://www.abinit.org).
- [34] K. Widmann, T. Ao, M. Foord et al., Phys. Rev. Lett. 92 (2004) 125002.
- [35] S.Mazevet, J.Clerouin, V.Recoules et al.,Phys.Rev.Lett.95 (2005) 085002.
- [36] Y. Ping, D. Hanson, I. Koslow et al., Phys. Rev. Lett. 96 (2006) 255003.
- [37] T. Ao, Y. Ping, K. Widmann et al., Phys. Rev. Lett. 96 (2006) 055001.
- [38] Z. Lin, L.V. Zhigilei, Proc. of SPIE 6261 (2006) 62610U.
- [39] P.B. Johnson, R.W. Christy, Phys. Rev. B 6 (1972) 4370.
- [40] M.I. Kaganov,I.M. Lifshits,L.V. Tanatarov, Sov.Phys.-JETP 4(1957)173.
- [41] This value is only 1.5 times smaller than the (at low May be this explains why the and the crater depth at the ablation threshold differ only twice in Au versus Al. The saturation is