Polarization dependence of semiconductor exciton and biexciton contributions to phase-resolved optical two-dimensional Fourier-transform spectra
Abstract
We study the coherent light-matter interactions associated with excitons, biexcitons and many-body effects in GaAs quantum wells. For most polarization configurations the phase-resolved two-dimensional Fourier-transform (2DFT) spectra are dominated by excitonic features, where their strength and dispersive lineshapes is due to many-body interactions. Cross-linear excitation suppresses many-body interactions, changing the lineshape and strength of the 2DFT features.
pacs:
78.47.Fg, 78.47.nj, 78.67.DeThe coherent response of excitons in semiconductor quantum wells (QWs) is strongly dependent on the excitation conditions and material properties, such as polarization configuration and inhomogeneous broadening (due to well-width fluctuations). Contributions to the light-matter interactions include the excitons themselves, the formation of excitonic “molecules,” or biexcitons, and the many-body interactions of these states. (See for example, the recent reviews CundiffOpEx, ; Axt1, and references therein.) The interplay of these contributions has been explored though intensity- and polarization-dependent transient four-wave mixing (TFWM) studies.Cundiff1 ; Yaffe ; Bennhardt ; Saiki ; Kim ; Schmitt-Rink ; Patkar ; Robart ; Bott ; Wang ; Hu ; Smirl ; Shacklette ; Mayer ; Schafer ; Adachi ; Nickolaus ; Langbein The latter result in changes of the dephasing time,Cundiff1 ; Yaffe ; Bennhardt ; Saiki the temporal profile of the emission,Cundiff1 ; Bennhardt ; Kim and a phase shift of the beats.Bennhardt ; Schmitt-Rink Some experiments have also characterized the Stokes parameters of the emission with detailed polarimetry.Patkar ; Robart Explanations of these results vary and include inhomogeneityCundiff1 ; Bennhardt or exciton-exciton interactions,Kim ; Bott such as exciton-exciton exchange,Bennhardt ; Robart excitation-induced dephasing (EID),Patkar ; Wang ; Hu ; Smirl local-field corrections,Patkar ; Hu and excitation-induced shift (EIS).Shacklette Many authors have attributed the polarization dependence to biexcitons and their subsequent interactions.Yaffe ; Saiki ; Mayer ; Schafer ; Adachi ; Nickolaus ; Langbein
TFWM measurements have not resulted in a completely satisfactory explanation of the polarization-dependent coherent response, because of ambiguities associated with competing processes in the coherent response. Additional information has been gained by recording the time evolution of the emission.Cundiff1 ; Schneider However, great enhancements are obtained by explicitly tracking the evolving phase of the TFWM signal using either a coherent-control schemeBreunig ; Voss or two-dimensional Fourier-transform (2DFT) spectroscopy.Li ; Langbein2 ; Zhang2 The latter results in a two-dimensional spectrum from the Fourier-transform of the phase evolution of the signal along two time dimensions, and has separated the population from coupling contributions,Li ; Langbein2 confirmed EID and EIS,Li and shown that agreement with theory requires the inclusion of terms beyond the Hartree-Fock approximation.Zhang2
In this paper, 2DFT spectroscopy is used to separate and isolate the competing intraactions and interactions of the excitons and biexcitons, which are strongly polarization dependent. Through a quantitative comparison of the magnitude of 2DFT data and the lineshape in the phase-resolved spectra, the selection rules are exploited to demonstrate the suppression of either many-body or biexcitonic effects in the coherent response. Clear indication of the associated contributions are observed in the 2DFT spectra, whereas they had only previously been inferred in TFWM experiments. Many-body interactions are observed for most excitation conditions as strong population and coherent coupling peaks, and as dispersive lineshapes in the real part of the 2DFT spectra. When many-body interactions are suppressed however, the exciton and biexciton contributions are similar in strength and the off-diagonal coupling peaks nearly vanish.
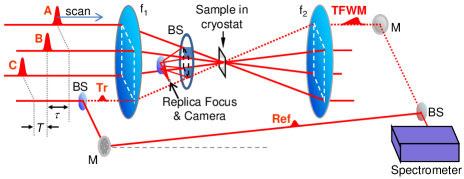
A schematic diagram of the experimental setup is shown in Fig. 1. Experiments are performed in the box geometry with a mode-locked Ti:sapphire laser as the source. Pulses are 200 fs and centered around 800 nm. Pulses are split into four identical copies within a stabilized set of cascaded, phase-stabilized and folded interferometers. The TFWM signal is heterodyne detected with a phase-stabilized reference pulse that is routed around the sample. The signal and reference are collinearly recombined and recorded using spectral interferometry. In this geometry there are three time periods, between the first and second pulse, between the second and third pulse and between the third pulse and the TFWM emission. SI(,,) 2DFT spectra are the Fourier transform projections of the first and third time periods and , measured with the phase-matching condition . Both the TFWM and 2DFT data are acquired by scanning pulse A as indicated in Fig. 1. These spectra are known as “rephasing” because dephasing due inhomogeneous broadening is cancelled, which results in a photon echo. Phase-matching conditions and correspond to different time ordering of the pulses. These techniques isolate the one- and two-photon “non-rephasing” (non-echo like) coherent contributions, which are not discussed in this paper.
2DFT experiments require sub-cycle phase-tracking and stabilization. However, experimentally introduced phase shifts mix the real and imaginary parts of the complex spectrum in the as-measured data. The “global phase,” associated with the nonlinear polarization in the sample, has previously been determined by comparison of the phase-resolved TFWM to the spectrally resolved transient absorption (SRTA).Jonas For cross-polarized excitation however, no corresponding configuration of the SRTA exists. In this experiment the global phase is determined by an in situ all-optical method,Bristow2 which involves: a) measuring the relative phases of the pump (,,) and tracer (Tr) pulses through spatial interference patterns at a replica focus shown in Fig. 1; b) capturing the spectral phase of the TFWM signal, measured with the heterodyne reference pulse (ref); and c) acquisition of the spectral phase of the Tr pulse, also measured with the Ref pulse by spectral interferometry.
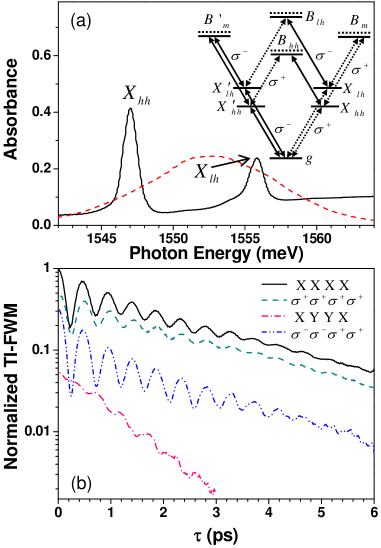
The epitaxially grown sample consists of a four period GaAs multiple-QW with Al0.3Ga0.7As barriers, where both wells and barriers are 10 nm thick. The substrate has been removed and all measurements are performed in transmission at approximately 7 K. Linear absorbance is shown in Fig. 2(a). The peaks correspond to the heavy-hole and light-hole excitons. Excitations may also include pure ( and ), as well as mixed () biexciton states, as indicated by the level scheme in the top right corner of Fig. 2(a).
Figure 2(b) shows the three-pulse time-integrated TFWM signal, where fs and the excitation density is cm-2 per layer. The laser is tuned between the excitons, as indicated by the red dashed line in Fig. 2(a) All nonlinear data are measured in the regime. Transients are shown for co-linear (XXXX), co-circular (), cross-linear (XYYX) and cross-circular () polarized excitation. This notation corresponds to the polarization state of the three pump pulses (, and ) and the emission, from left to right. The transients are normalized to the maximum of the XXXX polarized data (at fs). The frequency of the observed beats is related to the splitting between and . For all polarizations, except XYYX, the dephasing rates are similar. For XYYX the signal is much weaker, the dephasing is more rapid and the beats are in anti-phase compared to the other polarization (due to the circular selection rules).Schmitt-Rink For direct comparison to the rephasing 2DFT spectra the transients are shown for positive only.
The amplitude and real part of the rephasing 2DFT spectra are shown in Fig. 3, for the same four co- and cross-polarizations as above. The phase-resolved spectra for co-polarized excitations have been presented previously.Zhang2 Here they are shown for comparison with improved resolution with the real parts of the cross-polarized spectra. The excitation density, laser tuning and time are the same as those used in the TFWM data. The emission frequency is used to determine the arithmetic sign of the frequencies, thus the axis is negative because the first pulse is conjugated. All spectra are normalized to the strongest peak, namely the Xhh peak in the amplitude spectrum for XXXX configuration. Because the signal amplitudes vary for the different polarization configurations, each spectrum has an individual scale on its colorbar. To aid the quantitative comparison dots are added to the amplitude XXXX-polarized colorbar: the four dots represent the relative strength of the peak for XXXX (black dot), (blue dot), (red dot) and XYYX (green dot) polarizations, respectively from top to bottom. The 2DFT spectra show similar contributions, as labelled in the top left panel, including: two diagonal features associated with and ; two off-diagonal coupling peaks ( and ); and in some cases axial peaks corresponding to a third-order coherence through the biexciton state (most prominently ). Diagonal elongation of the some peaks is a sign of inhomogeneity and is unchanged by polarization. For the the ratio of inhomogeneous to homogeneous broadening is approximately 3.5:1, and less for the .
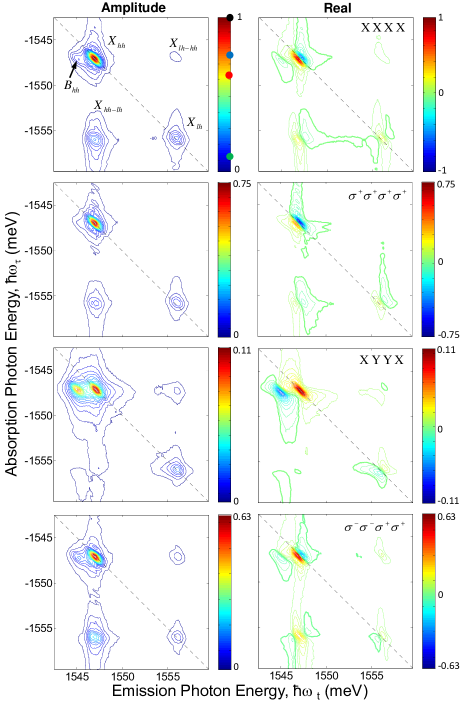
The first (top) row of Fig. 3 shows the co-linear polarized 2DFT spectrum, where the dominant peak is the . A weak axial peak is observed to be about 10% of the , displaced towards the axis. The real part of the spectrum shows dispersive lineshapes resulting from EIS.Li Additionally, the feature is a negative dip sitting on the shoulder of the . This negative dip occurs because the polarization associated with the to transition has the opposite sign to that for the to transition. Theory has shown that the strength of the is enhanced and its lineshape is dispersive due to many-body interactions.Zhang2 ; Yang
The second row of Fig. 3 shows the co-circular polarized 2DFT spectrum, where the strength of the peak and its dispersive lineshape indicate the continued dominance of many-body interactions. This spectrum is weaker than for XXXX excitation (approximately 75%), because some perturbative pathways are switched off.Yang Pure biexcitons are spin-forbidden, thus the feature is absent from the spectrum. Mixed biexcitons features are allowed and expected as axial peaks adjacent to the and cross peaks. The lack of mixed biexcitonic features suggest that they have weaker oscillator strengths than the contribution. In addition, the off-diagonal peak strengths are weaker and more asymmetric than for XXXX, which is consistent with the reduced beats in the co-circular TFWM data in Fig. 2(b). Modelling this spectrum has been addressed previously,Kuznetsova where it was found that experiments can only be reproduced by including Coulomb correlations beyond the Hartree-Fock approximation.Zhang2
Row three of Fig. 3 shows the cross-linear polarized 2DFT spectrum. The dominant features are the , , and peaks, where the biexcitons is a negative dip in the real spectrum. The spectrum is significantly weaker than the others presented (approximately 13% that of XXXX excitation), and the real part exhibits an absorptive lineshape for the feature. This change in lineshape indicates a suppression of many-body interactions, although the lineshape remains dispersive. Many-body interactions are suppressed for cross-polarized excitation because there is no spatial modulation of the net population and the excitation induced scattering processes are supposedly spin independent. Thus, and have comparable strengths and the spectrum is described well by the perturbative pathways determined from the level scheme.Yang Additionally, the off-diagonal features have almost vanished, consistent with the reduced beating in Fig. 2(b).
Row four of Fig. 3 shows the 2DFT spectra for cross-circular polarized excitation. The peak is about 63% of its strength for co-linear excitation and has a dispersive lineshape in the real part, indicating many-body interactions. Compared to co-circular excitation both diagonal exciton features have reduced strength, which we attribute to the transfer of spectral weight to the and the off-diagonal features. The and coupling features are also more symmetric than for co-circular excitation. This is consistent with the cleanest beats in the TFWM data. We suspect that inter-exciton coupling increases because scattering between excitons with the same electron spin is allowed. This spin-dependent behavior is elucidated by the comparison of the 2DFT spectra.
The 2DFT spectra clarify the behavior of the transients in Fig. 2(b). Comparison between the two data types show: the overall strength of the transients matches well with the heights of the diagonal peaks of the 2DFT spectra; the relative strength of the oscillations in the transients agree with the strength of the off-diagonal peaks in the 2DFT spectra, indicating that the oscillations are quantum beats and not polarization beats. The lineshapes of the phase-resolved cross-linear 2DFT spectra clearly indicates a suppression of many-body interactions, which is less ambiguous than the phase-shifted beats and increased dephasing rate of the transient. 2DFT spectra isolate the various contributions of the TFWM, and therefore the importance of each contribution is determined by its relative strength and 2D lineshapes.
In summary, we have shown a set of phase-resolved 2DFT spectra for co- and cross-polarized excitation conditions, of which the latter were previously unattainable. The strength and lineshape of the cross-linear polarized excitation show suppression of many-body interactions. Since the same number of perturbative pathways contribute to co- and cross-linear excitation it is clear that many-body interactions dominate all other polarization configurations. For cross-linear polarization the reduced exciton strength is comparable to the biexciton, so they contribute equally to the coherent response. A comparison of the two circular-polarized spectra show a spin dependence of the off-diagonal coupling features. The strengths and lineshapes of these phase-resolved 2DFT spectra provide a clearer understanding into the nonlinear response from semiconductor QWs. Further analysis promises insight into open questions including the fast decay for cross-polarized excitation.
This work was supported by the National Science Foundation and the Chemical Sciences, Geosciences, and Biosciences Division Office of Basic Energy Sciences, U.S. Department of Energy.
References
- (1) S. T. Cundiff, Opt. Express 16, 4639 (2008).
- (2) V. M. Axt and T. Kuhn, Rep. Prog. Phys. 67, 433 (2004).
- (3) S. T. Cundiff, H. Wang and D. G. Steel, Phys. Rev. B 46, R7248 (1992).
- (4) H. H. Yaffe, Y. Prior, J. P. Haribison and L. T. Florez, J. Opt. Soc. Am. B 10, 578 (1993).
- (5) D. Bennhardt, P. Thomas, R. Eccleston, E. J. Mayer and J. Kuhl, Phys. Rev. B 47, 13485 (1993).
- (6) T. Saiki, M. Kuwata-Gonokami, T. Matsusue and H. Sakaki, Phys. Rev. B 49, 7817 (1994).
- (7) D.-S. Kim, J. Shah, T. C. Damen, W. Schäfer, F. Jahnke, S. Schmitt-Rink and K. Köhler, Phys. Rev. Lett. 69, 2725 (1992).
- (8) S. Schmitt-Rink, D. Bennhardt, V. Heuckeroth, P. Thomas, P. Haring, G. Maidorn, H. Bakker, K. Leo, D.-S. Kim, J. Shah, K. Köhler, Phys. Rev. B 46, 10460 (1992).
- (9) S. Patkar, A. E. Paul, W. Sha, J. A. Bolger and A. L. Smirl, Phys. Rev. B 51, 10789 (1995).
- (10) D. Robart, T. Amand, X. Marie, M. Brousseau, J. Barrau and G. Bacquet, J. Opt. Soc. Am. B 13, 1000 (1996).
- (11) K. Bott, O. Heller, D. Bennhardt, S. T. Cundiff, P. Thomas, E. J. Mayer, G. O. Smith, R. Eccleston, J. Kuhl and K. Ploog, Phys. Rev. B 48, 17418 (1993).
- (12) H. Wang, K. Ferrio, D. G. Steel, Y. Z. Hu, R. Binder, S. W. Koch, Phys. Rev. Lett. 71, 1261 (1993).
- (13) Y. Z. Hu, R. Binder, S. W. Koch, S. T. Cundiff, H. Wang and D. G. Steel, Phys. Rev. B 49, 14382 (1994).
- (14) A. L. Smirl, M. J. Stevens, X. Chen and O. Buccafusca, Phys. Rev. B 60, 8267 (1999).
- (15) J. M. Shacklette and S. T. Cundiff, Phys. Rev. B 66, 045309 (2002).
- (16) E. J. Mayer, G. O. Smith, V. Heuckeroth, J. Kuhl, K. Bott, A. Schulze, T. Meier, D. Bennhardt, S. W. Koch, P. Thomas, R. Hey and K. Ploog, Phys. Rev. B 50, 14730 (1994).
- (17) W. Schäfer, D. S. Kim, J. Shah, T. C. Damen, J. E. Cunningham, K. W. Goossen, L. N. Pfeiffer and K. Köhler, Phys. Rev. B 53, 16429 (1996).
- (18) S. Adachi, T. Miyashita, S. Takeyama, Y. Takagi, A. Tackeuchi and M. Nakayama, Phys. Rev. B 55, 1654 (1997).
- (19) H. Nickolaus and F. Henneberger, Phys. Rev. B 57, 8774 (1998).
- (20) W. Langbein and J. M. Hvam, Phys. Rev. B 61, 1692 (2000).
- (21) H. Schneider and K. Ploog, Phys. Rev. B 49, 17050 (1994).
- (22) H. G. Breunig, T. Voss, I. Rückmann, J. Gutowski, V. M. Axt and T. Kuhn, J. Opt. Soc. Am B 20, 1769 (2003).
- (23) T. Voss, I. Rückmann, J. Gutowski, V. M. Axt and T. Kuhn,Phys. Rev. B 73, 115311 (2006).
- (24) X. Li, T. Zhang, C. N. Borca, S. T. Cundiff, Phys. Rev. Lett. 96, 057406 (2006).
- (25) W. Langbein and B. Patton, J. Phys.: Condens. Matter 19, 295203 (2007).
- (26) T. Zhang, I. Kuznetsova, T. Meier, X. Li, R. P. Mirin, P. Thomas and S. T. Cundiff, Proc. Natl. Soc. USA, 104, 14227 (2007).
- (27) D. M. Jonas, Annu. Rev. Phys. Chem. 54, 425 (2003).
- (28) A. D. Bristow, D. Karaiskaj, X. Dai and S. T. Cundiff, Opt. Express 16, 18017 (2008).
- (29) L. Yang, I. V. Schweigert, S. T. Cundiff and S. Mukamel, Phys. Rev. B 75, 125302 (2007).
- (30) I. Kuznetsova, P. Thomas, T. Meier, T. Zhang, X. Li, R. P. Mirin and S. T. Cundiff, Sol. State Comm. 142, 154 (2007).