Overdensities of galaxies at in Deep Field-South
Abstract
We report the discovery of possible overdensities of galaxies at in Deep Field South (CDF-S). These overdensities are identified from a photometric redshift-selected sample, and the -selected sample. One overdensity is identified in the proximity of two active galactic nuclei and Lyman break galaxies at and at 7 significance level. The other overdensity is less significant. It is identified around six galaxies at 3 significance level. The line-of-sight velocity dispersions of these overdensities are found to be km s-1, comparable to the velocity dispersions of clusters of galaxies today. Through spectral energy distribution fitting, we find 15 massive galaxies with around the overdensity. The mass of the overdensity is found to be a few . Our result suggests that high-redshift overdense regions can be found in a supposedly blank field, and that the emergence of massive structures can be traced back to redshifts as high as .
Subject headings:
cosmology: observations - galaxies: clusters: general - galaxies: evolution - galaxies: high-redshift1. Introduction
In hierarchical galaxy formation, galaxy clusters grow through gravitational attraction of matter around high peaks, and they are predicted to be rare at high redshift. Therefore, constraining the number density of high-redshift clusters is an important method of testing hierarchical models (Evrard et al. 2002; Mantz et al. 2008).
Many previous studies have been carried out to search for evolved structures at high redshift. Radio galaxies and active galactic nuclei (AGNs) are considered to be signposts for high-redshift proto-clusters, and several studies have found proto-clusters at (Le Fevre et al., 1996; Kurk et al., 2000; Pentericci et al., 2000; Wold et al., 2003; Kajisawa et al., 2006; Kodama et al., 2007; Venemans et al., 2007). Overdense regions are also identified out to using galaxies selected with the Lyman break technique or narrowband imaging (e.g, Ouchi et al. 2005).
When identifying overdense regions, it is necessary to compare the overdensity with a control field which lacks notable high-redshift overdense regions. For such a purpose, many studies have used the Deep Field South (CDF-S) due to the wealth of the deep multiwavelength data over a moderately large field of view (Kajisawa et al., 2006; Kodama et al., 2007). However, a matter of concern is whether the CDF-S can really be considered as a field devoid of high-redshift overdense regions. There exist a fair number of high-redshift X-ray-detected AGNs in the CDF-S, which may harbor high-redshift clusters.
Motivated by this, we searched for signs of overdensity around two AGNs at and separated by in the CDF-S, and we report the discovery of possible overdense regions at in the CDF-S.
Throughout this Letter, we assume a cosmology with nonzero cosmological constant (Im et al. 1997), , and , consistent with the cosmology (Spergel et al., 2007). All magnitudes are given in the AB system.
2. Sample selection of high redshift galaxy
We used two galaxy samples to identify overdense areas at 3.6-3.7; a -selected sample, and galaxies selected with photometric redshifts.
2.1. Selection
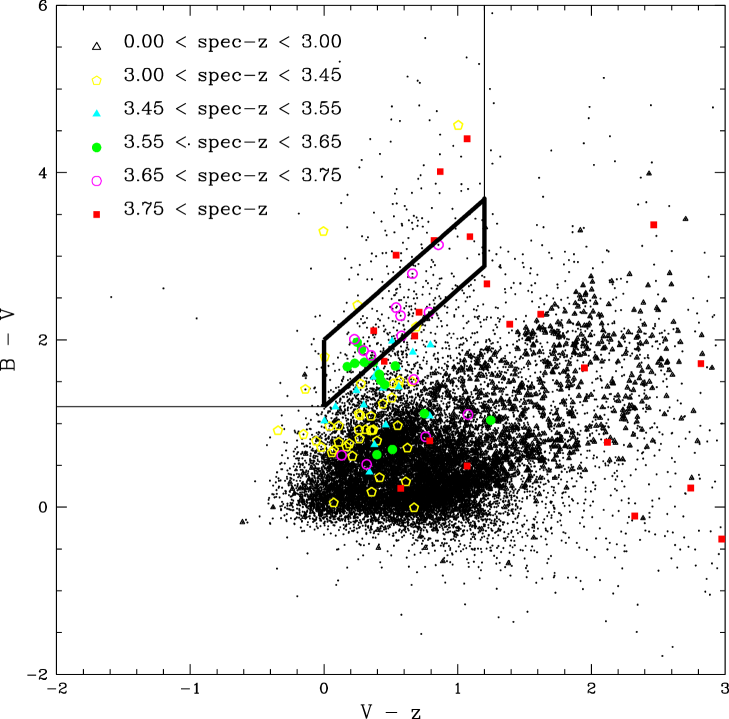
The Lyman break technique has proved to be an efficient method to select galaxies at high redshift from multicolor optical data (Steidel et al. 1996). For example, Giavalisco et al. (2004b) selected B-band dropouts at from GOODS data. However, since the -dropout selection contains galaxies over a broad redshift range, we defined a color space optimized to select galaxies at 3.6-3.7 using available spectroscopic redshifts including 17 at 3.6-3.7 (Vanzella et al. 2006, 2008; Popesso et al. 2008). Figure 1 shows our selection box, overlaid on galaxies in the CDF-S field. The figure demonstrates that our selection criteria effectively filter out objects at , and at . For example, there are 18 galaxies at , but only one of them makes it into the -selected sample. For the photometric data, we used the version r1.1 Advanced Camera for Surveys (ACS) multiband catalog of the GOODS team (Giavalisco et al. 2004a), and the magnitude cut of mag was chosen.
With this method, we selected 245 objects over the CDF-S area of 160 arcmin2 corresponding to a surface density of arcmin-2 (Poisson noise).
2.2. Photometric redshifts
The selection is biased for UV-bright galaxies. As a complementary sample, we also selected -band-limited ( mag), 3.6-3.7 galaxy candidates using photometric redshift.
We estimated the photometric redshifts of the
-band-limited objects using the Bayesian photometric redshift estimation
(BPZ; Benítez 2000).
The photometric data include
bands,
and IRAC photometry (Giavalisco et al. 2004a).
The Near-infrared (NIR) photometry was performed using the version 2.0 released images
in the -, -, and -bands of the ESO-GOODS team
(J. Retzlaff et al. 2008, in preparation).
The depth of the VLT/ISAAC data reaches at the 5
AB limits, and the simultaneous coverage in bands
is 160 arcmin2 after trimming the edges.
To create a catalog, we ran SExtractor (Bertin Arnouts 1996)
in double-image mode, using -band detections as a reference,
and performing photometry in the - and -bands at
the positions.
Auto-magnitudes were taken for the ,, and photometry.
The IRAC photometry catalog was kindly provided by R. Chary
(2008, private communication). In most cases,
we found IRAC detections for the -band selected objects.
To derive photometric redshifts, we used 742 spectral energy distribution (SED) templates with
a single burst, or a constant star-formation rate (SFR), or an
exponentially declining SFR in the form of SFR exp(t/) for
= 1, 2, 3, 5, 15, or 30Gyr.
These template SEDs were generated using a stellar population synthesis model
of Bruzual & Charlot (2003).
The metallicity was varied to be , , or ,
and we adopted the Salpeter initial mass function extending from 0.1 to
100 . The SED ages range from 100 Myr to 10 Gyr or
to the age of the universe at the corresponding redshift.
The reddening parameter was allowed to change from 0 to 1.8
according to the simple two-component model of Charlot & Fall (2000).
From the comparison of versus ,
we find that contamination from low-redshift interlopers is
minimal when selecting 3.6-3.7 objects,
at the redshift interval of .
When we restrict the redshift interval as above, the scatter in
the versus relation is about 0.1 after excluding
several clear outliers.
Therefore, we choose as the interval for
the photo- sample selection.
This gives 60 objects in total, including 17 spectroscopically confirmed
galaxies with good quality flags (B or better) at 3.6-3.7.
Note that we use instead of when available, but
restrict the spectroscopic redshift range to be .
With the photo- selection criteria, 73% of 3.6-3.7
galaxies are detected as 3.6-3.7 galaxy candidates.
The contamination rate is 26%, but the contamination due to low redshift objects
() is zero. Most of the contamination comes from
objects.


3. Results
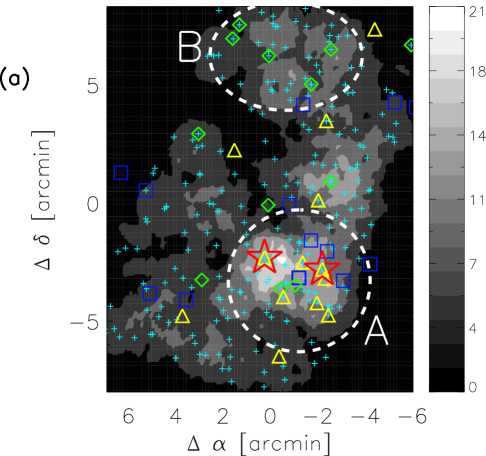
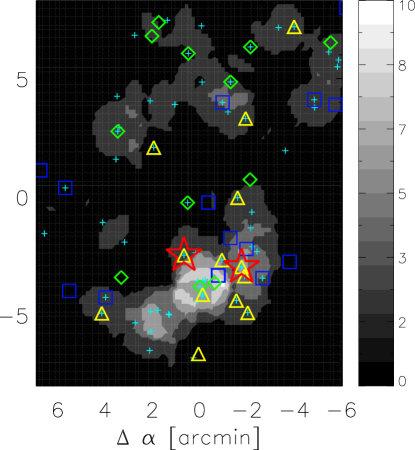
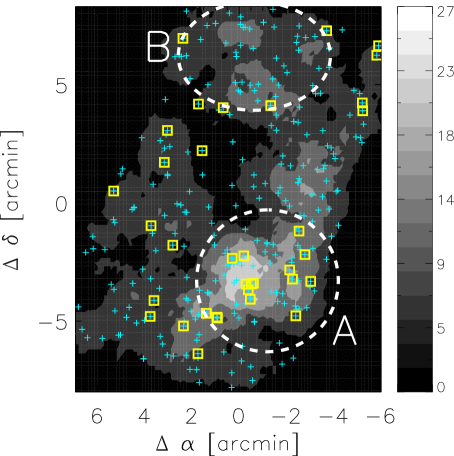
We searched for the overdensities by running circular top-hat filters with various diameters ( to , corresponding to 0.2-2 Mpc at ) on the two-dimensional spatial distribution of galaxies in the above samples. The number of objects was counted around a given point within a circle with a particular diameter, producing a density contour map. Figure 2(a) shows the surface number density contour map and the location of -selected sample and photo- selected objects, respectively. Here, the contours are created using diameter filters, which corresponds to 1.0 Mpc in physical size at . The 1 Mpc size is found to be the optimal size to identify the overdensity (see below). The spectroscopically confirmed galaxies are plotted with squares (), diamonds (), and triangles (), and the open stars represent AGNs at 3.66 and 3.70 from Szokoly et al. (2004). One density peak is apparent, located in the southern part of the CDF-S (A in Figure 2(a)), around , AGNs, and =3.70 Lyman break galaxies (LBGs, diamonds). Another possible peak exists in the north around 3.60 LBGs (B), but its significance is much weaker.
| sample | mean density | 1- | A (South) | B (North) |
|---|---|---|---|---|
| arcmin-2 | deviation | deviation | ||
| -selected sample | 1.48 | 0.64 | 4.94 | 2.52 |
| 0.37 | 0.27 | 6.86 | 1.96 | |
| Sum of two samples | 1.68 | 0.69 | 6.18 | 2.37 |
To quantify the statistical significance of these peaks, we measured the overdensity factor as a number of from the mean surface number density by performing a Gaussian fit over the surface number density histogram. The significances of the overdensities are summarized in Table 1. The significance of the overdensity is for the A overdensity, demonstrating that its significance is very strong. The significance of the overdensity does not change for the top-hat filter size between 0.75 and 1.3 Mpc. Beyond these sizes, the significance decreases. On the other hand, the B overdensity has a significance of only .
With the limited number of spectroscopic redshifts, assigning redshifts of the overdense regions is not an easy task. Nevertheless, we find several redshifts to be plausible. The redshift distribution of CDF-S galaxies with shows three distinct peaks at , , and (Figure 2(b)). The majority of objects are located around the overdense area A (filled histogram), as well as two AGNs at and , suggesting strongly that this overdensity is at . There are also several galaxies near the A overdensity. However, the overdensity is more likely to be at , since the overdense area is clearly identified in the contour map of the sample which effectively filters out galaxies.
Around the weak, overdense region B, we find six LBGs with , and find a one-dimensional velocity dispersion of km s-1 for these objects. The B overdense region may be a loosely bound overdensity at .
4. Discussion
4.1. Cosmic Variance
We examined whether the number of high-redshift candidates is abnormally high in this field compared to other fields. For this, we examined only the -selected sample, since the photo- sample does not have comparative samples readily available.
We studied the number density of -selected objects in the GOODS-North field to compare with the CDF-S. Using the version r1.1 ACS multiband source catalog, we find 220 -selected objects in the GOODS-North field (see Giavalisco et al. 2004b). This gives the surface density = 1.38 0.07 arcmin-2, comparable to the number in CDF-S ( arcmin-2).
We also looked for a sign of overdensity at using the -selected sample in the GOODS-North field. We find the strongest overdensity has the overdensity significance of . This suggests that the GOODS-North may contain a weak overdense area at , but its significance is much lower than the overdense region we identified in the CDF-S.
4.2. Stellar Population
In order to find massive galaxies associated with the overdense regions, we performed SED fittings to 60 galaxies in the photo- sample following the procedure of Shim et al. (2007), with the SED templates used for the photometric redshift determination. Note that we have limited the SED fitting to objects with IRAC data in order to reduce uncertainties and degeneracies arising from using only the rest-frame optical data.
In Figure 3, we show the best-fit SEDs of two representative massive galaxies at the overdense region A in the CDF-S. We find 35 galaxies with over the whole CDF-S area. More than 43% (15) of these massive objects are located within 1 Mpc radius of the overdensity peak of the A region. This offers a further support for the existence of overdensity.
We also checked the usefulness of the color selection of as advocated by Brammer & van Dokkum (2007). They suggest that objects with mag are likely to be at based on their photometric redshift analysis. However, our analysis shows that only about 30% of objects are at , for both the and the samples. Therefore, we conclude that the usefulness of the selection method is limited.
4.3. Overdensity Mass
We estimate the overdensity mass in several different ways for the A area.
First, we assume that it is a virialized structure, following Biviano et al. (2006). This assumption is not plausible, considering that the age of the universe is only 1.6 Gyr at , while it takes nearly several Gyr for galaxies to cross the 1 Mpc structure at the given velocity dispersion. Nevertheless, the method can place a useful upper limit on the overdensity mass. For the cluster size, we use the harmonic mean radius of the photo- selected objects within a 1 Mpc radius (twice the filter size that gives the maximal overdensity signal) from the overdensity center. This gives a size of 0.55 Mpc. Assuming that the one-dimensional velocity dispersion, , of several possible proto-cluster members with is a representative value, we estimate the cluster virial mass using the gapper estimator (Beers et al. 1990). We find that 800 km s-1 by excluding a small redshift peak at . The derived cluster virial mass is, then .
Next, we apply a procedure similar to that of Venemans et al. (2005) on the -selected sample. Suppose that the cluster is roughly spherical, and has a 0.55 Mpc radius equivalent to the harmonic mean radius as derived above. Using the range as the selection window, we find an overdensity factor of . Adopting the bias parameter of of B-dropouts in the CDF-S (Lee et al. 2006), we obtain a cluster mass of .
Finally, we add up the stellar mass of the member candidates within the 0.55 Mpc radius, and convert it to the total mass assuming a -to- ratio of 0.026 - 0.056 of early-type galaxies (Jiang & Kochanek 2007). Here, the overdensity mass can be expressed as , where and are, respectively, the number and the average mass of galaxies with , and is the ratio of the mass of galaxies with to those with . In our case, we have and . We adopt , which is the ratio of the luminosity density of galaxies to that of galaxies in the Schechter function with faint-end slope -1.24 (e.g, Rines & Geller 2008). This gives an overdensity mass of (2.1-4.6)
It is interesting that several independent mass estimates give the overdensity mass to be a few . The implausible assumption of the virialization even gives a mass consistent with other estimates. This suggests that the virialization of the proto-cluster may soon be completed. However, the expected number density of halos as massive as a few at is extremely low with Mpc-3 (Park & Kim, 2007; Reed et al., 2007), and the probability of finding such a halo in the CDF-S is only . This structure can be a part of the filaments and walls at high redshift as well. The existence of another weak overdense area such as the B overdensity supports such an idea. A careful analysis of simulation data should help us understand the nature of these kinds of overdensities.
5. Conclusions
By examining the two-dimensional distribution of candidates in the CDF-S field selected from the photometric redshift method or the color-color space, we find plausible associations of the overdense region of such objects with AGNs and LBGs at . The significance of the overdense regions is found to be . The overdense area is abundant with massive galaxies, adding further support that this is a proto-cluster. The derived mass of the proto-cluster is found to be a few . The existence of the massive proto-cluster in the CDF-S shows that one must be cautious when examining the significance of high redshift overdensities in other fields with respect to the CDF-S.
References
- Beers et al. (1990) Beers, T. C., Flynn, K., & Gebhardt, K. 1990, AJ, 100, 32
- Benítez (2000) Benítez, N. 2000, ApJ, 536, 571
- Bertin & Arnouts (1996) Bertin, E., & Arnouts, S. 1996, A&AS, 117, 393
- Biviano et al. (2006) Biviano, A., et al. 2006, A&A, 456, 23
- Brammer & van Dokkum (2007) Brammer, G. B., & van Dokkum, P. G. 2007, ApJ, 654, L107
- Bruzual & Charlot (2003) Bruzual, G., & Charlot, S. 2003, MNRAS, 344, 1000
- Chatlot & Fall (2000) Charlot, S., Fall, S. M., 2000, ApJ, 539, 718
- Evrard et al. (2002) Evrard, A. E., et al. 2002, ApJ, 573, 7
- Giavalisco et al. (2004a) Giavalisco, M., et al. 2004a, ApJ, 600, L93
- Giavalisco et al. (2004b) Giavalisco, M., et al. 2004b, ApJ, 600, L103
- Im et al. (1997) Im, M., Griffiths, R. E., & Ratnatunga, K. U. 1997, ApJ, 475, 457
- Jiang & Kochanek (2007) Jiang, G., & Kochanek, C. S. 2007, ApJ, 671, 1568
- Kajisawa et al. (2006) Kajisawa, M., et al. 2006, MNRAS, 371, 577
- Kodama et al. (2007) Kodama, T., et al. 2007, MNRAS, 377, 1717
- Kurk et al. (2000) Kurk, J. D., et al. 2000, A&A, 358, L1
- Lee et al. (2006) Lee, K.-S., Giavalisco, M., Gnedin, O. Y., Somerville, R. S., Ferguson, H. C., Dickinson, M., & Ouchi, M. 2006, ApJ, 642, 63
- Le Fevre et al. (1996) Le Fevre, O., Deltorn, J. M., Crampton, D., & Dickinson, M. 1996, ApJ, 471, L11
- Mantz et al. (2008) Mantz, A., Allen, S. W., Ebeling, H., & Rapetti, D. 2008, MNRAS, 387, 1179
- Ouchi et al. (2005) Ouchi, M., et al. 2005, ApJ, 620, L1
- Park & Kim (2007) Park, C., & Kim, J. 2007, in RevMexAA Conf. Ser. 28, ed. S. Kurtz, J. Franco, S. Hong, G. Garía-Segura, A. Santillán, J. Kim, & I. Han (Institudo de Astronomia, UNAM), 93
- Pentericci et al. (2000) Pentericci, L., et al. 2000, A&A, 361, L25
- Popesso et al. (2008) Popesso, P., et al. 2008, arXiv:0802.2930
- Reed et al. (2007) Reed, D. S., et al. 2007, MNRAS, 374, 2
- Rines & Geller (2008) Rines, K., & Geller, M. J. 2008, AJ, 135, 1837
- Shim et al. (2007) Shim, H., et al. 2007, ApJ, 669, 749
- Spergel et al. (2007) Spergel, D. N., et al. 2007, ApJS, 170, 377
- Steidel et al. (1996) Steidel, C. C., Giavalisco, M., Dickinson, M., & Adelberger, K. L. 1996, AJ, 112, 352
- Szokoly et al. (2004) Szokoly, G. P., et al. 2004, ApJS, 155, 271
- Vanzella et al. (2006) Vanzella, E., et al. 2006, A&A, 454, 423
- Vanzella et al. (2008) Vanzella, E., et al. 2008, A&A, 478, 83
- Venemans et al. (2005) Venemans, B. P., et al. 2005, A&A, 431, 793
- Venemans et al. (2007) Venemans, B. P., et al. 2007, A&A, 461, 823
- Wold et al. (2003) Wold, M., et al. 2003, AJ, 126, 1776