Detection of the second eclipsing high mass X-ray binary in M 33
Abstract
Chandra data of the X-ray source [PMH2004] 47 were obtained in the ACIS Survey of M 33 (catalog ) (ChASeM33) in 2006. During one of the observations, the source varied from a high state to a low state and back, in two other observations it varied from a low state to respectively intermediate states. These transitions are interpreted as eclipse ingress and egresses of a compact object in a high mass X-ray binary system. The phase of mid eclipse is given by HJD 245 3997.4760.006, the eclipse half angle is . Adding XMM-Newton observations of [PMH2004] 47 in 2001 we determine the binary period to be 1.7324790.000027 d. This period is also consistent with ROSAT HRI observations of the source in 1994. No short term periodicity compatible with a rotation period of the compact object is detected. There are indications for a long term variability similar to that detected for Her X–1. During the high state the spectrum of the source is hard (power law spectrum with photon index 0.85) with an unabsorbed luminosity of 2 erg s-1 (0.2–4.5 keV). We identify as an optical counterpart a star with , . CFHT optical light curves for this star show an ellipsoidal variation with the same period as the X-ray light curve. The optical light curve together with the X-ray eclipse can be modeled by a compact object with a mass consistent with a neutron star or a black hole in a high mass X-ray binary. However, the hard power law X-ray spectrum favors a neutron star as the compact object in this second eclipsing X-ray binary in M 33 (catalog ). Assuming a neutron star with a canonical mass of 1.4 and the best fit companion temperature of 33000 K, a system inclination and a companion mass of 10.9 are implied.
1 Introduction
Only a few eclipsing X-ray binaries (XRBs) have been detected in the Milky Way and other nearby galaxies. However, eclipsing XRBs are very interesting sources as they provide (when X-ray and optical data are included) the most reliable detailed mass measurements for compact stellar remnants possible (with the exception of the few known radio pulsars in binaries, including double neutron stars, see e.g. Psaltis, 2006).
Of specific interest is the first eclipsing XRB in M 33 (catalog ), M 33 X7 (catalog ) (hereafter X7), which showed properties that were not known from XRBs in the Galaxy or the Magellanic Clouds. X7 was already detected as a variable by the Einstein observatory with a luminosity at maximum in excess of erg s-1 (Long et al., 1981; Markert & Rallis, 1983) and it stayed active in all following observations. Its variability was explained through the model of an eclipsing XRB with an orbital period of 3.45 d and an eclipse duration of 0.4 d based on ROSAT and ASCA data (Larson & Schulman, 1997; Dubus et al., 1999). With the help of the well-constrained Chandra position of X7, Pietsch et al. (2004a) identified a B0I to O7I star of 18.89 mag in as optical counterpart: this star shows the ellipsoidal light curve of a high mass XRB (HMXB) with the X7 binary period. They argued that the compact object in the system is a black hole based on the mass of the compact object derived from orbital parameters and the optical companion mass, the lack of pulsations, and analysis of the extracted X-ray spectrum. Those authors concluded that X7 would be the first eclipsing black hole HMXB.
The black hole nature of X7 was firmly established by Pietsch et al. (2006a) using observations of the Chandra Advanced CCD Imaging Spectrometer (ACIS) survey of M 33 (catalog ) (ChASeM33, see Plucinsky et al., 2008) which accumulated in seven ACIS-I pointing directions a total exposure of 200 ks each. During several of these pointings X7 was in the field of view. The ChASeM33 measurements of X7 resolved for the first time the eclipse ingress and egress as well as constrained the light curve of X7 for binary phases around eclipse. In addition, Pietsch et al. (2006a) identified X7 on archival HST WFPC2 images. Through detailed modeling of the optical light curve, the observed X-ray eclipse and improved parameters for the companion star, a lower mass limit for the compact object in the system of 9 (see also Shporer et al., 2007) has been obtained. The black hole mass was further constrained as 15.65 with the help of a radial velocity curve based on Gemini North spectra and careful modeling (Orosz et al., 2007). This – at the time – made X7 the stellar black hole with the highest mass that had been determined with high precision.
In this paper we report on the detection and optical identification of the second eclipsing XRB in M 33 (catalog ) within the ChASeM33 project. The source was already detected in the XMM-Newton survey of M 33 (catalog ) of Pietsch et al. (2004b, hereafter PMH2004) and is source no. 47 in their catalogue ([PMH2004] 47, hereafter PMH47). During the XMM-Newton observations it showed strong time variability and was classified as a transient XRB candidate by Misanovic et al. (2006). It was first reported in the M 33 (catalog ) ROSAT catalogue by Haberl & Pietsch (2001) as source 19. PMH47 is listed as no. 8 in the “first look” ChASeM33 catalogue (Plucinsky et al., 2008). In several ChASeM33 observations the source was detected far off axis with strong time variability which – in a preliminary analysis – could be explained as the signature of a 1.7 d eclipsing XRB (Pietsch et al., 2006b). A massive star from the Local Group survey catalogue of M 33 (catalog ) stars (Massey et al., 2006) could be identified as the optical counterpart of the X-ray source. In a re-analysis of the deep 3.6m Canada-France-Hawaii Telescope (CFHT) photometric survey images of M 33 (catalog ) (Hartman et al., 2006), the proposed optical companion showed the ellipsoidal light curve of a HMXB in M 33 (catalog ) (Shporer et al., 2006). A coherent analysis of the Chandra and XMM-Newton X-ray and optical data allows us to further constrain the system parameters. Our follow-up analysis of PMH47 in the ROSAT data also indicates time variability consistent with the Chandra and XMM-Newton ephemeris.
2 Observations and data analysis
The PMH47 area was covered by the ACIS CCDs during seven observations of the ChASeM33 project and during the archival observation with observation identification (ObsID) 1730. Table 1 summarizes these observations giving the ChASeM33 field in column 1, ObsID (2), observation start date (3), sum of good time intervals (“on-time”, 4), the ACIS chip covering PMH47 (5), the offset of the source from the pointing direction (6), and the PMH47 binary phase and cycle number during the observation (7, 8) using ephemeris that will be discussed in Sect. 6. In the last column (9), we comment on source brightness and observed binary features (see Sect. 4 and 6). The average brightness of PMH47 varied strongly between the ChASeM33 observations. However, the determination of accurate count rates and light curves turned out to be quite difficult because in all observations the source is positioned far off axis and therefore has a large extent due to broadening of the telescope point spread function (PSF) which may stretch over bad CCD columns (e.g. in ObsID 6377) or may partly fall outside the detector field of view (FoV) (6382, 6385, 6387, 7226, 7344). An extreme case is presented in ObsID 6383 where the position of the source falls outside the detector and only a small part of the PSF is recorded. In several of the observations, counts from PMH47 are rejected in standard level 2 event files when the source is moving across rejected columns due to satellite dithering. This effect can reduce the counts in 1000 s integration intervals by varying amounts and create spurious periods in timing analysis. Therefore, we created new level 2 event files for broadband time variability analysis that did not reject these columns. For better comparison we applied an approximate flux correction to account for the size of the extraction region relative to the PSF size and to convert to an equivalent on-axis source. For each observation, a ChaRT111http://cxc.harvard.edu/chart/ raytrace (Carter et al., 2003) was performed for a 1.5 keV on-axis point source for an input ray density of 1 mm-2, and the total number of resulting rays was evaluated. For each observation, another ChaRT run was performed for a 1.5 keV point source (ray density also 1 mm-2) at the appropriate off-axis position; this applies the mirror reflectivity and vignetting. The rays were projected to the detector using the CIAO tool psf_project_ray, which also applied an approximate detector quantum efficiency (QE). In many cases, the source is near the edge of the detector, or in one case, off the detector (although some of the large PSF at that position is still on the detector). To account for these exposure variations resulting from chip edges and spacecraft dither, we weighted “counts” images generated from the raytrace pseudo-event lists by a fractional exposure map. The fractional exposure map accounts for the fraction of the time a sky pixel is on the detector, and is obtained by constructing an “exposure map” in which the Chandra High Resolution Mirror Assembly (HRMA) effective area and detector QE are both set to unity. We extracted weighted counts from a region corresponding to the extraction region in the real observation to get the predicted number of counts within the extraction region used for the real data. This provides the predicted number of counts for the given source intensity. The normalization to an on-axis source is obtained by dividing the on-axis predicted counts by the extracted off-axis predicted counts. This factor was used to scale the observed fluxes to the values they would have had on-axis. For spectral fitting, PMH47 photons were extracted from CIAO v4.0 level 2 event files using the same area as for the time variability analysis, but with the bad columns excluded. Spectra were grouped in channels with at least 20 photons in the on-source spectra.
In the XMM-Newton EPIC M 33 (catalog ) raster project, the PMH47 area was covered in seven observations at different off-axis angles (typical ontime of 14 ks) spanning about three years. Table 2 summarizes these observations giving observation identification (ObsID) in column 1, observation start date (2), on-time (3), the offset of the source from the pointing direction (4), 0.2–4.5 keV luminosity (Col. 5, derived from Table 5 of Misanovic et al., 2006), and the PMH47 binary phase and cycle number during the observation (6, 7) using ephemeris that will be discussed in Sect. 6. In the last column (8), we comment on source brightness and observed binary features. The X-ray source was detected only during two observations in July 2001 which were separated by about 2.5 days. However, during an observation between these two, the source was not detected. For the XMM-Newton EPIC X-ray spectral analysis we used PN (single + double pixel events, PATTERN 0–4) and MOS (PATTERN 0–12) events disregarding bad CCD pixels and columns (FLAG 0). The EPIC spectra were simultaneously fit for the three instruments allowing for a constant normalization factor between the spectra. Spectra were grouped in channels with at least 30 photons in the on-source spectra.
In the ROSAT catalogue of M 33 (catalog ) (Haberl & Pietsch, 2001), the detection of PMH47 was reported in the HRI at a level of significance greater than 7 while in the PSPC it is only marginally detected at a level of significance of only 3. We reanalyzed the ROSAT HRI data of ObsIDs 600487h, 600488h and 600489h performed from July 27 to August 8, 1994, where PMH47 is in the FoV. After screening for high background, we combined data with continuous observation intervals that led to variable integration times of typically 1700 s (minimum 786 s, maximum 2514 s), depending on the duration of the scheduled observation and background.
The PMH47 field was covered by the CFHT variability survey of M 33 (catalog ) conducted in the , , and bands during 27 nights from 2003 August to 2005 January. For details of this survey and the data reduction procedure used see Hartman et al. (2006). To summarize the procedure, the standard CCD calibrations were applied to the images as part of the CFHT Queue Service Observing mode. We performed image subtraction photometry (Alard & Lupton, 1998; Alard, 2000) on these images to obtain differential flux light curves for the source and PSF fitting photometry on a stacked reference image using the DAOPHOT/ALLSTAR package (Stetson, 1987, 1992) to obtain the reference flux values. We then applied a scaling factor to the formal photometric uncertainties determined by requiring that per degree of freedom scatters about unity for non-variable stars spanning the full dynamic range of magnitudes.
For the data analysis we in addition used tools in the ESO-MIDAS v05SEPpl1.0, EXSAS v03OCT_EXP, CIAO v3.2 and v4.0, and HEAsoft v6.3 software packages as well as the imaging application DS9 v4.13 and the software package ACIS Extract (Broos et al., 2002).
3 Improved position
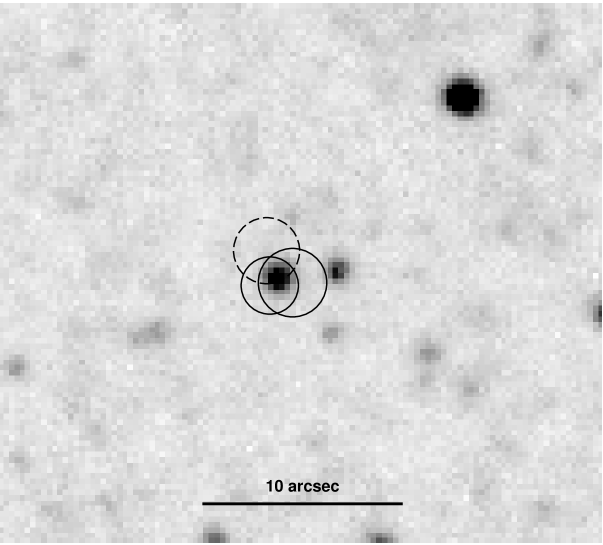
The best XMM-Newton position for PMH47 was derived as RAJ2000 = 01h32m3685, DecJ2000 = +30°32′285 with a 1 error of 0.57″ including systematics (Misanovic et al., 2006). In the ChASeM33 “first look” paper (Plucinsky et al., 2008) the position of PMH47 is given as RAJ2000 = 01h32m3695, DecJ2000 = +30°32′301 with a 1 statistical error of 0.48″. Assuming for PMH47 the same systematic error as for sources within 3′ from the aim point222see http://cxc.harvard.edu/cal/ASPECT/celmon/ a 99% error of 0.8″ has to be added. We obtained the most reliable source position for ObsID 6385, as the vast majority of the PSF was contained on the ACIS-I array in this observation and the source was bright during most of the integration. Our ACIS Extract analysis of this observation determined the mean position of the source counts within the 90% encircled energy PSF for the sources in the image, as well as the source position that provided the best match to a cross-correlation between the distribution of source counts and the PSF shape at this location on the ACIS-I array. These two position determinations were in very good agreement for X7 and PMH47, both of which were contained in this observation. We then determined the offset between the X7 position and its known optical counterpart in the Massey et al. (2006) catalogue. This offset we assume to be the systematic offset between the Chandra X-ray image and the Massey et al. (2006) catalogue images. The offset was +0.5″ in RA and +0.3″ in Dec, with an alignment error of 0.3″. After making this correction, the final position and error determined for PMH47 in ObsID 6385 was RAJ2000 = 01h32m3694, DecJ2000 = +30°32′284 with a 1 statistical error of 0.37″ corresponding to a 1 total error of 0.48″. In Fig. 4 we show the improved position together with the XMM-Newton position (Misanovic et al., 2006) and that from the ChASeM33 “first look” paper overlaid on an optical image of the Local Group Survey (Massey et al., 2006).
4 X-ray time variability
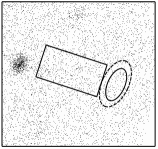
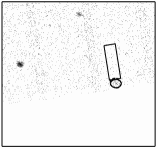
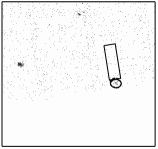
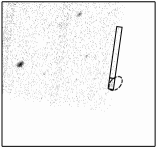
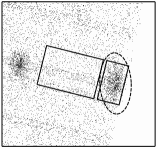
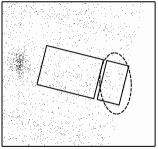
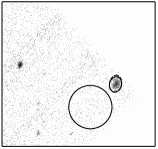
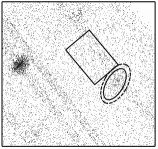
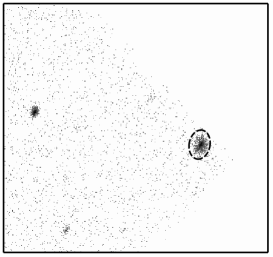
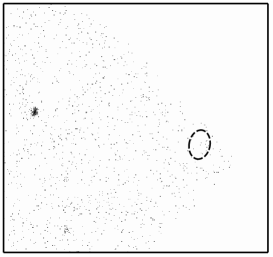
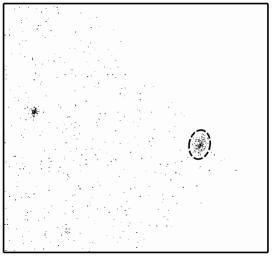
For the ChASeM33 data, we sampled background and solar system barycentre corrected light curves of PMH47 with a time resolution from 1000 s to 5000 s depending on the brightness of the source in the observation. To increase the signal to noise in the far off-axis observations, we restricted the analysis to the 0.5–5 keV band which covers most of the source flux (see Fig. 1). In addition we indicated in the images to the right of the light curves the extraction regions for source and background. Rectangular regions were used in some cases to get similar background structure in source and background regions. The dashed ellipses show the HRMA PSF 90% enclosed counts fraction. For observations far off axis, we used extraction areas smaller than 90% PSF to improve the signal to noise ratio (e.g. for ObsIDs 1730). The light curve information has been confirmed by investigating time-selected images. In the following we give a short description of the intensity behavior of the source within the individual observations.
During ObsIDs 1730 and 7344 no flux is detected from the source (3 ACIS-I on-axis upper limit of 8 ct s-1 in the 0.5–5 keV band in 5000 s integration intervals).
During ObsID 6382, the source is faint and we needed to integrate the data over 5000 s. During the first 10 ks of the observation (untill HJD 2453698.1640.029) no significant flux is detected.
During the short ObsID 7226, the source is clearly detected but faint. The light curve again had to be integrated over 5000 s. No significant variability is detected.
During ObsID 6383 flux at the wing of the PSF of the source is clearly seen in the image. However, from HJD 2453902.0520.029 to HJD 2453902.3420.029 no photons at all are detected at that position.
During ObsID 6387, PMH47 is at least partly detected in a high state which allowed us to sample the light curve with 1000 s resolution. We observed a transition of the source from zero to high intensity at HJD 2453912.7400.012 about 15 ks after the start of the observation.
During ObsID 6385 PMH47 is again for most of the time detected at high intensity suitable for 1000 s binning. We observed transitions of PMH47 from high intensity to zero flux and back. The source transits to the low state at HJD 2453997.3290.006 and returns to the high state at HJD 2453997.6240.006. Ingress into and egress out of the low state can not be resolved by the 1000 s time bins imposed by source statistics. The duration of the low state is (255001000) s. After the low state the source seems to be more variable than before. Figure 2 demonstrates that during the low state no counts are detected from PMH47.
During ObsID 6377, the source is not detected in the first 25 ks (until HJD 2454004.5550.020) and then stayed in a faint state with indications for variability. Due to the faintness of the source the light curve was integrated with 3000 s resolution.
In the bright phase of Chandra ObsIDs 6385 and 6387 and in XMM-Newton ObsID 0102641101 we searched for pulsations in the frequency range Hz to 7 Hz and found no significant periodic signal. For the Chandra observations, the 2 upper limit for a pulsation amplitude is 25% for frequencies below 0.15 Hz while for the XMM-Newton observation, the EPIC PN upper limit is 43% for frequencies below 7 Hz. As one expects a modulation of the photon arrival time with the orbital phase which would smear out the pulsation signal for short periods (amplitude of less than 50 s for HMXBs with short orbital period, c.f. Bildsten et al., 1997), we not only investigated power spectra for the entire observation, but also added up power spectra for intervals as short as 3319 s (1024 time bins with the Chandra instrument resolution of 3.241 s).
5 Energy spectra
For the brighter states of PMH47 – that is, during the high states of Chandra ObsIDs 6385 and 6387 as well as XMM-Newton ObsID 0102641101 – more than 900 counts were collected from the source, allowing us to perform a detailed spectral analysis. The resulting integration times, raw count rates and degrees of freedom are listed in Table 3 together with the results of the power law fits. For XMM-Newton, luminosity refers to the EPIC PN spectrum, MOS2 yields similar values while those for MOS1 are 7% higher.
Due to the limited number of photons we only fitted absorbed one component spectral models. We used two absorption components, accounting for the Galactic foreground absorption (with a fixed hydrogen column density of 6 cm-2 and elemental abundances from Wilms et al., 2000) and the M 33 (catalog ) absorption (with column density as a free parameter in the fit and Galactic metal abundances). As expected for an X-ray binary, thin thermal plasma spectra with abundances fixed to solar do not give acceptable fits. Also thermal bremsstrahlung fits can be rejected as the best fit temperature in all fits is only constrained by the upper boundary (200 keV) mimicking a hard power law. A similar argument holds for disk black body models. There, the best inner disk temperature values are around 5 keV and the luminosity a few times erg s-1. According to Makishima et al. (2000), such temperatures are not reached even in ultra-luminous compact X-ray sources. Stellar mass black hole systems of similar luminosity to PMH47 show inner disk temperatures well below 1 keV. Power law fits for all observations have a similar or slightly worse minimum reduced compared to the disk black body models. They are consistent with a common photon index of 0.85. The values for the power law model fits indicate some absorption within M 33 (catalog ) or intrinsic to the source in addition to the Galactic value (5.97 and 6.32 H cm-2 in the direction of PMH47 according to Dickey & Lockman, 1990; Stark et al., 1992, respectively). Figure 3 shows the spectrum of the bright state of Chandra ObsID 6387 as an example. Un-absorbed source fluxes in the 0.2–4.5 keV band are in the range (2.4–2.7) erg cm-2 s-1 based on the best fitting power law model. These fluxes correspond to source luminosities of (1.8–2.0) erg s-1, respectively. Throughout the paper, we assume a distance to M 33 (catalog ) of 795 kpc (van den Bergh, 1991).
The values of the power law model fits indicates that PMH47 lies in the plane of the M 33 (catalog ) disk or even on the near side, as the absorbing column within M 33 (catalog ) can be determined to 1.4–1.9 cm-2 from a half power beam width Hi map (Newton, 1980). Assuming total values from 0.6–1.5 cm-2 we can compute the expected optical extinction to 0.34–0.84 mag and to 0.12–0.28 using standard relations (Predehl & Schmitt, 1995).
6 Orbital period determination
The intensity changes of PMH47 from high to low and vice versa in the Chandra ObsIDs 6385, 6387 and 6377 are not resolved by the time resolution of our plots, of 1000 s, 1000 s, and 3000 s, respectively. Shorter time bins do not help as the source is not bright enough. In the following discussion we try to interpret the intensity transitions reported in Sect. 4 by eclipses of a compact X-ray source by a companion star in a binary system and to determine eclipse parameters and orbital period of the system. For this analysis we use ObsIDs 6385, 6387 and 6377 and compare the results to the count rate behavior of PMH47 in the other observations.
From observation 6385 we derive the eclipse duration as (255001000) s and a well defined epoch of mid eclipse (HJD 245 3997.4760.006). However, the orbital period is too long to detect a second eclipse during this 91 ks observation.
A minimum length for the binary period can be estimated as 1.04 days by adding up the eclipse duration in ObsID 6385 and the longest continuous time out of eclipse (65000 s in ObsID 6387). To further constrain the orbital period of the system we use times of eclipse egresses. In HMXB systems the time of eclipse egress in most cases is better determined than the time of ingress which can be masked by additional absorption due to the viewing geometry through the innermost regions of the wind of the companion and dense material following the compact object in its orbit (e.g. Haberl & Day, 1992). The two bright 90 ks ObsIDs 6385, 6387 show an eclipse egress. Also ObsID 6377 and 6383 seem to indicate eclipses of PMH47. The frequency of the detection of eclipse in- and egresses in the 70 to 100 ks Chandra observations points at an orbital period of the system that is not much longer than these observations.
If we interpret the three transitions from low to high respective intermediate state in ObsIDs 6385, 6387, and 6377 as eclipse egresses, the orbital period of the system can be determined. We use the fact that the times of egresses have to be separated by an integer number of orbital periods. We start from the shortest separation (ObsIDs 6385 and 6377, separation d). Possible orbital periods are /n with n less than 7 (due to the shortest allowed orbital period of 1.04 days, see above). We now can test for which of these six candidate periods the time difference between the well determined eclipse egresses of ObsIDs 6387 and 6385 ( d) is consistent with an integer. Fortunately, we find a unique solution. For n = 4, is – within the errors – 49 times and we get a best period from the ChASeM33 observations of d.
This period can be further constrained by including XMM-Newton observations. Extrapolating the eclipse egress from Chandra ObsIDs 6387 with to the time of XMM-Newton ObsIDs 0102641001 and 0102641101 (1096 periods earlier) shows that an eclipse egress should have happened between these observations (separated by 0.046 d) as the source is not detected until the end of ObsID 0102641001, but it is already bright at the beginning of ObsID 0102641101. Combining XMM-Newton and Chandra eclipse egress epochs we obtain an improved orbital period for PMH47 of d. The eclipse duration corresponds to in phase or an eclipse half angle of degree.
In Tables 1 and 2 we give for the individual observations binary phase and cycle number at the beginning and end of the observations based on the best ephemeris determined above. It is clear that not all the variability can be explained by eclipses and additional variability has to be present. On the other hand some of the short XMM-Newton observations entirely fall in eclipse. Also the time without photons in Chandra ObsID 6383 (see Sect. 4) coincides with an extrapolated eclipse.
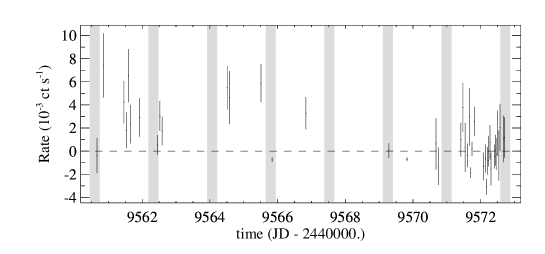
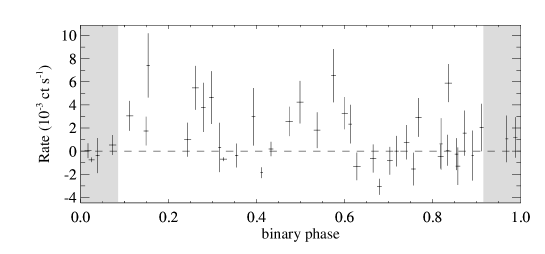
The ROSAT HRI observations are spread over 12 days and cover several orbital periods of PMH47 (Fig. 5). While during the first half of the observations PMH47 was detected most of the time, the rates are consistent with zero later on. A ROSAT HRI count rate of ct s-1 corresponds to an un-absorbed luminosity in the 0.2–4.5 keV band of 9 erg s-1 assuming an absorbed power law spectrum as observed during Chandra ObsID 6387 ( cm-2, photon index ). Therefore, during the ROSAT bright state, the PMH47 luminosity was erg s-1, about a factor of two brighter than during the Chandra and XMM-Newton bright state detections. In Fig. 5 we mark the extrapolated times of eclipse using binary ephemeris derived from the Chandra and XMM-Newton data. The ROSAT count rates are plotted versus binary phase in Fig. 6. The plot shows intensities compatible with zero at phases below 0.1 and above 0.85 indicating that the extrapolation of the ephemeris by 2560 periods still gives acceptable results. The extrapolation of the eclipse egress to the ROSAT observations leads to a phase uncertainty of 0.04. Unfortunately, the sampling of the phase space by the ROSAT observations during the bright time is not dense enough to determine an accurate eclipse egress which would allow us to improve on the binary ephemeris.
7 Optical counterpart
The improved position of PMH47 (see Fig. 4) suggests the star LGGS J013236.92+303228.8 (Massey et al., 2006) to be the optical counterpart listed with mag in with colors of mag, of , of , and of .
This star was not identified as a variable in the M 33 (catalog ) CFHT variability survey (Hartman et al., 2006). To search for any small optical modulation, we derived the light curves of this star in the Sloan , , and bands from the CFHT images using the procedure described in Hartman et al. (2006, see Sect. 2). Measured magnitudes are given in Table 4.
Folding with the X-ray period the 34, 33, and 35 measurements in , , and bands, respectively, reveals a clear modulation. The folded light curves (see Fig. 7) are of double sinusoidal shape, with one of the minima at the phase of mid X-ray eclipse, suggesting an ellipsoidal modulation of a high mass optical companion. The detection of an optical modulation at the X-ray period confirms the identification of the optical counterpart.
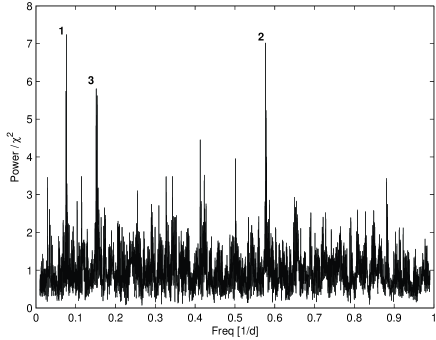
We independently searched the optical data for periodicities. We constructed periodograms using the method described at Shporer & Mazeh (2006, Sect. 3.3) where for each frequency, each band was fitted with two harmonics and a zero point. The periodogram was taken to be the amplitudes sum, in quadrature, divided by the . When using all data points the 1.7325 day peak is the highest, but there are many other similar strong peaks. When removing the data for the two outliers close to phase 0.35 and phase 0.53 (see Fig. 7), there are only three significant peaks (0.0771 d-1, 0.5772 d-1, 0.1517 d-1), and the 1.7325 day peak is the second strongest (Fig. 8). We checked if there is a justification for removing these points from the light curve based on sky conditions in the individual nights or image artifacts. While we can’t guarantee that there isn’t some non-obvious systematic variation, we are inclined to believe that the variations are real.
8 Modeling the system
In determining the parameters of the PMH47 system, we first search for a stellar model (identified by the effective temperature , the logarithm of the surface gravity , and the chemical composition Fe/H in solar units) that fits the broad-band photometry of the system, assuming the optical brightness is coming from the optical star alone. From the stellar radius, the observed X-ray eclipse width and the periodic elliptical modulation in the optical, we can derive the two masses as a function of the orbital inclination. This analysis is similar to the one presented by Shporer et al. (2007) for X7.
8.1 Optical companion
To estimate the radius of the optical companion we compared the UBVRI photometry for the star from Massey et al. (2006) to the [Fe/H] = 0 table of model stellar atmosphere broad-band colors computed by Bessell et al. (1998). Assuming a photometric uncertainty of 0.05 mag, color excess ratios of , and (Bessell et al., 1998), and a minimum extinction of which is the foreground reddening to M 33 (catalog ) from van den Bergh (2000), we place a 95% lower limit on the effective temperature of 19000 K and a lower limit on of 2.5. The formal best fit model has K, and with . Note that the extinction is in good agreement with the range of values predicted from analyzing the X-ray spectrum (). Assuming a distance of 795 kpc to M 33 (catalog ) and the “standard value” for the ratio of total to selective extinction (Cardelli et al., 1989), we place a 95% upper limit of 10.8 on the radius. For the best fit model the radius is 8.0 . For the assumed distance and best-fit extinction the absolute magnitude of the star is which, assuming the star is a main-sequence dwarf, would correspond to a star of type B0V (Schmidt-Kaler, 1982). We note that the effective temperature for such a star, K, is close to the formal best-fit temperature from modelling the broad-band colors.
8.2 Binary system parameters
We used the ”PHysics Of Eclipsing BinariEs (PHOEBE)” program of Prša & Zwitter (2005), a front-end code for the Wilson-Devinney program (Wilson & Devinney, 1971; Wilson, 1979, 1990), to model the obtained periodic light curves and to derive an estimate of the masses of both components. The main effect is due to the tidally induced ellipsoidal shape of the optical component. We ran PHOEBE on the CFHT , , and light curves, assuming the X-ray determined eclipse half angle value of and using linear limb darkening coefficients from Claret (2004), stepping through inclination and fitting for the mass ratio. Figure 7 shows a representative PHOEBE model fit to the light curves for a binary system with an inclination of . We note that due to the degeneracy between , and the Roche-lobe-filling factor, the model fit is similar for other allowed inclinations. Figure 9 shows a plot of the optical star and compact-object masses as a function of for each of these different values. Below the optical star fills its Roche Lobe. From the plot for the compact object mass, a neutron star with canonical mass of 1.4 seems to be allowed for inclinations below 85° for the 50000 K model, but only for below 75° for the 33000 K model. For the 19000 K model, a canonical mass neutron star seems to be excluded. A neutron star with canonical mass at the best fit companion temperature of 33000 K would imply a system inclination and a companion mass of 10.9 .
9 Discussion and summary
The time variability of PMH47 in the ChASeM33 observations can be explained with a 1.7 d eclipsing X-ray binary with an eclipse half angle of . The identification with an OB star in M 33 (catalog ) that shows an ellipsoidal light curve, clearly establishes the system as the second HMXB in M 33 (catalog ). We do not detect pulsations in the X-ray flux and therefore the compact object in the system could be a neutron star or a black hole. The hard X-ray spectrum, however, may indicate a neutron star system (see e.g. White et al., 1983).
We can not exclude that the long term variability of the system in the Chandra, XMM-Newton and ROSAT observations can be of irregular nature. However, it also could reflect a long term periodicity similar to those known in Her X–1, LMC X–4 or SMC X–1. The Chandra bright state observations (ObsID 6387 and 6385) are separated by 84 days. With our sparse unsystematic monitoring, we can not decide if the source had another on-state in between as would be expected by extrapolating from the 35 d period of Her X–1, a system with a similar orbital period.
Inspecting the available Massey et al. (2006) colour and emission-line images we find that the object is located in a region with few (bright) stars. Also, there are no close-by emission nebulae, indicating that the object is older than M 33 X7 (catalog ) which is still located in a H ii region.
PMH47 was serendipitously detected far off axis in the ChASeM33 observations. Only with the help of dedicated deep observations with good time resolution it will be possible to characterize long term variability of PMH47 and to search for the expected pulsation period below 50 seconds.
References
- Alard & Lupton (1998) Alard, C., & Lupton, R. H. 1998, ApJ, 503, 325
- Alard (2000) Alard, C. 2000, A&AS, 144, 363
- Arnaud (1996) Arnaud, K.A.: 1996, Astronomical Data Analysis Software and Systems V 101, 17.
- Bessell et al. (1998) Bessell, M. S., Castelli, F., & Plez, B. 1998, A&A, 333, 231
- Bildsten et al. (1997) Bildsten, L., et al. 1997, ApJS, 113, 367
- Broos et al. (2002) Broos, P., Townsley, L., Getman, K., & Bauer, F. 2002, ACIS Extract, An ACIS Point Source Extraction Package, Pennsylvania State University
- Cardelli et al. (1989) Cardelli, J. A., Clayton, G. C., & Mathis, J. S. 1989, ApJ, 345, 245
- Carter et al. (2003) Carter, C., Karovska, M., Jerius, D., Glotfelty, K., and Beikman, S. 2003, in ASP Conf. Ser. 295: Astronomical Data Analysis Software and Systems XII, ed. H. E. Payne, R. I. Jedrzewski, & R. N. Hook, 477
- Claret (2004) Claret, A. 2004, A&A, 428, 1001
- Dickey & Lockman (1990) Dickey, J. M., & Lockman, F. J. 1990, ARA&A, 28, 215
- Dubus et al. (1999) Dubus, G., Charles, P. A., Long, K. S., Hakala, P. J., & Kuulkers, E. 1999, MNRAS, 302, 731 (DCL99)
- Haberl & Day (1992) Haberl, F., & Day, C. S. R. 1992, A&A, 263, 241
- Haberl & Pietsch (2001) Haberl, F., & Pietsch, W. 2001, A&A, 373, 438
- Hartman et al. (2006) Hartman, J. D., Bersier, D., Stanek, K. Z., Beaulieu, J.-P., Kaluzny, J., Marquette, J.-B., Stetson, P. B., & Schwarzenberg-Czerny, A. 2006, MNRAS, 371, 1405
- Joye & Mandel (2003) Joye, W. A., & Mandel, E. 2003, Astronomical Data Analysis Software and Systems XII, 295, 489
- Larson & Schulman (1997) Larson, D. T., & Schulman, E. 1997, AJ, 113, 618
- Long et al. (1981) Long, K. S., Dodorico, S., Charles, P. A., & Dopita, M. A. 1981, ApJ, 246, L61
- Makishima et al. (2000) Makishima, K., et al. 2000, ApJ, 535, 632
- Markert & Rallis (1983) Markert, T. H., & Rallis, A. D. 1983, ApJ, 275, 571
- Massey et al. (2006) Massey, P., Olsen, K. A. G., Hodge, P. W., Strong, S. B., Jacoby, G. H., Schlingman, W., & Smith, R. C. 2006, AJ, 131, 2478
- Misanovic et al. (2006) Misanovic, Z., Pietsch, W., Haberl, F., Ehle, M., Hatzidimitriou, D., & Trinchieri, G. 2006, A&A, 448, 1247
- Newton (1980) Newton, K. 1980, MNRAS, 190, 689
- Orosz et al. (2007) Orosz, J. A., et al. 2007, Nature, 449, 872
- Pietsch et al. (2004b) Pietsch, W., Misanovic, Z., Haberl, F., Hatzidimitriou, D., Ehle, M., & Trinchieri, G. 2004b, A&A, 426, 11 (PMH2004)
- Pietsch et al. (2004a) Pietsch, W., Mochejska, B. J., Misanovic, Z., Haberl, F., Ehle, M., & Trinchieri, G. 2004a, A&A, 413, 879 (PMM2004)
- Pietsch et al. (2006b) Pietsch, W., Plucinsky, P. P., Haberl, F., Shporer, A., & Mazeh, T. 2006b, The Astronomer’s Telegram, 905, 1
- Pietsch et al. (2006a) Pietsch, W., Haberl, F., Sasaki, M., Gaetz, T. J., Plucinsky, P. P., Ghavamian, P., Long, K. S., & Pannuti, T. G. 2006a, ApJ, 646, 420
- Plucinsky et al. (2008) Plucinsky, P. P., et al. 2008, ApJS, 174, 366
- Predehl & Schmitt (1995) Predehl, P., & Schmitt, J. H. M. M. 1995, A&A, 293, 889
- Prša & Zwitter (2005) Prša, A., & Zwitter, T. 2005, ApJ, 628, 426
- Psaltis (2006) Psaltis, D. 2006, in Compact stellar X-ray sources (eds. W. Lewin, M. van der Klis, Cambridge University Press, 1
- Schmidt-Kaler (1982) Schmidt-Kaler, T. 1982, in Landolt-Börnstein New Series, Vol 2b, Astronomy and astrophysics - Stars and star clusters (eds. K. Schaifers, H. H. Voigt), New-York Springer Verlag
- Shporer et al. (2007) Shporer, A., Hartman, J., Mazeh, T., & Pietsch, W. 2007, A&A, 462, 1091
- Shporer & Mazeh (2006) Shporer, A., & Mazeh, T. 2006, MNRAS, 370, 1429
- Shporer et al. (2006) Shporer, A., Hartman, J., Mazeh, T., & Pietsch, W. 2006, The Astronomer’s Telegram, 913, 1
- Stark et al. (1992) Stark, A. A., Gammie, C. F., Wilson, R. W., Bally, J., Linke, R. A., Heiles, C., & Hurwitz, M. 1992, ApJS, 79, 77
- Stetson (1987) Stetson, P. B. 1987, PASP, 99, 191
- Stetson (1992) Stetson, P. B. 1992, in ASP Conf. Ser. 25, Astronomical Data Analysis, Software and Systems I, eds. D.M. Worrall, C. Biemesderfer, & J. Barnes (San Francisco: ASP), 297
- van den Bergh (2000) van den Bergh, S. 2000, PASP, 112, 529
- van den Bergh (1991) van den Bergh, S. 1991, PASP, 103, 609
- Wilms et al. (2000) Wilms, J., Allen, A., & McCray, R. 2000, ApJ, 542, 914
- Wilson & Devinney (1971) Wilson, R. E., & Devinney, E. J. 1971, ApJ, 166, 605
- Wilson (1979) Wilson, R. E. 1979, ApJ, 234, 1054
- Wilson (1990) Wilson, R. E. 1990, ApJ, 356, 613
- White et al. (1983) White, N. E., Swank, J. H., & Holt, S. S. 1983, ApJ, 270, 711
| ChASeM33 | Obs.id. | Obs.datesaadate of start of observation | On-time | ACIS | Offax | [PMH2004] 47 binary | ||
|---|---|---|---|---|---|---|---|---|
| Field | (ks) | CCD-ID | (’) | phasebbwith respect to eclipse center HJD 245 3997.476 and orbital period 1.732479 d (see text) | cyclebbwith respect to eclipse center HJD 245 3997.476 and orbital period 1.732479 d (see text) | comment | ||
| 1730 | 2000-07-12 | 40ccresidual exposure after screening first 10 ks due to background flaring | 7 | 17.6 | 0.795-1.062 | -1305,-1304 | ingress, off | |
| 4 | 6382 | 2005-11-23 | 73 | 0 | 10.2 | 0.168-0.589 | -173 | faint |
| 4 | 7226 | 2005-11-26 | 25 | 0 | 10.2 | 0.703-0.856 | -172 | faint |
| 4 | 6383 | 2006-06-15 | 99 | 3 | 10.8 | 0.754-1.424 | -56,-55 | eclipse, bright |
| 6 | 6387 | 2006-06-26 | 78 | 6 | 19.7 | 0.993-1.507 | -50,-49 | egress, bright |
| 6 | 7344 | 2006-07-01 | 22 | 6 | 19.7 | 0.882-0.998 | -47 | ingress, off |
| 5 | 6385 | 2006-09-18 | 91 | 2 | 10.9 | 0.534-1.139 | -1,0 | eclipse, bright |
| 1 | 6377 | 2006-09-25 | 94 | 6 | 17.4 | 0.906-1.507 | 3,4 | egress, faint |
| Obs.id. | Obs.datesaadate of start of observation | On-time | Offax | bb0.2–4.5 keV absorption corrected luminosity or 3 upper limits in units of erg s-1 assuming an absorbed power law spectrum ( cm-2, photon index ) and a distance to M 33 (catalog ) of 795 kpc (van den Bergh, 1991) which we use throughout the paper | [PMH2004] 47 binary | ||
|---|---|---|---|---|---|---|---|
| (ks) | (’) | phaseccwith respect to eclipse center HJD 245 3997.476 and orbital period 1.732479 d (see text) | cycleccwith respect to eclipse center HJD 245 3997.476 and orbital period 1.732479 d (see text) | comment | |||
| 0102640401 | 2000-08-02 | 16 | 5.6 | 0.952-1.039 | -1293,-1292 | eclipse | |
| 0102640501 | 2001-07-05 | 12 | 10.7 | 0.729-0.809 | -1098 | edge of pn,bright | |
| 0102641001 | 2001-07-08 | 12 | 14.7 | 0.992-1.072 | -1097,-1096 | eclipse | |
| 0102641101 | 2001-07-08 | 12 | 3.2 | 0.099-0.179 | -1096 | bright | |
| 0102642301 | 2002-01-27 | 13 | 13.7 | 0.305-0.385 | -979 | off | |
| 0141980601 | 2003-01-23 | 14 | 5.8 | 0.919-1.011 | -771,-770 | eclipse | |
| 0141980101 | 2003-07-11 | 16 | 14.7 | 0.377-0.484 | -673 | off | |
| Observation | Inst. | RateaaRaw count rate in units of ct s-1 as given in XSPEC | bbAbsorption in units of cm-2 exceeding the fixed Galactic foreground of 6.0 cm-2 | ccX-ray luminosity in the 0.2–4.5 keV band in units of erg s-1, corrected for absorption, for extraction radii, and for vignetting | ||||
|---|---|---|---|---|---|---|---|---|
| (ks) | ||||||||
| Chandra 6385 | ACIS I | 63.1 | 2.27 | 66 | 1.38 | |||
| Chandra 6387 | ACIS I | 62.5 | 2.20 | 77 | 1.19 | |||
| XMM-Newton | PN | 8.8 | 6.40 | 28 | 1.38 | |||
| EPIC | MOS1 | 9.8 | 1.73 | |||||
| 0102542301 | MOS2 | 9.8 | 1.77 |
| HJD | HJD | HJD | |||
|---|---|---|---|---|---|
| 245 0000.0 | (mag) | 245 0000.0 | (mag) | 245 0000.0 | (mag) |
| 2873.984375 | 21.077(13) | 2873.992665 | 21.424(17) | 2874.001810 | 21.731(39) |
| 2876.041448 | 21.006(12) | 2876.049696 | 21.324(16) | 2876.058663 | 21.606(35) |
| 2876.067077 | 20.982(12) | 2876.075340 | 21.308(17) | 2876.086306 | 21.630(36) |
| 2881.949358 | 21.039(15) | 2881.957628 | 21.346(17) | 2881.966625 | 21.668(36) |
| 2882.917645 | 20.999(15) | 2882.925921 | 21.321(19) | 2882.934887 | 21.673(36) |
| 2882.943189 | 20.987(12) | 2882.951458 | 21.317(16) | 2882.960463 | 21.645(34) |
| 2886.083231 | 21.085(14) | 2886.091515 | 21.430(18) | 2886.100505 | 21.720(40) |
| 2903.847418 | 20.973(14) | 2903.855644 | 21.328(18) | 2903.864595 | 21.604(36) |
| 2905.975845 | 21.050(14) | 2905.984073 | 21.374(19) | 2905.993022 | 21.707(43) |
| 2908.917034 | 20.982(13) | 2908.925269 | 21.334(16) | 2908.934226 | 21.616(32) |
| 2910.026011 | 20.988(15) | 2910.034266 | 21.330(19) | 2910.043261 | 21.622(51) |
| 2931.777952 | 21.031(14) | 2931.786238 | 21.376(20) | 2931.795225 | 21.560(42) |
| 2931.804198 | 21.035(14) | 2931.812455 | 21.369(20) | 2931.821460 | 21.703(43) |
| 2931.829883 | 21.055(12) | 2931.838149 | 21.407(18) | 2931.912971 | 21.720(44) |
| 2931.921486 | 21.046(14) | 2931.929751 | 21.389(19) | 2931.938758 | 21.708(38) |
| 2940.741715 | 21.026(14) | 2940.749948 | 21.376(22) | 2940.758913 | 21.713(51) |
| 2963.800785 | 20.940(14) | 2963.809086 | 21.267(21) | 2963.818136 | 21.477(41) |
| 2991.813734 | 20.981(14) | 2991.821989 | 21.302(20) | 2991.830949 | 21.530(40) |
| 3240.978670 | 20.988(13) | 3240.986361 | 21.335(17) | 3240.994707 | 21.616(37) |
| 3256.073787 | 21.042(16) | 3256.081416 | 21.375(19) | 3256.089708 | 21.660(40) |
| 3260.849553 | 20.989(14) | 3260.857172 | 21.311(16) | 3260.865472 | 21.625(35) |
| 3261.939754 | 21.086(16) | 3261.947396 | 21.375(21) | 3261.955702 | 21.675(41) |
| 3286.845648 | 20.985(12) | 3286.853273 | 21.312(17) | 3286.861569 | 21.632(36) |
| 3287.868151 | 21.049(12) | 3286.869976 | 21.330(18) | 3286.878287 | 21.660(42) |
| 3296.786986 | 21.063(16) | 3287.876147 | 21.362(16) | 3286.885816 | 21.672(38) |
| 3313.022723 | 20.993(21) | 3296.794665 | 21.337(23) | 3287.884760 | 21.652(36) |
| 3316.713424 | 21.048(14) | 3313.030339 | 21.315(22) | 3296.803012 | 21.637(53) |
| 3316.753196 | 21.018(11) | 3316.721061 | 21.359(20) | 3313.038618 | 21.687(40) |
| 3316.759412 | 21.018(13) | 3317.914851 | 21.279(16) | 3316.729355 | 21.601(47) |
| 3317.907228 | 20.955(13) | 3322.762627 | 21.356(21) | 3316.744412 | 21.649(42) |
| 3322.755010 | 21.058(17) | 3328.770804 | 21.362(23) | 3317.923132 | 21.601(35) |
| 3328.763167 | 21.035(17) | 3345.775498 | 21.327(16) | 3322.774943 | 21.676(41) |
| 3345.767876 | 21.003(12) | 3386.799264 | 21.363(27) | 3328.779078 | 21.690(37) |
| 3386.791633 | 21.065(24) | 3345.783809 | 21.644(36) | ||
| 3386.807594 | 21.623(54) |