Search for Redshifted 2.2 MeV Neutron Capture Line from A0535+262 In Outburst
Abstract
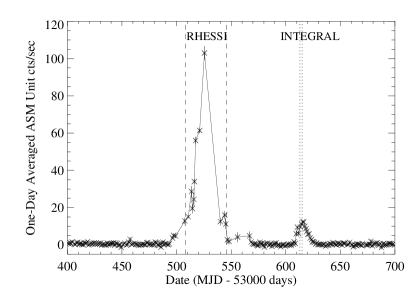
The Be/X-ray binary system A0535+262 underwent a giant outburst in May-June 2005, followed by a dimmer outburst in August-September 2005. This increased intensity provided an opportunity to search for redshifted neutron-capture lines from the surface of the neutron star. If discovered, such lines would constrain the neutron star equation of state, providing the motivation of this search. The spectrometer (SPI) on board the INTEGRAL satellite observed the dimmer outburst and provided the data for this research. We have not detected a line with enough significance, with the width-dependent upper limits on the broadened and redshifted neutron capture line in the range of (2 – 11) 10-4 photons cm-2 s-1. To our knowledge, these are the strongest upper limits on the redshifted 2.2 MeV emission from an accreting neutron star. Our analysis of the transparency of the neutron star surface for 2.2 MeV photons shows that photons have a small but finite chance of leaving the atmosphere unscattered, which diminishes the possibility of detection.
Subject headings:
nuclear reaction, nucleosynthesis, abundances – stars: neutron – X-rays: binaries – stars: individual (A0535+262)1. Introduction
Matter that is being accreted onto a neutron star has such large energies that it can undergo nuclear reactions by colliding with particles in the star’s atmosphere. Nuclei that are heavier than Hydrogen will therefore break apart and generate free neutrons. The nuclear spallation process of 4He, discussed in detail in Bildsten et al. (1993)(hereafter, BSW), begins with the 4He atom entering the star’s atmosphere with a very high kinetic energy. The atom undergoes many Coulomb collisions with atmospheric electrons and slows down. The atom may hit an atmospheric proton and splits into a neutron and 3He. After this initial spallation, the 3He travels deeper into the atmosphere and thermalizes at a high column density. The thermal 3He can do one of three things: a) absorb a neutron (the most possible outcome), b) collide with a fast proton and be destroyed, or c) participate in a fusion reaction. The neutron that was liberated during the initial spallation undergoes elastic scatterings with atmospheric protons, thermalizes and drifts down due to gravity. Since most of the 3He atoms will capture the free neutrons, the rate of production of 2.2 MeV photons will depend on the amount of excess neutrons. Another restraining factor is the depth to which neutrons travel before recombining with protons. If recombination (and therefore 2.2 MeV photon production) occurs deep in the atmosphere, the photon will have to undergo many Compton scatters before it can leave the atmosphere. Bildsten et al. (1993) have shown that for a neutron star with moderate magnetic field strength ( G), a thermal neutron drifts approximately 1 Compton length before recombining and have calculated that only 10% of the 2.2 MeV photons will escape unscattered.
These photons, emitted with an intrinsic energy E0 from the atmosphere of a neutron star of radius R and mass M, experience a gravitational redshift for an observer at infinity to an energy E given by
(Özel & Psaltis, 2003). Measuring E/E0 would allow a direct measurement of the gravitational redshift and place significant constraints on the underlying equation of state. Using the P- relation for a given model, the equation of hydrostatic equilibrium can be numerically integrated to obtain the global mass-radius (M-R) relation for that equation of state, defining a single curve in the neutron star M-R diagram (Lattimer & Prakash, 2004). While the ratio M/R cannot identify the nuclear equation of state uniquely, it can rule out several models and place constraints on the remaining models. If the mass can be measured independently, using other means, then the nuclear equation of state can be uniquely identified.
When calculating the 2.2 MeV photon production mechanism, BSW have assumed a moderate magnetic field and that matter arrives radially onto the neutron star. The magnetic field of A0535+262 has recently been measured as G (Caballero et al., 2007). In such high magnetic fields, the ability of such line photons to escape the neutron star is contingent upon the optical depths for Compton scattering and also for magnetic pair creation being less than unity. The Compton scattering constraint amounts to one on proximity of the emission point to the upper layers of the stellar atmosphere; as mentioned above, it was addressed in BSW, using non-magnetic Compton scattering cross sections. The pair production constraint is more involved, and will be addressed at some length in the Discussion below. The bottom line is that pair creation transparency of the magnetosphere to 2.2 MeV photons will be achieved if their origin is at polar magnetic colatitudes less than around 20 degrees and they are beamed within around 15–20 degrees relative to their local surface magnetic field vector. These two requirements limit the expectation for visibility of a 2.2 MeV emission line to small, but non-negligible probabilities.
The 2.2 MeV line is expected to be both redshifted and broadened, due to gravitational and relativistic effects (Özel & Psaltis, 2003). Since we don’t know a priori how much the line will be redshifted, we scanned the entire 1 MeV - 2.2 MeV region - wide enough to contain the redshifted line according to several different equations of state (Shapiro & Teukolsky, 1983) given in Table 1. The width of the redshifted 2.2 MeV line is also unknown, which led us to scan the 1 - 2 MeV region using different energy bands: 5keV, 11keV(E/E0 = 0.5%), 22 keV (E/E0 = 1%), 44 keV (E/E0 = 2%), 100 keV, 150 keV and 170 keV. We expect the line broadening to be minimal, since it is not a rapidly rotating neutron star with a pulsation period of 103 seconds (Clark et al., 1998).
| Equation of Stateb | / | R (km) | E (MeV) |
|---|---|---|---|
| 1.5 | 7.5 | 1.41 | |
| R | 1.6 | 8.5 | 1.47 |
| BJ | 1.9 | 10.5 | 1.50 |
| TNI | 2.0 | 9 | 1.30 |
| TI | 2.0 | 12-15 | 1.56-1.72 |
| MF | 2.7 | 13.5 | 1.41 |
a Shapiro & Teukolsky (1983)
b : Pion Condensate, R:Reid’s, BJ: Bethe-Johnson, TNI: 3-Nucleon Interaction Approximation, TI: Tensor Interaction, MF: Mean Field Approximation
The redshifted 2.2 MeV line from A0535+262was previously studied by Boggs & Smith (2006), using RHESSI data. The RHESSI data was gathered during A0535+262’s giant outburst (May 18 - June 25), whereas we used data from a smaller outburst that took place approximately 3 months later (see Caballero et al., 2007, for a detailed discussion of INTEGRAL and RXTE analysis of the source). The RHESSI instrument uses Germanium crystals as detectors like SPI, but its area is smaller, and there is no shielding. It is specifically designed to study solar flares, and due to the close proximity of the Sun to this source during the giant outburst, while INTEGRAL wasn’t able to study this event, RHESSI had an unique opportunity to observe the entire outburst. Boggs & Smith (2006) subsequently calculated flux upper limits for A0535+262 which we used for comparison.
2. SPI Instrument and Analysis
SPI is the spectrometer on board the INTEGRAL satellite that was launched in October 2002. SPI consists of 19 high purity Ge detectors, although only 17 are currently operational since the loss of detectors 2 and 17 on December 6, 2003 and July 18, 2004 respectively. SPI has an energy range of 20 keV - 8 MeV with an energy resolution of 2.3 keV at 1.3 MeV (Vedrenne et al., 2003). This high precision makes SPI a good candidate for detecting narrow lines. The spectrometer uses coded aperture for imaging and is shielded by an anti-coincidence system that issues a veto flag for every photon that hits the detectors without passing through the mask.
The INTEGRAL data we used was gathered between August 31 and September 2 2005 (revolution 352). The good observing time was about 209 ksec, with a total of 56 pointings. We tried four different background subtraction methods: two different empty fields, GEDSAT and GEDRATE. The first empty field we used was from revolution 220 (standard empty field in OSA, observations of Algol) and consisted of 103 pointings and 186 ksec. The second empty field we used was from revolutions 348 and 349 (observations of Cen-A, corresponding to August 2005) closer by date to our observation, and consisted of 41 pointings and 123 ksec. Although the latter one wasn’t really “an empty field” in hard X-rays, no source was detected above 1 MeV. The GEDSAT and GEDRATE background models are integrated in the SPI analysis software. GEDSAT assumes that the background level is proportional to the product of saturated detector trigger rate and live-time, whereas the GEDRATE background model assumes that the background level is proportional to the product of non-saturated detector trigger rate and live-time.
We used spiros version 5.1 for data analysis, provided by ISDC. For each of the four background subtraction methods we accumulated data for detector subsets: single events (SE), PSD events (PE), and double events (ME2). The single events represent the cases where a photon is detected by any one of the 17 are currently operational, but not tagged by the PSD. The PSD events represent the events which are analyzed by the Pulse Shape Discriminator. The double events (or multiple events with two detectors, ME2) are defined as cases where groups of two detectors detect an event simultaneously, in which case the energy of the photon is given by the sum of the two detectors. The reason we have different detector subsets is as follows. We do not want to use only SE+PE events (which is usually done for analysis of low energy data) because there is significant area at ME2 above 1 MeV. Moreover, for SE there is a significant background noise in the 1.4 - 1.7 MeV region (Weidenspointner et al., 2003) which is artificial. These background features are diminished when double events and/or PSD events are used. Therefore except in this region we merged PE, SE, and ME2, while within the region of the artificial background component we used PE+ME2. This was done by using a modified spi_obs_hist, and renormalizing the effective area after the fluxes are obtained. The rest of the analysis has been done using standard OSA software.
In order to create the spectrum of A0535+262 we did imaging in 5keV steps and plotted the flux (photons cm-2 sec-1 keV-1) against energy. We used IDL to fit Gaussian curves of given energy and FWHM and extracted the errors of the flux, given by the area under the Gaussian, to calculate the 3 flux upper limits.
3. Results
Two spectra of A0535+262 are given in Figures 2 and 3, for different background subtraction methods and different detector subsets. The significance of A0535+262 did not exceed a few in any of the imaging analyses, therefore we couldn’t detect a line. However, we calculated upper limits for the flux for different background subtraction methods and line widths. In order to do this, we fit the residual spectrum to Gaussian lines with a constant background in 5 keV steps. The errors of these fits provided us with the flux upper limits. When fitting Gaussians with large FWHM values (such as 44 keV or 110 keV), the low and high energy limits of the spectrum gave unusually high error values due to the lack of data below 1 MeV and above 2.2 MeV; these were neglected. We chose to use the same FWHM values as Boggs & Smith (2006) in order to make a meaningful comparison of the RHESSI and SPI instruments. The line widths range from 11 keV FWHM (E/E0 = 0.5%) to 110 keV FWHM (E/E0 = 5.0%) since we cannot calculate the exact line broadening, which depends on the geometry of the mass accretion and emission. Three energy dependent flux upper limit plots are shown in Figures 4, 5 and 6 and the upper limits for all background subtraction methods and line widths are given in Table 2 along with the RHESSI upper limits for comparison (Boggs & Smith, 2006).


| E/E0 (FWHM) | RHESSI Fluxa | Rev. 220 Fluxb | Rev 348/349b Flux | GEDSAT Fluxb | GEDRATE Fluxb | GEDSAT Fluxc |
|---|---|---|---|---|---|---|
| (%) | (photons cm-2 s-1) | (photons cm-2 s-1) | (photons cm-2 s-1) | (photons cm-2 s-1) | (photons cm-2 s-1) | (photons cm-2 s-1) |
| 0.5 | 4.0 10-4 | 2-3 10-4 | 2-3 10-4 | 2-3 10-4 | 2-3 10-4 | 2-3 10-4 |
| 1.0 | 5.0 10-4 | 3-4 10-4 | 3-4 10-4 | 3-5 10-4 | 3-5 10-4 | 3-4 10-4 |
| 2.0 | 6.4 10-4 | 4-6 10-4 | 4-6 10-4 | 5-7 10-4 | 5-7 10-4 | 4-6 10-4 |
| 5.0 | 10.5 10-4 | 7-10 10-4 | 7-10 10-4 | 8-11 10-4 | 8-11 10-4 | 7-10 10-4 |
a Boggs & Smith (2006)
bUsing single and PSD events only.
cUsing single, double and PSD events.
4. Discussion
Despite the excellent energy resolution and relatively high area of SPI for high energy photons, the redshifted 2.2 MeV line from A0535+262 was not detected significantly. However, we were able to obtain stronger constraints in the flux than that of RHESSI instrument. The non detection is not surprising, as the transparency of the neutron star, detailed below, is greatly diminished for high magnetic fields, reducing the yield of 2.2 MeV photons.
The visibility of any atmospheric 2.2 MeV neutron capture line is subject to potential attenuation in the neutron star magnetosphere. The leading process for such absorption is magnetic pair production, , the process that underpins standard radio and polar cap gamma-ray pulsar models (e.g. Sturrock (1971), Daugherty & Harding (1996)). This mechanism is the highest order photon absorption interaction in strong-field QED, and is prolific at the field strengths inferred for A0535+262. It has a threshold (for the polarization state) of , where is the angle the photon momentum vector makes to the local field line, above which the interaction rate precipitously rises (e.g. Daugherty & Harding (1983), Baring (2008). At energies only modestly above threshold, the attenuation lengths in local fields greater than around Gauss are considerably less than 1cm. Accordingly, once the threshold is crossed, 2.2 MeV photons can be expected to be destroyed in A0535+262, provided this occurs at altitudes less than around one stellar radius above the surface. This accessibility of the threshold defines the broad criterion for transparency versus opacity of the magnetosphere for the line photons, the outcome of which is critically dependent on geometry. Attenuation phase space can readily be assessed as functions of the surface polar field, the surface emission locale, and the emission direction of the photons. Such a detailed analysis was offered by Baring & Harding (2001) at much higher energies that are germane to pulsar and magnetar continuum emission. It should be remarked that familiar two photon pair creation is negligible in comparison.
The transparency of the magnetosphere for 2.2 MeV line photons was investigated here principally via the salient threshold criterion, to quickly ascertain the pertinent approximate phase space. Our analysis was performed in flat spacetime, sufficient for a general indication of transparency, for which rather simple geometrical relations for photon transport through the magnetosphere can be prescribed, along the lines of the approach that Baring & Harding (2007) used for resonant Compton upscattering in magnetars. The involved mathematical details of this analysis will be omitted here, for the sake of brevity, and only the principal conclusions outlined. Photons at 2.2 MeV that are emitted at the atmospheric surface are below magnetic pair creation threshold when they initially have . Note that at the field strengths of Gauss appropriate for A0535+262, the pair threshold for the photon polarization state is extremely close in energy to that for the state. For equatorial emission locales, where the radius of field curvature is comparatively small, even photons that are initially beamed close to field lines rapidly acquire sufficient angles with respect to B to precipitate pair attenuation. Hence the magnetosphere is necessarily opaque to for emission colatitudes generally greater than around . Near the pole, if initially, transport of photons to significant altitudes is required to access pair threshold. There, the field line curvature radius is for a neutron star radius of . Accordingly, photons that initially are beamed close to the field, acquire an angle of when reaching an altitude . This altitude must generally be more than around a stellar radius for the field decline to render the pair creation rate insufficient to sustain photon attenuation, as opposed to free escape (see, e.g. Baring & Harding (2001) for a detailed examination). To summarize our analysis, here we find that pair creation transparency of the magnetosphere to 2.2 MeV photons will occur if their origin is at polar magnetic colatitudes and they are initially beamed within around 15–20 degrees relative to their local surface magnetic field vector. These two requirements limit the expectation for visibility of any 2.2 MeV emission line to modest or small, but non-negligible, surface areas and solid angles.
With a more powerful tool for background rejection and a dramatical improvement in sensitivity (broad line sensitivity of 1.2 10-6 photons cm-2 s-1 and a spectral resolution of 0.2 – 1 ) (Boggs, 2006), the Advanced Compton Telescope could be a good opportunity to follow up on the search for the broadened and redshifted 2.2 MeV line.
References
- Baring (2008) Baring, M. G., 2008, in AIP Proc. CASYS07 Conference Computing Anticipatory Systems, eds. D. Dubois et al., arXiv:0804.0832
- Baring & Harding (2001) Baring, M. G., & Harding, A. K., 2001, ApJ, 547, 929
- Baring & Harding (2007) Baring, M. G., & Harding, A. K., 2007, Ap&SS, 308, 109
- Bildsten et al. (1993) Bildsten, L., Salpeter, E. E., & Wasserman, I., 1993, ApJ, 408, 615
- Boggs (2006) Boggs, S. E., 2006, New Astronomy Reviews, 50, 604
- Boggs & Smith (2006) Boggs, S. E., & Smith, A. M., 2006, ApJ, 637, 121
- Caballero et al. (2007) Caballero, I., et al., 2007, A&A, 465, L21
- Clark et al. (1998) Clark, J. S., et al., 1998, MNRAS, 294, 165
- Daugherty & Harding (1983) Daugherty, J. K., & Harding, A. K., 1983, ApJ, 273, 761
- Daugherty & Harding (1996) Daugherty, J. K., & Harding, A. K., 1996, ApJ, 458, 278
- Lattimer & Prakash (2004) Lattimer, J. M., & Prakash, M., 2004, Science, 304, 536
- Özel & Psaltis (2003) Özel, F., & Psaltis, D., 2003, ApJ, 582, L31
- Shapiro & Teukolsky (1983) Shapiro, S. L., & Teukolsky, S. A., 1983, Black holes, white dwarfs, and neutron stars: The physics of compact objects, New York: John Wiley & Sons
- Sturrock (1971) Sturrock, P. A., 1971, ApJ, 164, 529
- Vedrenne et al. (2003) Vedrenne, G., et al., 2003, A&A, 411, L63
- Weidenspointner et al. (2003) Weidenspointner, G., et al., 2003, A&A, 411, L113