Spectroscopic Evidence for the Specific Na+ and K+ Interactions with the Hydrogen-bonded Water Molecules at the Electrolyte Aqueous Solution Surfaces
Abstract
Sum frequency generation vibrational spectra of the water molecules at the NaF and KF aqueous solution surfaces showed significantly different spectral features and different concentration dependence. This result is the first direct observation of the cation effects of the simple alkali cations, which have been believed to be depleted from the aqueous surface, on the hydrogen bonding structure of the water molecules at the electrolyte solution surfaces. These observations may provide important clue to understand the fundamental phenomenon of ions at the air/water interface.
In this letter we would like to report the significantly different sum-frequency generation vibrational spectra of the NaF and KF aqueous solution surfaces. These results suggested that the ion effects on the interfacial water hydrogen bonding structure are quite different for the NaF and KF salts. These results may provide direct counterexamples to the physical picture based on the currently prevalent molecular dynamics (MD) simulations with the polarizable force field, which have predicted that the adsorption of the more polarizable anions, such as the I- and Br- anions, are significantly enhanced at the electrolyte aqueous solution surfaces, while the less polarizable anions, such as the F- and Cl- anions, and the non polarizable cations, such as the Na+ and K+ cations, are repelled from the electrolyte aqueous solution surfaces.TobiasChemRev ; TobiasFeatureArticle6361 ; Tobias7617 ; DangChemRev ; TobiasJPCB10468
Recently, there have been a great deal of theoretical and experimental studies on the ion solvation and ion effects at the electrolyte aqueous solution surfaces.AllenChemRev ; GarrettScience ; TobiasScience08 ; TobiasFeatureArticle6361 ; TobiasChemRev ; JungwirthARPC ; JungwirthFaraday2009 ; SaykallyCPL51 ; SaykallyCPL46 ; Saykally10915 ; Saykally7976 ; SaykallyJACS ; SaykallyARPS ; AllenSodiumHalide2252 ; ShultzJPCB585 ; Motschmann4484 ; Motschmann2099 ; AllenJPCB8861 ; ShenJACS13033 ; BianPCCP ; Richmond5051 ; SloutskinJCP054704 ; GhosalScience ; WinterChemRev2006 ; HemmingerPCCP4778 ; PadmanabhanPRL086105 Ions have long been considered to be depleted from the surface of an aqueous solution of simple electrolytes, such as the alkali halides.LangmuirJACS1848 ; OnsagerJCP528 ; AdamsonBook According to the Gibbs adsorption equation, the increase of the surface tension of water with the addition of simple inorganic salts was explained by the assertion that the simple ions can only have a negative adsorption at the aqueous interface.AdamsonBook The subsequent electrostatic theory incorporated with the image charge repulsion effect, i.e. the Wagner-Onsager-Samaras model, provided a quantitative molecular theory for the ion (both anion and cation) depletion picture for the aqueous interface at low electrolyte concentration.OnsagerJCP528 ; MarkinJPCB11810 Such a classical picture remained unchallenged till the 1990s.
The excitement to go beyond Onsager and Langmuir certainly ignited many activities on this seemingly long-settled problem.SaykallyARPS ; TobiasFeatureArticle6361 Recent experimental observations on the chemical reaction occurring on aqueous sea-salt particles and ocean surfaces also indicated a likely incompatibility with the picture of an ion-free aqueous surface.KinppingScience301 ; LaskinScience340 ; HuJPC8768 Following up these experimental observations, recent molecular dynamics (MD) simulations on the aqueous systems, especially the development of the polarizable force fields of liquid water molecules and the anions, predicted specific anion effects at the interface of simple electrolyte aqueous solutions.TobiasChemRev ; DangChemRev ; TobiasFeatureArticle6361 These studies predicted the enrichment effect of the halide anions in the aqueous solution surface region, and also pointed out that the enrichment was associated with the electrostatic polarizability of the specific anions.TobiasJPCB10468 In this paradigm, the F- and Cl- anions are less polarizable, and the Na+ and K+ cations are considered non-polarizable. All of them are expected to be repelled from the aqueous solution surface. Thus, no or little anion and cation effect on the interfacial water hydrogen bonding structure by either of these four ions was expected.
Sum-frequency generation vibrational spectroscopy (SFG-VS) has been proven to be the only surface specific spectroscopic method to probe the vibrational spectra of the molecular species at the liquid surfaces.ShenYRJPCB3292 Since it was first applied to probe the water molecules at the neat air/water interface by Shen and co-workers in 1993,ShenYRPRL2313 tremendous advances in the understanding of the aqueous surfaces have been achieved.ShultzIRPC123 ; RichmondChemRev2002 ; ShenChemRev2006 ; GanWeiJCP114705 In the SFG-VS experiment, usually a tunable infrared (IR) laser beam and a fixed wavelength visible beam are focused simultaneously onto the molecular surface, and the resulted SFG signal at the sum of the IR and visible frequencies is detected.shen1989nature ; ShenZhuangPRB ; WangIRPC The ssp polarization combination is one of the two often used polarization combinations, i.e. ssp and ppp, in the SFG-VS experiment. Here ssp means that in the SFG-VS experiment, the electric field vectors of the outgoing sum frequency signal beam, the incident visible beam and the incident infrared (IR) beam are in the s, s and p polarizations, respectively. s represents the case when the electric field vector of the optical beam is perpendicular to the incident plan formed by the surface normal vector and the incident beam wave vectors; while p represents the case when the electric field vector is in the incident plane.ShenZhuangPRB
It has been well established that the ssp SFG spectra for the neat air/water interface has two prominent features, one is the narrow peak centered at 3700cm-1 and the other is the fairly broad band in the 3000-3600cm-1. The former is the signature of the non hydrogen-bonded O-H group which sticks out of the liquid phase, i.e. the so called ‘free O-H’; while the latter is the signature of the O-H stretching vibrations of the differently hydrogen-bonded water molecules on the liquid side in the vicinity of the air/water interface.ShenYRPRL2313 ; ShultzIRPC123 ; RichmondChemRev2002 ; ShenChemRev2006 ; GanWeiJCP114705 These signatures of the interfacial water molecules can be observed in the SFG-VS because the water molecules at the air/water interface are orientationally ordered.ShenYRPRL2313 ; ShultzIRPC123 ; RichmondChemRev2002 ; ShenChemRev2006 ; GanWeiJCP114705 ; GanWeiCJCP20
It has been known that addition of the electrolytes into the bulk aqueous phase can introduce changes in the ssp SFG spectra in the hydrogen-bonded water region, i.e. 3000-3600cm-1.ShultzIRPC123 ; ShultzJPCBFeature5313 ; AllenChemRev ; Tobias7617 ; Richmond5051 ; AllenSodiumHalide2252 ; ShultzJPCB585 In order to systematically investigate the anion effects on the hydrogen-bonded water molecules at the electrolyte aqueous solution surfaces, the ssp SFG-VS spectra of the NaF, NaCl, NaBr and NaI slat solution surfaces were measured by two independent groups.Richmond5051 ; AllenSodiumHalide2252 Their SFG-VS data on the NaCl, NaBr and NaI aqueous solution surfaces agreed well with each other. Basically, the intensity of the narrow peak, centered at 3700cm-1 and assigned as the stretching vibration mode of ‘free O-H’, remained almost unchanged for all these salt solution surfaces upto 2.0M. In the mean time, the intensity of the broad band spectra of hydrogen bonded water in the broad 3400cm-1 band increased slightly to significantly from that of the neat air/water interface in the order of NaCl, NaBr, and NaI; while the intensity of the broad band around 3250cm-1 decreased with the same order. However, the SFG-VS data of the NaF aqueous solution surface from the two competing groups exhibited significant difference in the 3000-3600cm-1 spectral region, while the 3700cm-1 remained almost unchanged from that of the neat air/water interface. Allen and co-workers observed almost identical ssp SFG-VS spectra for the neat air/water interface and for the 0.83M NaF aqueous solution surface, i.e. there was essentially no ion effect of the NaF salt on the ssp SFG-VS spectra of the interfacial water molecules.AllenSodiumHalide2252 However, Richmond and co-workers observed apparent drop of the SFG spectral intensity in the 3000-3600cm-1 region for the 0.88M NaF aqueous solution surface from that of the neat air/water interface.Richmond5051
The conclusions based on the different experimental observations in these two studies were almost entirely different.Richmond5051 ; AllenSodiumHalide2252 ; Tobias7617 Allen and co-workers concluded the confirmation of the MD simulation results on the enhanced adsorption of the more polarizable anions in the surface water layers.Tobias7617 ; TobiasFeatureArticle6361 They further compared the relative SFG spectral intensity changes with the respective bulk IR and Raman spectra in the 3000-3600cm-1 region, and concluded that the surface water thickness for the NaBr and NaI aqueous solution was significantly increased. This was also considered as the evidence to support the enhanced adsorption of the Br- and I- anions at the aqueous solution surfaces.
However, Richmond and co-workers suspected that the change of the SFG intensity in the 3400cm-1 for the NaCl, NaBr and NaI solution surfaces did not necessarily indicate the increase of the thickness of the surface water layers at the electrolyte solution surfaces. In the meantime, they also concluded that the drop of the SFG spectra intensity in the 3000-3600cm-1 region for the 0.88M NaF solution surface was the strong evidence for the presence of the F- anion in the aqueous solution surface layers, even though the F- anion concentration in the surface region was less than that in the bulk. Therefore, the whole paradigm for the surface enhanced adsorption of the more polarizable anions, i.e. the Br- and I- anions, was not likely to be supported by their SFG-VS data. Richmond and co-workers concluded that both the more polarizable and less polarizable anions, e.g. F- anion, did present in the vicinity of the sub-surface and influenced the hydrogen bonding structure in the surface water layers, even without the enhanced adsorption of any of these anions.Richmond5051 Recently, Shen and co-workers employed the phase-sensitive SFG-VS measurement and studied the ssp SFG-VS spectra of the NaI, HI, HCl and NaOH aqueous solution surfaces in comparison with the neat air/water interface.ShenYRPRL096102 ; ShenJACS13033 They confirmed the influence of the interfacial water hydrogen bonding structure by the I-, OH- anions and the hydronium cation in the previous SFG-VS studies.ShultzJPCB585 ; Allen2007JPCC8814 ; RichmondJACS128page14519(2007) ; ShultzCPL302page157(1999) ; Richmond5051 ; AllenSodiumHalide2252 ; Tobias7617
To the best of our knowledge, so far there have been no SFG-VS studies on the cation effects on the hydrogen bonding structure of the surface water molecules at the electrolyte aqueous solution surfaces, except for the hydronium cation. There has been no comparison of the SFG-VS spectra for the NaX (X=f, Cl, Br, or I) and KX salt aqueous solution surfaces. Our interest on this problem was the direct result of our recent non-resonant second harmonic generation (SHG) studies on a series of the alkali halide salt aqueous solution surfaces.BianPCCP ; BianSubmitted In these studies, we demonstrated that the non-resonant SHG signal was originated only from the electronic responses of the hydrogen bonded water molecules with the orientationally ordered structures at these electrolyte aqueous surfaces.ZhangWKJCP224713 In the SFG-VS measurement, surface water molecules with different hydrogen bonding structures exhibit clearly different vibrational spectral features. However, the non-resonant SHG signal from these surfaces is the measurement of the whole water surface layer without discrimination on the surface water molecules in different hydrogen-bonding configurations. Therefore, non-resonant SHG is a much better tool to quantify the relative increase of the average thickness of the total surface water layers than SFG-VS.BianPCCP ; AllenSodiumHalide2252 With the quantitative polarization analysis on the non-resonant SHG signals from the surfaces of the NaF, NaCl, NaBr, KF, KCl, and KBr aqueous solutions with different bulk concentrations, the relative orientational parameters as well as the relative changes of the thickness of the surface water layers for these solutions were obtained quantitatively.HongfeiPCCP ; BianPCCP ; BianSubmitted In these studies, we arrived at two main conclusions. The first conclusion was that the average thickness of the surface water layers increases with the bulk electrolyte concentration almost linearly in the following order: KBr NaBr KCl NaCl NaF KF. These increases of the average thickness of surface water layers were less than 35 of that for the neat air/water interface even when the bulk salt concentration was 5M for the NaBr and 4M for the KBr. The second conclusion was that the average orientation parameter of the water molecules at these surfaces shifts slightly with the increase of the bulk electrolyte concentration and the shift was in opposite directions for the sodium and potassium salt solution surfaces.
These observations explicitly indicated that the Na+ and K+ cations can specifically influence the hydrogen bonding structure of the water molecules at the solution surfaces. From general chemistry textbooks we know that the saturation solubilities for NaF and KF salts in water are significantly different at the room temperatue. In fact, at 20∘C, the saturation concentration for NaF is only 0.98M (4.13g NaF per 100g water), while the saturation concentration in KF is 15.4M (89.8g KF per 100g water).CRCHandBook The difference is more than 10 fold. These facts suggested that the interactions of the Na+ and K+ cations with water and the F- anion in the aqueous phase can be significantly different. The vestige of such differences may also be presented in the hydrogen bonding structure of the surface water molecules for the aqueous solutions of the NaF and KF salts. Apparently, SFG-VS is the right tool to reveal these differences in the aqueous solution surfaces.ShenYRJPCB3292
The ssp SFG-VS spectra in the 3000-3800 region of the neat air/water interface, and the surfaces of the NaF and KF aqueous solution with different bulk salt concentrations are presented in the Figure 1 and Figure 2. The details of the SFG-VS experiment with a picosecond SFG-VS spectrometer (EKSPLA, Lithuania) were described previously.GanWeiJCP114705 The experiments were conducted in the co-propagation configuration with the visible beam incident angle at 45∘, the IR beam incident angle at 55∘, and with the SFG signal detection in the reflection geometry. The SFG signal was normalized with a thick z-cut quartz , and the normalization procedures were described previously.ShenYRPRL4799 ; GanWeiJCP114705 The NaF (ACROS and Sigma-Aldrich, ACS reagent grade with purity) and KF (Sigma-Aldrich, ACS reagent grade with purity) salt samples were treated with the previously reported purify procedures, and the possible organic contaminations at the solution surfaces were monitored with the SHG fluctuation and SFG-VS spectra.BianPCCP The liquid water used in the experiment was purified with a Millipore Simplicity 185 () from double distilled water.
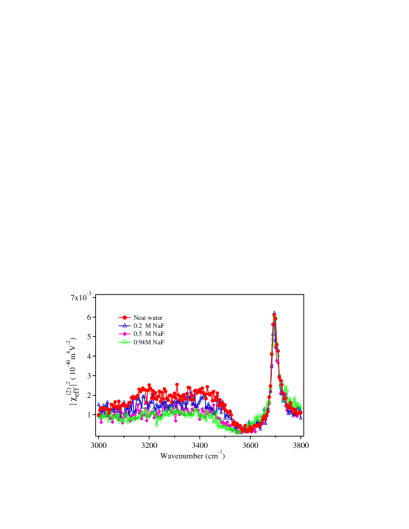
The four ssp SFG-VS spectra in the 3000-3800cm-1 region as shown in the top panel of Figure 1 correspond to the neat air/water interface, the 0.2M, the 0.5M and the 0.94M NaF aqueous solution surfaces. The apparent concentration dependence of the SFG signal intensity in the 3000-3600cm-1 agreed quantitatively with the results for the 0.88M NaF solution as reported by Richmond and co-workers previously.Richmond5051 These experiments were conducted with the purified NaF salt sample solutions with special care.BianPCCP The NaF sample from different distributors were also tested. Since the narrow ‘free O-H’ peak at 3700cm-1 showed nearly no change, the NaF solution surface should be free from any observable organic contaminations. Therefore, the NaF effects on the spectra in the 3000-3600cm-1 region were evident. Therefore, the observed bulk concentration dependence for the NaF solution surface was quite firmly established. In the Figure 2 we presented the three spectra of the neat air/water interface measured in three different days. The reproducibility of these spectra was remarkable, and the same quality of overlap can also be achieved with some of the most reliable spectra of the neat air/water interface in the literatures.ShenYRPRL4799 ; Richmond5051 ; AllenSodiumHalide2252
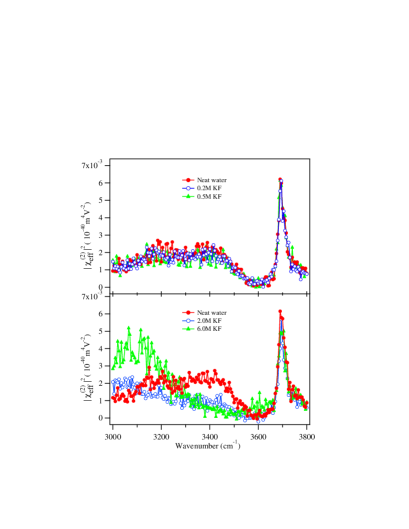
The concentration dependent spectra for the KF aqueous solution surfaces are presented in the bottom two panels in the Figure 1. The narrow 3700cm-1 peak also remained unchanged for the different bulk KF concentrations, and the concentration dependent changes of the 3000-3600cm-1 for the KF solution surfaces showed no resemblance to those for the NaF solution surfaces at various concentrations. Unlike the NaF, for lower concentration KF solutions, the surface SFG spectra remained almost unchanged from the SFG spectra of the neat air/water interface in the whole 3000-3800cm-1. Nevertheless, at higher KF concentrations of 2.0M and 6.0M, the spectral intensity of the broad 3400cm-1 band dropped significantly from that in the SFG spectra of the neat air/water surface; while the intensity for the broad band below 3200cm-1 raised above that in the SFG spectra of the neat air/water interface. In contrast, both the whole broad band in the 3000-3600cm-1 region in the SFG spectra of the NaF solution surfaces, as shown in the top panel in the Figure 1, dropped significantly with the increase of the bulk NaF concentration in comparison to the spectra intensity of the neat air/water interface in the same spectral region.
Considering the fact that the solubility of the KF salt in water is more than 10 times bigger than that of the NaF salt, one may expect that there are less ions, anions or cations, in the vicinity of the 0.2M and 0.5M KF solution surfaces than in the vicinity of the surfaces of the NaF solutions with the same bulk concentrations. However, the striking differences in the SFG spectra features of the NaF and KF solution surfaces suggested not only the presence of different quantity of ions at their respective surfaces, but also specific cation effects of the two electrolytes on the surface water molecules. Such ion effects certainly can not be explained as the anion effect since both the NaF and KF solutions consists the common F- anion. The significantly different Na+ and K+ cation effects as observed here neither can be easily accommodated into the classical picture of the electrolyte aqueous solution surfaces,OnsagerJCP528 ; MarkinJPCB11810 nor can be easily explained with the currently prevalent paradigm.TobiasChemRev ; DangChemRev ; TobiasFeatureArticle6361
If the classical picture was correct, both the anion and cation should be repelled from the aqueous surface. Then the observed anion and cation effects can only be chiefly due to the long-range interactions between the surface repelled cations and the oriented water dipoles at the solution surface. According to this picture, it shall be hard to imagine how such long-range interactions can be so different for the Na+ and the K+ cations, since people already knew that the solvation of the Na+ and the K+ cations hardly go beyond the second solvation shell.LisyJCP8555 ; LisyJCP024319 On the other hand, in the currently prevalent paradigm, the adsorption of the more polarizable anions to the aqueous solution surfaces should be enhanced, but not the less polarizable anions, such as the F-, and the cations, such as the Na+ and the K+ cations. Then the difficulties shall be the same as in the classical picture on how the significantly different Na+ and the K+ cation effects are originated.
Richmond and co-workers observed the change of the SFG spectra for the NaF aqueous solution surfaces,Richmond5051 which is further confirmed in our measurement as reported here. They concluded that even though the F- anion concentration was ‘diminished’ in the top surface water layers, the presence of F- anion in the surface region can still affect the hydrogen bonding structure of the water molecules in the surface region in different ways from the larger and more polarizable Br- and I- anions. According to the same reasoning as Richmond and co-workers proposed for the F- anion, the presence of the Na+ and the K+ cations in the surface layers, even though diminished from the bulk concentration, can also be expected. Indeed, in addition to confirming the results on the NaF in their paper,Richmond5051 we also observed the cation effects for the Na+ and the K+ cations, which can further support the reasoning proposed by Richmond and co-workers. This latter observation also indicated that both the Na+ cation and the F- anion were responsible for the observed electrolyte effects on the water molecules at the NaF solution surface. It can not be attributed to the F- anion alone, and it is also possible that ion pairing may play roles.BianSubmitted This certainly provides a new aspect to the understanding of the ions at the air/water interface. No matter how, since all the SFG-VS measurements we have conduced are measurements on the surface water molecules instead of the ions, it is clear to us that neither the anion effects nor the cation effects on the SFG spectra can be simply used as the evidences for the enhanced adsorption of either of the ions at the electrolyte aqueous surface.
In conclusion, the SFG-VS and non-resonant SHG experimental observations on the water molecules at the solution surfaces of the various alkali halide salts have demonstrated clear cation effects at the electrolyte solution surfaces. More experimental data on different electrolyte systems are required to demonstrate the various possibilities of the cation effects, and also the ion pairing effects on the water molecules at the electrolyte solution surfaces. Based on the observed cation effects of the NaF and KF, we are now in the process to investigate more NaX/KX salt pairs, as well as other salts. These observations may provide important clues to the understandings on the fundamental phenomenon of ions at the air/water interface.
Acknowledgment: RRF thanks the technical assistance from Feng Wang and Zhi Huang. HFW thanks the support by the Natural Science Foundation of China (NSFC, No.20425309, No.20533070, No. 20773143) and the Ministry of Science and Technology of China (MOST No. 2007CB815205). YG thanks the support by the Natural Science Foundation of China (NSFC, No.20673122).
References
- (1) P. Jungwirth and D. J. Tobias, Chem. Rev. 106, 1259 (2006).
- (2) P. Jungwirth, and D. J. Tobias, J. Phys. Chem. B 106, 6361 (2002).
- (3) M. Mucha, T. Frigato, L. M. Levering, H. C. Allen, D. J. Tobias, L. X. Dang, and P. Jungwirth, J. Phys. Chem. B 109, 7617 (2005).
- (4) T. M. Chang and L. X. Dang, Chem. Rev. 106, 1305 (2006).
- (5) P. Jungwirth and D. J. Tobias, J. Phys. Chem. B 105, 10468 (2001).
- (6) S. Gopalakrishnan, D. F. Liu, H. C. Allen, M. Kuo, and M. J. Shultz, Chem. Rev. 106, 1115 (2006).
- (7) B. C. Garrett, Science 303, 1146 (2004).
- (8) D. J. Tobias and J. C. Hemminger, Science 319, 1197 (2008).
- (9) P. Jungwirth and B. Winter, Ann. Rev. Phys. Chem. 59, 343 (2008).
- (10) P. Jungwirth, Faraday Discuss. DOI: 10.1039/b816684f (2009).
- (11) P. B. Petersen and R. J. Saykally, Chem. Phys. Lett. 397, 51 (2004).
- (12) P. B. Petersen, J. C. Johnson, K. P. Knutsen, and R. J. Saykally, Chem. Phys. Lett. 397, 46 (2004).
- (13) P. B. Petersen, R. J. Saykally, M. Mucha, and P. Jungwirth, J. Phys. Chem. B 109, 10915 (2005).
- (14) P. B. Petersen and R. J. Saykally, J. Phys. Chem. B 109, 7976 (2005).
- (15) P. B. Petersen and R. J. Saykally, J. Am. Chem. Soc. 127, 15446 (2005).
- (16) P. B. Petersen and R. J. Saykally, Annu. Rev. Phys. Chem. 57, 333 (2006).
- (17) D. F. Liu, G. Ma, L. M. Levering, and H. C. Allen, J. Phys. Chem. B 108, 2252 (2004).
- (18) C. Schnitzer, S. Baldelli, and M. J. Shultz, J. Phys. Chem. B 104, 585 (2000).
- (19) P. Viswanath and H. Motschmann, J. Phys. Chem. C 111, 4484 (2007).
- (20) P. Viswanath and H. Motschmann, J. Phys. Chem. C 112, 2099 (2008).
- (21) S. Gopalakrishnan, P. Jungwirth, D. J. Tobias, and H. C. Allen, J. Phys. Chem. B 109, 8861 (2005).
- (22) C. S. Tian, N. Ji, G. A. Waychunas, and Y. R. Shen, J. Am. Chem. Soc. 130, 13033 (2008).
- (23) H. T. Bian, R. R. Feng, Y. Y. Xu, Y. Guo, and H. F. Wang, Phys. Chem. Chem. Phys. 10, 4920 (2008).
- (24) E. A. Raymond and G. L. Richmond, J. Phys. Chem. B 108, 5051 (2004).
- (25) E. Sloutskin, J. Baumert, L. M. Ocko, I. Kuzmenko, A. Checco, L. Tamam, E. Ofer, T. Gog, O. Gang, and M. Deutsch, J. Chem. Phys. 126, 054704 (2007).
- (26) S. Ghosal, J. C. Hemminger, H. Bluhm, B. S. Mun, E. L. D. Hebenstreit, G. Ketteler, D. F. Ogletree, F. G. Requejo, and M. Salmeron, Science 307, 563 (2003).
- (27) B. Winter and M. Faubel, Chem. Rev. 106, 1176, (2006).
- (28) M. A. Brown, R. D’Auria, I-F. W. Kuo, M. J. Krisch, D. E. Starr, H. Bluhm, D. J. Tobias, and J. C. Hemminger, Phys. Chem. Chem. Phys. 10, 4778 (2008)
- (29) V. Padmanabhan, J. Daillant, L. Belloni, S. Mora, M. Alba, and O. Konovalov, Phys. Rev. Lett. 99, 086105 (2007).
- (30) I. Langmuir, J. Am. Chem. Soc. 39, 1848 (1917).
- (31) L. Onsager and N. N. T. Samaras, J. Chem. Phys. 2, 528 (1934).
- (32) A. W. Adamson, Physical Chemistry of Surfaces, (5th ed., John Wiley & Sons: New York, 1990).
- (33) V. S. Markin and A. G. Volkov, J. Phys. Chem. C 106, 11810 (2002).
- (34) E. M. Knipping, M. J. Lakin, K. L. Foster, P. Jungwirth, D. J. Tobias, R. B. Gerber, D. Dabdub, and B. J. Finlayson-Pitts, Science 288, 301 (2000).
- (35) A. Laskin, D. J. Gaspar, W. H. Wang, S. W. Hunt, J. P. Cowin, S. D. Colson, and B. J. Finlayson-Pitts, Science 301, 340 (2003).
- (36) J. H. Hu, Q. Shi, P. Davidocits, D. R. Worsnop, M. S. Zahniser, and C. E. Kolb, J. Phys. Chem. 99, 8768 (1995).
- (37) P. B. Miranda and Y. R. Shen, J. Phys. Chem. B 103, 3292 (1999).
- (38) Q. Du, R. Superfine, E. Freysz, and Y. R. Shen, Phys. Rev. Lett. 70, 2313 (1993).
- (39) M. J. Shultz, C. Schnitzer, D. Simonelli and S. Baldelli, Int. Rev. Phys. Rev. 19, 123 (2000).
- (40) G. L. Richmond, Chem. Rev. 102, 2693 (2002).
- (41) Y. R. Shen and V. Ostroverkhov, Chem. Rev. 106, 1140 (2006).
- (42) W. Gan, D. Wu, Z. Zhang, R. R. Feng, and H. F. Wang, J. Chem. Phys. 124, 114705 (2006).
- (43) Y. R. Shen, Nature 337, 519. (1989)
- (44) X. Zhuang, P. B. Miranda, D. Kim, and Y. R. Shen, Phys. Rev. B 59, 12632 (1999).
- (45) H. F. Wang, W. Gan, R. Lv, Y. Rao, and B. H. Wu, Int. Rev. Phy. Chem. 24, 191 (2005).
- (46) W. Gan, D. Wu, Z. Zhang, Y. Guo, and H. F. Wang, Chin. J. Chem. Phys. 19, 20 (2006).
- (47) M. J. Shultz, S. Baldelli, C. Schnitzer, and D. Simonelli, J. Phys. Chem. B 106, 5313 (2002).
- (48) N. Ji, V. Ostroverkhov, C. S. Tian, and Y. R. Shen, Phys. Rev. Lett. 100, 096102 (2008).
- (49) L. M. Levering, M. R. Sierra-Hernández, and H. C. Allen, J. Phys. Chem. B 111, 8814 (2007).
- (50) T. L. Tarbuck, S. T. Ota, and G. L. Richmond, J. Am. Chem. Soc. 128, 14519 (2007).
- (51) S. Baldelli, C. Schnitzer, and M. J. Shultz, Chem. Phys. Lett. 302, 157 (1999)
- (52) H. T. Bian, R. R. Feng, Y. Guo, and H. F. Wang, submitted to J. Chem. Phys. (2008)
- (53) W. K. Zhang, D. S. Zheng, Y. Y. Xu, H. T. Bian, Y. Guo, and H. F. Wang, J. Chem. Phys. 123, 224713 (2005).
- (54) W. K. Zhang, H. F. Wang, and D. S. Zheng, Phys. Chem. Chem. Phys. 8, 4041 (2006).
- (55) D. R. Lide, CRC Handbook of Chemistry and Physics (85th Edition, CRC Press, 2005).
- (56) X. Wei and Y. R. Shen, Phys. Rev. Lett. 86, 4799 (2001)
- (57) G. N. Patwari and J. M. Lisy, J. Chem. Phys. 118, 8555 (2003).
- (58) D. J. Miller and J. M. Lisy, J. Chem. Phys. 124, 024319 (2006).
-
Fig. 1
SSP SFG-VS spectra of the NaF and KF salt aqueous solution surfaces at different bulk electrolyte concentrations. Each panel presents the data measured on the same day, as accompanied by the SSP SFG-VS spectra of the neat air/water interface measured on that day. Clearly the salt effects on the SFG spectra in the 3000-3600cm-1 hydrogen-bonded water spectral region were quite different for the NaF and KF salts.
-
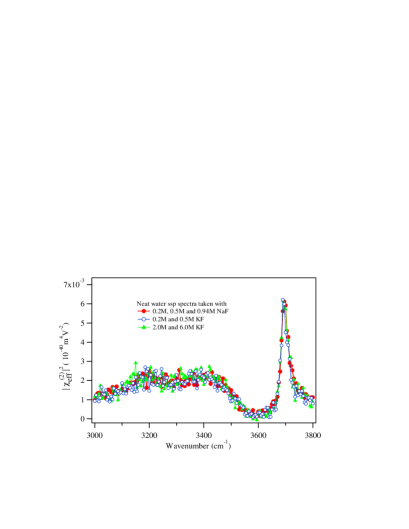
Fig. 2
Comparison of the three SSP SFG-VS spectra of the neat air/water interface in the Figure 1. These spectra were measured in different days and they agreed with each other quantitatively. Such good reproducibility of the air/water ssp SFG-VS spectra suggested that the differences in SFG spectra for the 0.2M and 0.5M NaF and KF solution surfaces as shown in the Figure 1 were real differences rather than possible experimental errors.