Specific Na+ and K+ Cation Effects on the Interfacial Water Molecules at the Air/Aqueous Salt Solution Interfaces Probed with Non-resonant Second Harmonic Generation (SHG)
Abstract
Here we report the polarization dependent non-resonant second harmonic generation (SHG) measurement of the interfacial water molecules at the aqueous solution of the following salts: NaF, NaCl, NaBr, KF, KCl, and KBr. Through quantitative polarization analysis of the SHG data, the orientational parameter D,(D=) value and the relative surface density of the interfacial water molecules at these aqueous solution surfaces were determined. From these results we found that addition of each of the six salts caused increase of the thickness of the interfacial water layer at the surfaces to a certain extent. Noticeably, both the cations and the anions contributed to the changes, and the abilities to increase the thickness of the interfacial water layer were in the following order: KBr NaBr KCl NaCl NaF KF. Since these changes can not be factorized into individual anion and cation contributions, there are possible ion pairing or association effects, especially for the NaF case. We also found that the orientational parameter D values of the interfacial water molecules changed to opposite directions for the aqueous solutions of the three sodium salts versus the aqueous solutions of the three potassium salts. These findings clearly indicated unexpected specific Na+ and K+ cation effects at the aqueous solution surface. These effects were not anticipated from the recent molecular dynamics (MD) simulation results, which concluded that the Na+ and K+ cations can be treated as small non-polarizable hard ions and they are repelled from the aqueous interfaces. These results suggest that the electrolyte aqueous solution surfaces are more complex than the currently prevalent theoretical and experimental understandings.
I Introduction
Recently, aqueous solution surfaces of simple electrolytes have attracted much attention for its importance in the broad chemical, environmental and biological processes at the molecular interfaces and membranes.AllenChemRev ; GarrettScience ; TobiasScience08 ; TobiasChemRev ; JungwirthARPC ; JungwirthFaraday2009 Conventionally, it has been widely believed that the aqueous solution surfaces were empty of ions. This classical picture was based on the macroscopic surface tension measurement of the electrolyte solutions, and was theoretically described by the negative excess of the ions from the thermodynamic Gibbs adsorption equation, as well as the microscopic image charge repulsion theory.AdamsonBook ; OnsagerJCP528 Recently, new findings in the atmospheric chemical research, direct surface measurement techniques and molecular dynamics (MD) simulations have challenged this classical picture of ions depletion at the electrolyte solution surface region since Gibbs and Onsager.HuJPC8768 ; GhosalScience ; TobiasScience ; AllenChemRev ; TobiasChemRev ; SaykallyARPS ; BianPCCP
Consequently, theoretical simulations and experimental techniques have been employed to provide answers to the two equally important questions about the electrolyte aqueous solution surface. One is how the anions and cations are spatially distributed in the surface region, and the other is how the interfacial water molecules are affected by this ion distribution. To answer the former question requires techniques which can directly measure the presence and profile the depth of the ion distribution at the liquid surface; while to answer the later requires techniques which can directly measure the presence and change of the interfacial water molecules. The convergence of and the correlation between the two answers may provide a through picture for the understanding of the electrolyte aqueous solution surface. The fact is that the conclusions of most of the recent theoretical and experimental studies converged on the picture that the anions, especially the larger and more polarizable anions, are presented at the interfacial region of various simple inorganic salt solutions.
Molecular dynamics (MD) simulation results using the polarizable force fields concluded for significant enrichment of the anions, such as the larger and more polarizable I- and Br-, at the interfacial region.TobiasChemRev ; TobiasFeatureArticle6361 ; Tobias7617 ; DangChemRev ; Tobias10468 MD simulation also revealed that the anions and cations should be segregated for the electrolytes consist of more polarizable anions at the electrolyte aqueous solution surface, with the double layer structure in which the anions enriched at the top surface layer and the cations resided below.JungwirthARPC Except for some voices of discontent,Richmond5051 ; SloutskinJCP054704 the majority of the experimental studies on the electrolyte aqueous solution surfaces, including the studies with X-ray photoelectron spectroscopy (XPS),GhosalScience ; WinterChemRev2006 X-ray fluorescencePadmanabhanPRL086105 and nonlinear optical spectroscopy techniques, such as the resonant second harmonic generation (resonant SHG)SaykallyCPL51 ; SaykallyCPL46 ; Saykally10915 ; Saykally7976 ; SaykallyJACS ; SaykallyARPS and sum-frequency generation vibrational spectroscopy, (SFG-VS)AllenSodiumHalide2252 ; ShultzJPCB585 ; Motschmann4484 ; Motschmann2099 ; AllenJPCB8861 ; ShenJACS13033 lent their support to this new physical picture with the more polarizable anions enriched at the electrolyte aqueous solution surface.
Since in this new picture the more polarizable anions are expected to be present at the electrolyte aqueous solution surface, while the small non-polarizable hard cations, such as Na+ and K+ etc., and anions, such as F-, are expected to be repelled from the aqueous solution surface, experimental studies have been focused mainly on either to prove the above conclusions,GhosalScience ; SaykallyCPL51 ; SaykallyCPL46 ; Saykally10915 ; Saykally7976 ; SaykallyJACS ; SaykallyARPS ; Motschmann4484 ; Motschmann2099 ; HemmingerPCCP4778 or to investigate the specific anion effects on the interfacial water molecules.AllenSodiumHalide2252 ; Richmond5051 ; AllenChemRev ; ShenYRPRL096102 ; BianPCCP Therefore, to our best knowledge, so far there has been no systematic investigation on the cation effects on the interfacial water molecules at the electrolyte aqueous solution surfaces.TobiasChemRev ; JungwirthARPC ; JungwirthFaraday2009
Recently, we developed and employed the surface sensitive non-resonant SHG technique to measure the polarization dependent SHG response from the interfacial water molecules at the NaF, NaCl, and NaBr salt solution surfaces.BianPCCP ; HongfeiPCCP In this study, in order to ensure measurement of small changes in the SHG signal, we first developed effective procedures to monitor and remove the impurities in the salt solution samples. Then, the quantitative polarization analysis of the measured SHG data showed that the average orientation of the interfacial water molecules changed slightly with the increase of the bulk concentration of the NaF, NaCl and NaBr salts from that of the neat air/water interface. The observed significant SHG signal increase with the bulk salt concentration was attributed to the overall increase of the thickness of the interfacial water molecular layer, following the order of NaBr NaCl NaF. The absence of the electric-field-induced SHG (EFISHG) effect indicated that the electric double layer at the salt aqueous solution surface is much weaker than that predicted from the molecular dynamics (MD) simulations. These results provided quantitative data to the specific anion effects on the interfacial water molecules of the electrolyte aqueous solution, not only for the larger and more polarizable Br- anion, but also for the smaller and less polarizable F- and Cl- anions.
The most intriguing thing in this study was that we were able to quantitatively measure weak concentration dependent F- anion effect of the NaF salt on the interfacial water molecules,BianPCCP even though this F- anion effect was expected to be insignificant from the recent MD simulations.TobiasChemRev ; HemmingerPCCP4778 This immediately led us to look at whether the F- anion effect of the KF salt aqueous solution surface can also be observed. Moreover, there is also one known advantage to investigate the KF aqueous solution because this can extend the bulk concentration range of the F- anion. The saturation solubility for NaF in water at 20∘C is only 0.98M (4.13g NaF per 100g water), while the saturation concentration in KF is 15.4M (89.8g KF per 100g water).CRCHandBook Surprisingly, we not only observed the significant F- anion effect of the KF salt aqueous solution surface up to much higher bulk concentration as expected, we also found that the orientational parameter of the interfacial water molecules went to the opposite direction to that of the NaF aqueous solution surface as the bulk concentration of NaF and KF salt increase. Therefore, we started doing experiment also on the surface of the KCl and KBr salt aqueous solutions, and we observed distinctive specific Na+ and K+ cation effects on the interfacial water molecules at the NaF, NaCl, NaBr, KF, KCl, and KBr salt solution surfaces.
In the following sections, we shall report the non-resonant SHG measurement and analysis of the specific Na+ and K+ cation effects on the interfacial water molecules at these six solution surfaces. We shall show that while the thickness of the interfacial water layer at the surfaces of all the six salt solutions increases as the bulk concentration increase, the orientational parameter D values of the interfacial water molecules changed to opposite directions for the aqueous solutions of the three sodium salts versus the aqueous solutions of the three potassium salts. Moreover, the abilities to increase the thickness of the interfacial water layer were found to be in the following order: KBr NaBr KCl NaCl NaF KF. These specific Na+ and K+ cation effects, as well as the F-, Cl- and Br- anion effects, indicate that the electrolyte aqueous solution surfaces are likely to be more complex than what the currently prevalent theoretical and experimental understandings can offer.
II Theoretical background for the SHG data treatment
The theoretical tools used in this report shall fully follow the detailed description in the previous published paper, since this work is an extension from the previous study.BianPCCP Here we only present what is necessary to understand the analysis of the SHG data in this report.
The SHG intensity reflected from the electrolyte aqueous interface is given byRaoYiJCP ; ShenZhuangPRB ; ZhengDSIRPC2008
| (2.1) |
Here is the incoming laser intensity, is the speed of the light in the vacuum, is the incident angle from the surface normal, defined as axis in the laboratory coordinates system , is the refractive index at the frequency of the medium in which the laser beam propagates. is the effective macroscopic second order susceptibility. In the SHG experiment, because there are only one incident laser beam and one out-going signal beam, there are three independent polarization combinations for the : namely the s-in/p-out (), the -in/s-out () and the p-in/p-out (). Here denotes the polarization in the incident plane, while the polarization perpendicular to the incident plane. With the microscopic local-field factors incorporated implicitly into the tensorial Fresnel factor s, the s areShenZhuangPRB ; ZhengDSIRPC2008
| (2.2) | |||||
in which the s are the seven non-zero susceptibility tensors, i.e. , , , of the rotationally symmetric interface along the interface normal , with in the incident plane.
In the SHG measurement, the polarization is usually fixed at either or , while the polarization angle of the incident laser beam is varied for the full using a half waveplate. Then, one hasZhangWKJCP224713 ; HongfeiPCCP
| (2.3) |
In the case of non-resonant SHG, each of the , and terms is real, and their relative values can be obtained from fitting the experimental data with the Eq.2.3 by knowing the relative signs between them. The relative signs can be determined with the measurement of the SH signal in the polarization as described elsewhere.HongfeiPCCP It was also shown that using the Eqs.2.3, , and terms can be most accurately determined from the polarization dependent SHG data.HongfeiPCCP
In the previous study, we showed that the contributions from the ions and from the electric field induced SHG were negligible for the non resonant SHG signal from the electrolyte aqueous solution surface. Therefore, only the contribution from the interfacial water molecules need to be considered. For molecules with the symmetry, such as the water molecule, there are seven nonzero microscopic polarizability tensor elements in molecular coordinates system : namely, and , with and for the SHG process. When the optical frequency is far below the resonance, is usually negligible, by defining ), one has,ZhangWKJCP224713 ; HongfeiPCCP
| (2.4) |
Here is the orientational parameter with as the tilt angle of the water dipole axis from the interface normal, denotes the ensemble average over the whole orientational distribution. Because the two ratios and can be accurately obtained from the polarization SHG measurement, the and values can be readily obtained with good accuracy, using the Eqs.2.4.ZhangWKJCP224713 ; HongfeiPCCP
Now with the orientational parameter known, the relative number of water molecules contributing to the measured SHG signal from the interface of the different electrolytes as well as different electrolyte concentrations can be calculated from the changes of the corresponding SHG intensities. Simply to put it,
| (2.5) |
Here is the interfacial number density of the water molecule, is the average effective susceptibility per molecule. Here can also be written into the per molecule orientational functional , which is directly related to the orientational parameter D.RaoYiJCP ; HongfeiPCCP
III Experimental details
The procedures to pretreat the salt sample and purify the salt solution were described in detail previously and should be referred when in doubt.BianPCCP The necessary experimental detail and the information for sample preparation are described below.
III.1 SHG measurement
The SHG experimental setup is as in the previous reports.ZhangWKJCP224713 ; RaoYiJCP ; BianPCCP A broadband tunable mode-locked femtosecond Ti:Sapphire laser (Tsunami 3960C, Spectra-Physics) is used for the reflected-geometry SHG measurement. Its high-repetition rate (82 MHz) and short pulse width (80 fs) make it suitable for detection of the weak second-harmonic signals. Its long term power and pulse-width stability also make it easy for quantitative analysis of the SHG data.RaoYiJPCA7987 The 800 nm fundamental laser beam is focused on the solution interface at the incident angle of =70∘, and the SHG signal at 400 nm is detected with a high-gain photomultiplier tube for single photon counting (R585, Hamamatsu) and a photon counter (SR400, Stanford Research Systems). Typically the dark noise level is less than 1 counts/s, better than reported previously.ZhangWKJCP224713 The typical laser power is 500 mW. The efficiency of the detection system for the p polarization is 1.23 times of that for the s polarization. A cylindrical Teflon beaker (50x6mm) is used to host the solution. The optical polarization control and the SHG data acquisition are programmed and collected with a PC. It takes about 150s to 300s to collect the polarization curve. The room temperature is controlled at 22.01.0∘C, and the humidity in the room is controlled around 40.
III.2 Sample preparation
In the experiments, the liquid water was purified with a Millipore Simplicity 185 () from double distilled water. The KF, KCl and KBr used were purchased from the Sigma-Aldrich (ACS reagent grade, purity). Before the preparation of the salt solution, the salts were baked at around for more than 6 hours in order to remove the organic impurities. The glassware was cleaned with hot chromic acid and then rinsed with Millipore water for several times. The solutions were filtered with a syringe with a 0.22m membrane filter made of PVDF material by Millipore (Durapore GVWP01300) to remove the possible insoluble particles existing in the solution. The SFG-VS spectral and SHG fluctuation measurement are used to monitor the contaminates.
IV Results and Discussion
IV.1 Quantitative analysis of the polarization dependent non-resonant SHG data
In the previous study,BianPCCP we showed that the non-resonant SHG signal from the aqueous solution surface of simple electrolytes was originated from the surface water molecules, and the contribution from the surface ions was negligible. We also showed that the contribution to the non-resonant SHG signal through the electric field induced second harmonic generation (EFISHG) mechanism possibly from the surface potential due to the surface charge separation was negligible. Careful sample treatment and purification procedures were also developed to ensure data reproducibility. Here we just followed the experimental and data analysis procedures established in the previous literature, from which the accuracy and reproducibility of the non-resonant SHG data and the quantitative analysis of the SHG data were assured.BianPCCP ; HongfeiPCCP
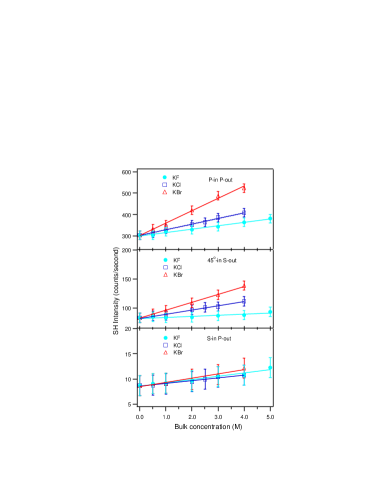
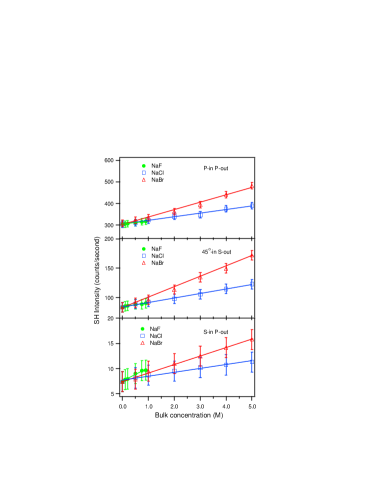
Fig. 1 shows the non-resonant SHG intensities for the NaF, KF, NaCl, KCl, NaBr and KBr solution surfaces in the three independent polarization combinations, i.e. p-p, 45∘-s and s-p polarization combinations, at different concentrations. The data for the NaF, NaCl and NaBr were published in our previous work.BianPCCP The saturation concentrations of KF, KCl and KBr at the 20∘C are 15.4M (89.8g KF per 100g water), 4.6M (34.2 g KCl per 100g water), and 6.3M (65.3g KBr per 100g water), respectively.CRCHandBook In comparison, the saturation concentration of the NaF, NaCl and NaBr at 20∘C are 0.98M(4.13 g NaF per 100 g water), 6.2 M (36.0 g NaCl per 100 g water), and 9.2 M (94.6 g NaBr per 100 g water).CRCHandBook As mentioned above, the large saturation concentration for KF enabled us to go to higher bulk concentration with the F- anion by using the KF salt; while with the NaF, the saturation concentration is only 0.98M. In the experiment, the highest bulk concentration for KF, KCl, and KBr are 5M, 4M and 4M, respectively.
It is clear from the Figure 1 that for all the salts, the SHG signal increased almost linearly with the increase of the bulk electrolyte concentration, and the general behaviors for the potassium salts are similar to those of the sodium salts, with the biggest slope for the KBr and smallest slope for the KF. Therefore, this suggests that similar to the NaF, NaCl and NaBr salts,BianPCCP ; AllenSodiumHalide2252 KF, KCl and KBr salts also resulted in the increase of the thickness of the interfacial water molecular layer. However, a closer examination of the SHG data revealed apparent differences between the NaF/KF, NaCl/KCl and NaBr/KBr pairs, indicating non-negligible specific Na+ and K+ cation effects on the non-resonant SHG signal of the interfacial water molecules. For example, in the Figure 1, the slopes of the increase of the p-p signal for the KF, KCl and KBr are larger than the slope for the NaF, NaCl and NaBr, respectively; while for the 45∘-s and s-p data showed completely the opposite trend. This relative differences between the intensities of different polarization combinations usually indicate possible differences of orientational order of the surface molecules contributing to the SHG signal.RaoYiJCP ; HongfeiPCCP ; ShenZhuangPRB
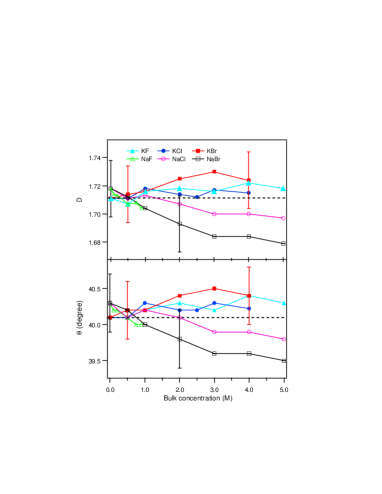
The differences of the orientational order parameter D values are clearly presented in the Figure 2. The D values were obtained by using Eqs. 2.2 and Eqs. 2.4, and the calculated results for the KF, KCl and KBr solutions are listed in the table 1. In the table 1, the calculated molecular polarizability ratio ) values for all three salts at different bulk concentrations were all the same within the small error bar as the value calculated from the SHG data for the neat air/water interface.ZhangWKJCP224713 These values are also the same as those obtained for the NaF, NaCl and NaBr aqueous solution surfaces as reported previously.BianPCCP This further confirmed that the assumption that the non-resonant SHG observed from the KF, KCl and KBr aqueous solution surfaces were indeed from the interfacial water molecules. The D and values for the NaF, NaCl and NaBr aqueous solution surfaces, which were published previously,BianPCCP are also plotted in the Figure 2 for comparison. Even though the D values only changed slightly at different bulk salt concentration, the difference is clearly bigger than the error bar as the bulk salt concentration increase. It is interesting to see that the D values for the potassium salt series are apparently larger than the D values for the sodium salt series. This also confirms the qualitative surmise above based on the different trends for the polarization dependence of the non-resonant SHG signal for the KX (X=F, Cl or Br) salt series and the NaX salt series.
In the Figure 2, the value is the apparent average tilt angle between the dipole vector of water molecule and the surface normal calculated using the assumption of a distribution function for this tilt angle. The assumption for a distribution function of is certainly not correct. However, as discussed intensively in the literature, because within a certain range of the width for the orientational distribution, this value can be used to represent the center value for the orientational distribution and can be used to simulate the orientational dependent total SHG susceptibility, i.e. the orientational functional .RaoYiJCP ; GanWeiJPCCEthanol ; WangIRPC This point shall be further illustrated below.
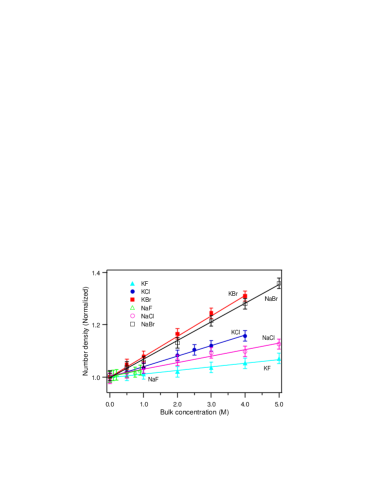
With the orientational parameter known, the relative surface density of the interfacial water molecules which contribute to the measured non-resonant SHG signal can be readily calculated using the Eqs. 2.5 These values for the KX salts are also listed in the Table 1. Figure 3 shows the values for the NaF, KF, NaCl, KCl, NaBr, and KBr salt aqueous solution surfaces. The values for the three NaX salts are the same as from the previously published results.BianPCCP It is clear the for each salt increases almost linearly with the bulk salt concentration. As discussed previously,BianPCCP since the probing area of the laser is the same, the increase of the represents the increase of the average depth of the water molecules in the interfacial region which contributes to the non-resonant SHG signal. Now we can fit the versus the bulk concentration of each of the salts data with a linear function of . Here = 1 denotes the surface density of the neat air/water interface, is the bulk salt concentration, and the slope represents the ability to increase the thickness of the surface water molecules. The fitting results of values are listed in the Table 2. The unit for is M-1.
According to the values in the Table 2, the abilities to increase the surface water thickness for the six salts follow the following order: KBr NaBr KCl NaCl NaF KF. Clearly, both the anions and cations contributes to the increase of . In the previous study with the NaF, NaCl and NaBr salts, the order was NaBr NaCl NaF, and mostly the effect was attributed to the ability to be polarized for the larger anions. However, here we clearly have KBr KCl KF, and one can also conclude that even though there are differences on the abilities to increase the aqueous surface thickness for the individual ions, the abilities for the cations and anions are generally with comparable order of magnitudes. Therefore, the cation effects can no longer be ignored. These findings on the specific anion and cation effects from the quantitative analysis of the non-resonant SHG data imply that the electrolyte aqueous solution surface can be more complex than previously thought.
IV.2 The structure and reorientation of the interfacial water molecules at the electrolyte solution surfaces
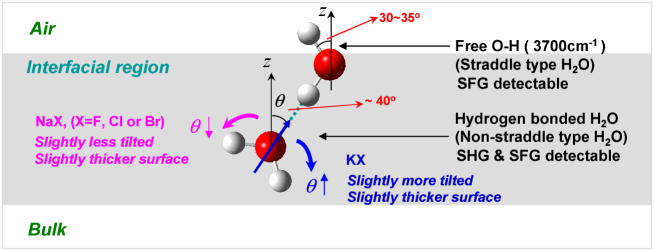
There have been many theoretical and experimental studies on the structure of the interfacial water molecules. The vibrational spectral feature around 3700cm-1 of the free O-H stretching vibration was first observed by Shen and co-workers in 1993 using the surface specific sum frequency generation vibrational spectroscopy (SFG-VS).ShenYRPRL2313 Subsequent SFG-VS experimental studies and quantitative analysis further concluded that this water molecule with the free O-H straddles across the air/water interface with its dipole vector almost parallel to the interface, i.e. on average the free O-H tilted from the surface normal around 30-35∘.RichmondChemRev2002 ; ShenChemRev2006 ; GanWeiJCP114705 ; GanWeiCJCP20 ; TyrodeJPCB329 This latter conclusion was also supported by molecular dynamics (MD) and Monte Carlo (MC) simulations.Wilson4873 ; YangF109 ; Benjamin2083 ; Besseling11610 ; Taylor11720 ; Sokhan625 ; Fradin871 ; Morita371 ; Perry8411 ; Kuo658 ; Jaqaman926 SFG-VS experiment also revealed that the SFG spectra in the 3200-3600cm-1 region were from the contributions of the hydrogen bonded water molecules slightly below the topmost water layer at the air/water interface, and these water molecules had both of their hydrogen atoms hydrogen bonded.ShenYRPRL2313 ; GanWeiJCP114705 These are the non-straddle-type water molecules at the air/water interface, and the SHG signal from the air/water interface comes mainly from the non-straddle-type water molecules.ZhangWKJCP224713
The SFG-VS studies by Allen and Richmond and their co-workers on the NaF, NaCl, NaBr and NaI aqueous solution surfaces concluded that the free O-H spectra was almost undisturbed with the addition of the salts, while the hydrogen bonded water spectra were variously affected.AllenSodiumHalide2252 ; Richmond5051 Using the more informative phase-sensitive sum-frequency spectroscopy technique, Shen et al. recently investigated the hydrated I- anion effects on the interfacial water structure.ShenYRPRL096102 Their conclusion was that the presence of I- anion near the interface region may not disturb the water molecular structure at the topmost surface layer, while it can reorient the water molecular in the subphase. These conclusions are consistent with our non-resonant SHG results on the interfacial water molecules at these electrolyte aqueous solution surfaces. Moreover, our SHG results provides not only quantitative measurement on the slight reorientation of the interfacial water molecules, but also quantitative measurement on the increase of the average thickness of the interfacial water layer, for the electrolyte aqueous solution surfaces.
Here we would like to further discuss the different reorientation effects on the interfacial water molecules by the different anions and cations.
Firstly, the change of the values of the orientational parameter D in the whole bulk concentration range is small. If we do not compare the results for the KX series with the NaX series, we may conclude that there is essentially no apparent change of the D values for the KX series. This indicates that the reorientation effect for the KX series is rather insignificant. Therefore, the significant increase of the SHG signal is essentially not the result of water molecule reorientation.
Secondly, from the Figure 2, the direction of the reorientation effect is mainly determined by the Na+ and K+ cations, instead of the anions. This finding is intriguing because neither the classical picture nor the recently revised picture can be used to predict this significant cation effect. In the classical theory, both the anion and cations are thought to be repelled from the aqueous solution surface. The recent MD simulations which predicted enrichment of more polarizable anions also negated the presence of the non-polarizable cations, as well as the non-polarizable anions, at the aqueous solution surface.TobiasChemRev The results here suggested that probably even for the much less polarizable cations and anions can still be present or enriched at the interface region. It is probable that in order to keep the neutrality of the anion enriched interface region, more cations are attracted to the surface region. This picture is certainly consistent with the fact we reported previously that there was insignificant EFISHG contribution to the total SHG signal.BianPCCP However, in order to find reconciliation with the current picture of charge segregation from the MD simulation results, much effort are still needed.
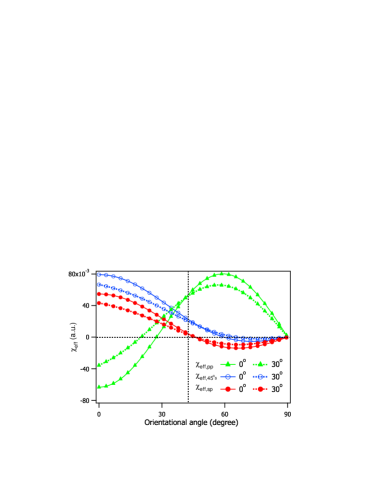
With the known R values, the orientation dependent per molecule values in different polarization combinations can be simulated using the Eqs.2.2 and Eqs.2.4. When the value was known, the value relative to the neat air/water interface value can be calculated with the Eqs.2.5. Comparison of these two values can help us understand how the SHG signal changes with the averaged molecular orientation of the water molecules at the electrolyte aqueous solution surfaces. Figure 4 shows the simulation results of the values in the p-p, 45∘-s and s-p polarization combinations using R=0.69 and =1. From the curves in the Figure 4, we can see that if the average orientation angle becomes slightly larger than the neat air/water interface value =40.1∘, the value shall become larger, while the and values shall become smaller. This is indeed the case for the KF, KCl and KBr aqueous solution surfaces from the SHG measurement. On the other hand, if the average orientation angle becomes slightly smaller than the neat air/water interface value =40.1∘, the value shall become smaller, while the and values shall become larger. This latter case is consistent with the SHG data for the NaF, NaCl and NaBr aqueous solution surfaces.
In the Figure 4, we also presented the simulation of the values when the orientational distribution function is not the function. It is clear that when the full width at the half maximum (FWHM) of the orientational distribution function is 30∘, the trend of dependent change of each component remained the same in the vicinity of =40.1∘. For example, just like the distribution case, when the average orientation angle becomes slightly larger than the neat air/water interface value =40.1∘, the value shall become larger, while the and values shall become smaller. Our simulation further demonstrated that as long as FWHM does not exceed 65∘, this trend shall remain the same. Therefore, the conclusions that the NaX salt series slightly reorient the interfacial water molecules to smaller average tilt angle and the KX salt series slightly reorient the interfacial water molecules to larger average tilt angle remained unaffected when the orientation of the interfacial water molecules possess a broad range of distribution width. This is another example to illustrate that in the polarization and orientation analysis of SHG, as well as SFG, the orientational order can be understood even though the orientational distribution is in a broad range.GanWeiJPCCEthanol Thus, the small shift of the average orientation of the interfacial molecules, as representatively shown in the Figure 5, can be accurately determined through polarization and orientational analysis of the SHG/SFG data.
The unexpected specific cation effect on the reorientation of the interfacial water molecules by the Na+ and K+ cations as determined here indicates complex interactions between the ions and the water molecules at the electrolyte aqueous solution surfaces. It is rather surprising to see that even though the F-, Cl- and Br- anions influenced the extent of the reorientation effect, they do not control the direction of the reorientation. These are surprising results from our current understandings on the ion adsorption to the aqueous surfaces.
Based on these different cation effects on the hydrogen bonded water molecules in the surface region, we surmised that there might be some observable effects on the hydrogen bonding O-H vibrational spectra for these interfacial water molecules. This prompted us to measure the SFG vibrational spectra of the interfacial water molecules in the 3000-3800cm-1 region at the NaF and KF aqueous solution surfaces. The SFG-VS spectra of the NaF aqueous solution surfaces have been investigated by various research groups. However, these data were not quite consistent with each other.AllenSodiumHalide2252 ; AllenChemRev ; Richmond5051 ; BianPCCP Moreover, to our knowledge, there has been no SFG-VS measurement in the literature on the water molecules at the KF aqueous solution surface, partly because the cation effects between the Na+ and K+ on the surface water molecules were expected to be negligible in the best of the current understandings.TobiasChemRev ; HemmingerPCCP4778 ; TobiasFeatureArticle6361
We measured and quantitatively analyzed the SFG-VS spectra of the neat air/water interface and other water surfaces in the past few years.GanWeiCJCP20 ; GanWeiJCP114705 ; ZhangZhenPCCP Based on these successful experiences, we measured the SFG-VS spectra of the NaF and KF aqueous solution surfaces at different bulk concentrations. We found that the NaF water SFG-VS spectra were consistent with the reported spectra by the Richmond group,Richmond5051 ; BianPCCP and we also observed distinctive differences in the hydrogen bonding O-H stretching region in 3000-3600cm-1 for the NaF and KF aqueous solution surfaces. These results firmly confirmed the specific cation effects between the Na+ and K+ as measured with non-resonant SHG in this work. The specific ion effects on the orientation of the free O-H group of the straddle type surface water can be more subtle. Since SHG is not sensitive to the straddle type of surface water molecules, further polarization dependent SFG-VS spectra measurement and analysis have been conducted. The SFG-VS results on the specific cation effects, especially the Na+ and K+ cations, shall be reported elsewhere.FengRanRanManuscript
IV.3 Complexities of the specific anion and cation effects on the interfacial water molecules
With the data on the NaF, NaCl, NaBr, KF, KCl, and KBr solutions, and with both the specific anion and cation effects established, more detailed comparison between the anion and cation effects on the interfacial water molecules can be explored.
In the bulk solution, the anion and the cation interactions with water molecules can influence the macroscopic properties of water,KunzCOCI2004 ; RecordJPCB5411 such as the surface tensionCollinsQRevBiophys and the viscosity.BinghamJPC885 The hydrated ions effects on the hydrogen bonded networks in the bulk water are the key questions people want to understand.KunzCOCI2004 For a long time, the qualitative Hofmeister series first proposed more than a century ago were used to explain the ion effects on forming and breaking of hydrogen bonds in the aqueous phase.CollinsQRevBiophys ; CacaceQRevBiophys ; FranKJCP507 It has been believed that anions have more pronounced effects on the water structure than the cations.CollinsQRevBiophys In the mean time, different cations can also influence the structure of water molecules. For example, the different behaviors of Na+ and K+ cations play important roles in many biochemical processes, such as in the ion channels crossing the biological membranes. Studies showed that these different behaviors were largely due to their different hydration number and hydration free energies.RutgersTFS2184 ; LisyJCP8555 ; LisyJCP024319 ; CarrilloTrippJCP118p7062 Recently, using SFG vibrational spectroscopy, Cremer and co-workers investigated the ion effects on the water molecules at the polymer surfactant aqueous interfaces.CremerJACS10522Hofmeister ; CremerJACS12272IonEffect In these studies, significant anion effects and insignificant cation effect were observed.
From the Hofmeister series in the bulk, the Na+ cation was traditionally called the ‘structure making’ cation, while the K+ cation was considered ‘structure breaking’ to some extent.CollinsQRevBiophys Using the mixed quantum mechanical (QM) and molecular mechanical (MM) simulation, Tongraar et al. reported that the Na+ cation can order the structure of solvent molecules beyond the first hydration shell, while K+ cannot go beyond the first hydration shell.TongraarJPCA10340 So it was argued that the Na+ be recognized as the ‘structure-making’, while K+ be ‘structure-breaking’. Mancinelli et al. showed that water molecules are more orientationally disordered around the K+ ion than the Na+ ion.Mancinelli13570 On the other hand, Saykally et al. used the X-ray absorption spectroscopy and showed that the dissolved monovalent cations like Na+ and K+ did not have significantly different effects on the nature of hydrogen bonds around these ions.Saykally5301 Otma et al. found, using the femtosecond pump-probe spectroscopy, that the presence of ions does not lead to an enhancement or a breakdown of the hydrogen-bond network in liquid water.Omta347 There is still no consensus regarding the ions effects on the hydrogen bond network of the water molecules.
In the non-resonant SHG results, the KX series slightly increased the orientational parameter D value of the interfacial water molecules, while the NaX series slightly decreased the D value. The larger its averaged D value, the more possibly tilted or disordered the interfacial water molecules. This seems to suggest that the Na+ cation is ‘structure-making’, while the K+ is ‘structure-breaking’. However, in the bulk Hofmeister series, F- was usually considered ‘structure making’, while the Cl- and Br- ‘structure breaking’. If judged with the change of D values, this seemed to work for the KX salt series, but totally to the opposite for the NaX series, as shown in Figure 2. Therefore, we can only conclude that the ion effects at the electrolyte aqueous solution surfaces as observed in the non-resonant SHG measurement may be more complex than the Hofmeister series can qualitatively explain.
One example of the possible complexities is that further examination of the (slope) values in the Table 2 suggested that the anions and cations may associate in some cases, especially for the NaF aqueous solution surface. If there is no anion and cation association at the interface, the values in the Table 2 should be able to factorize into ion specific additive factors. This can be achieved easily for the values for the KF, KCl, KBr, NaBr and NaCl without considering the value for the NaF. NaF stands out not only in this, but also in its saturation concentration (less than 1M), which is far smaller than the other five salts (all larger than 4.5M or more). It has been long known that the F- is significantly different from the larger Cl- and Br- ions in terms of interactions with the water molecule.TobiasChemRev However, there are huge differences between the saturation solubility of the LiF (0.10M, or 0.27g LiF per 100g water), NaF(0.98M, or 4.13g NaF per 100g water) and KF (15.4M, or 89.8g KF per 100g water) in water at 20∘C. In comparison, the saturation solubilities for the chloride and bromide salts of these three cations are not so different.CRCHandBook These facts suggest that such differences are most possibly due to the pairing or association of the related anion and cation, since no single ion effect can explain their differences. In the Table 2, the value of the NaF clearly stood out of the other five salts including KF. Similar to the explanation for their bulk solubilities, this is also most likely due to the Na+ and F- ion pairing or association, instead of the property of the F- anion alone.
Ion pairing is most likely to be found in aqueous solutions at high bulk concentration. For example, a 5M monovalent salt solution has less than six water molecules for each ion in the solution. In order to fully solvate an ion in the solvation shell, usually six water molecules are needed.TongraarJPCA10340 ; LisyJCP024319 ; LisyJCP8555 ; CarrilloTrippJCP118p7062 At such high bulk concentration as 5M the cations and anions are very close to each other. However, our SHG data of the five salts KF, KCl, KBr, NaBr and NaCl did not show the same ion pairing or association effects as the NaF salt. Therefore, ion pairing or ion association can not be simply defined by the average distance between the cations and anions even at high bulk concentrations.
In the end, we have to realize that all the effects as measured with the non-resonant SHG, i.e. the increase of the average thickness of the interfacial water layer, as well as the shift of the averaged orientational angle of the surface water molecules, are really small. The increase of the thickness of the surface water layer is most significant for the NaBr and KBr aqueous solutions. The increase is only less than 30 for the 5M NaBr salt solution (Figure 3). This increase is much smaller than the more than 100 thickness increase value for the 2.0M (0.036 molar fraction) NaBr solution surface estimated using the relative Raman, IR and SFG intensities in the literature.AllenSodiumHalide2252 Increase of the surface water layer thickness requires more ions to be solvated in the surface water layer. Otherwise the surface concentration of the ions could not keep up with the bulk ion concentration. Therefore, in addition to the quantitative treatment in the non-resonant SHG, we surmise that the slight increases of the average water surface layer thickness as reported here are more acceptable. Furthermore, the average orientational parameter D for the surface water molecules also changed slightly for all the salt solutions studied (Figure 2). All these suggested that the ion effects on the surface water molecules were subtle effects. However, no matter how weak these effects were, the presence and direct interaction of the ions to the surface water molecules have been firmly established. These conclusions may add vindications to the recent interests on the specific ion effects at the air/water surfaces.TobiasChemRev ; WinterChemRev2006 ; JungwirthARPC
In the experimental studies on the reactive and non-reactive molecular beam scattering from the salty liquid solution surfaces, such as from the glycerol salt solution surfaces, various cation and anion effects have been observed.NathansonJPCC112p3008 ; NathansonJPCC111p15043 ; NathansonJPCB110p4881 Since molecular beam scattering would be difficult to be implemented for the more volatile liquids than the glycerol, such as water, it would be worthwhile to investigate the ion solvation and interactions at these non-aqueous liquid surfaces with the nonlinear optical techniques and to compare the results.
In summary, the specific ion effects on the surface water molecules at the electrolyte aqueous solution surfaces can be more complex than expected. Quantitative surface specific measurement such as the non-resonant SHG can be employed to help establishment of the detailed knowledge about these surfaces. Since the observed specific cation and anion effects on the surface water molecules are in the comparable magnitude, theoretical modeling and simulation efforts are called upon to understand these unexpected cation effects for the Na+ and K+ ions, as well as the unexpected anion effects for the F- ions, which are usually considered to be repelled from the aqueous solution surface.
V Conclusion
In this report, using the procedures for sample control and quantitative SHG data analysis, we studied the non-resonant SHG from the water molecules at the aqueous solution surfaces of the following monovalent salts: NaF, NaCl, NaBr, KF, KCl, and KBr. In addition to the F-, Cl- and Br- anion effects as reported in our previous report, the specific Na+ and K+ cation effects on the interfacial water molecules are also clearly and quantitatively identified for the first time.
Through quantitative polarization analysis of the non-resonant SHG data, we found that the orientational order parameter D of the water molecules at the interfacial region changed in different direction for the NaX (X=F, Cl, or Br) series versus the KX series salts. The average orientation angle of the dipole vector of the water molecules at the NaX aqueous solution surfaces changed slightly to the smaller tilt angle from the surface normal in comparison to that of the neat air/water interface; while for the KX series, the average orientation angle changed slightly to the larger tilt angle. This seems to suggest that the Na+ cation is more “structure-making”, while the K+ is more “structure-breaking”. The relative ability for the different salts to increase the average thickness of the interface water layer was also quantitatively determined for the six salts. We found that these values can be factorized into simple additive values for the NaCl, NaBr, KF, KCl, and KBr salts except for the NaF. This indicated that ion pairing or association effects for the Na+ and F- ions should be much stronger than the cation and anion in the other five salts.
Specific Na+ and K+ cation effects can also be observed in the SFG-VS spectra of the interfacial water molecules at the NaF and KF aqueous solution surfaces.FengRanRanManuscript These results on the specific cation and anion effects suggest that the electrolyte aqueous solution surfaces can be more complex than the currently prevalent theoretical and experimental understandings. Since the observed specific cation and anion effects on the surface water molecules are in comparable order of magnitudes, theoretical modeling and simulation efforts are called upon to understand these unexpected cation effects for the Na+ and K+ ions, as well as the unexpected anion effects for the F- ions, which are usually considered to be repelled from the aqueous solution surface.
Acknowledgment: HTB thanks the technical assistance from De-sheng Zheng, Yan-yan Xu and An-an Liu. HFW thanks the support by the Natural Science Foundation of China (NSFC, No.20425309, No.20533070, No. 20773143) and the Ministry of Science and Technology of China (MOST No. 2007CB815205). YG thanks the support by the Natural Science Foundation of China (NSFC, No.20673122).
References
- (1) B. C. Garrett, Science 303, 1146 (2004).
- (2) S. Gopalakrishnan, D. F. Liu, H. C. Allen, M. Kuo, and M. J. Shultz, Chem. Rev. 106, 1115 (2006).
- (3) P. Jungwirth and D. J. Tobias, Chem. Rev. 106, 1259 (2006).
- (4) D. J. Tobias and J. C. Hemminger, Science 319, 1197 (2008).
- (5) P. Jungwirth and B. Winter, Ann. Rev. Phys. Chem. 59, 343 (2008).
- (6) P. Jungwirth, Faraday Discuss. DOI: 10.1039/b816684f (2009).
- (7) A. W. Adamson, Physical Chemistry of Surfaces, (5th ed., John Wiley & Sons: New York, 1990).
- (8) L. Onsager and N. N. T. Samaras, J. Chem. Phys. 2, 528 (1934).
- (9) J. H. Hu, Q. Shi, P. Davidocits, D. R. Worsnop, M. S. Zahniser, and C. E. Kolb, J. Phys. Chem. 99, 8768 (1995).
- (10) E. M. Knipping, M. J. Lakin, K. L. Foster, P. Jungwirth, D. J. Tobias, R. B. Gerber, D. Dabdub, and B. J. Finlayson-Pitts, Science 288, 301 (2000).
- (11) S. Ghosal, J. C. Hemminger, H. Bluhm, B. S. Mun, E. L. D. Hebenstreit, G. Ketteler, D. F. Ogletree, F. G. Requejo, and M. Salmeron, Science 307, 563 (2003).
- (12) B. Winter and M. Faubel, Chem. Rev. 106, 1176 (2006).
- (13) P. B. Petersen and R. J. Saykally, Annu. Rev. Phys. Chem. 57, 333 (2006).
- (14) H. T. Bian, R. R. Feng, Y. Y. Xu, Y. Guo, and H. F. Wang, Phys. Chem. Chem. Phys. 10, 4920 (2008).
- (15) P. Jungwirth and D. J. Tobias, J. Phys. Chem. B 106, 6361 (2002).
- (16) M. Mucha, T. Frigato, L. M. Levering, H. C. Allen, D. J. Tobias, L. X. Dang, and P. Jungwirth, J. Phys. Chem. B 109, 7617 (2005).
- (17) T. M. Chang and L. X. Dang, Chem. Rev. 106, 1305 (2006).
- (18) P. Jungwirth and D. J. Tobias, J. Phys. Chem. B 105, 10468 (2001).
- (19) E. A. Raymond and G. L. Richmond, J. Phys. Chem. B 108, 5051 (2004).
- (20) E. Sloutskin, J. Baumert, L. M. Ocko, I. Kuzmenko, A. Checco, L. Tamam, E. Ofer, T. Gog, O. Gang, and M. Deutsch, J. Chem. Phys. 126, 054704 (2007).
- (21) V. Padmanabhan, J. Daillant, L. Belloni, S. Mora, M. Alba, and O. Konovalov, Phys. Rev. Lett. 99, 086105 (2007).
- (22) P. B. Petersen and R. J. Saykally, J. Phys. Chem. B 109, 7976 (2005).
- (23) P. B. Petersen, J. C. Johnson, K. P. Knutsen, and R. J. Saykally, Chem. Phys. Lett. 397, 46 (2004).
- (24) P. B. Petersen, R. J. Saykally, M. Mucha, and P. Jungwirth, J. Phys. Chem. B 109, 10915 (2005).
- (25) P. B. Petersen and R. J. Saykally, Chem. Phys. Lett. 397, 51 (2004).
- (26) P. B. Petersen and R. J. Saykally, J. Am. Chem. Soc. 127, 15446 (2005).
- (27) D. F. Liu, G. Ma, L. M. Levering, and H. C. Allen, J. Phys. Chem. B 108, 2252 (2004).
- (28) C. Schnitzer, S. Baldelli, and M. J. Shultz, J. Phys. Chem. B 104, 585 (2000).
- (29) S. Gopalakrishnan, P. Jungwirth, D. J. Tobias, and H. C. Allen, J. Phys. Chem. B 109, 8861 (2005).
- (30) P. Viswanath and H. Motschmann, J. Phys. Chem. C 111, 4484 (2007).
- (31) P. Viswanath and H. Motschmann, J. Phys. Chem. C 112, 2099 (2008).
- (32) C. S. Tian, N. Ji, G. A. Waychunas, and Y. R. Shen, J. Am. Chem. Soc. 130, 13033 (2008).
- (33) M. A. Brown, R. D’Auria, I-F. W. Kuo, M. J. Krisch, D. E. Starr, H. Bluhm, D. J. Tobias, and J. C. Hemminger, Phys. Chem. Chem. Phys. 10, 4778 (2008).
- (34) N. Ji, V. Ostroverkhov, C. S. Tian, and Y. R. Shen, Phys. Rev. Lett. 100, 096102 (2008).
- (35) W. K. Zhang, H. F. Wang, and D. S. Zheng, Phys. Chem. Chem. Phys. 8, 4041 (2006).
- (36) D. R. Lide, CRC Handbook of Chemistry and Physics, (85th Edition, CRC Press, 2005).
- (37) Y. Rao, Y. S. Tao, and H. F. Wang, J. Chem. Phys. 119, 5226 (2003).
- (38) X. Zhuang, P. B. Miranda, D. Kim, and Y. R. Shen, Phys. Rev. B 59, 12632 (1999).
- (39) D. S. Zheng, Y. Wang, A. A. Liu, and H. F. Wang, Int. Rev. Phys. Rev. 27, 629 (2008).
- (40) W. K. Zhang, D. S. Zheng, Y. Y. Xu, H. T. Bian, Y. Guo, and H. F. Wang, J. Chem. Phys. 123, 224713 (2005).
- (41) Y. Rao, X. M. Guo, and H. F. Wang, J. Phys. Chem. A 108, 7977 (2004).
- (42) W. Gan, Z. Zhang, R. R. Feng, and H. F. Wang, J. Phys. Chem. C 111, 8726 (2007).
- (43) H. F. Wang, W. Gan, R. Lv, Y. Rao, and B. H. Wu, Int. Rev. Phy. Chem. 24, 191 (2005).
- (44) Q. Du, R. Superfine, E. Freysz, and Y. R. Shen, Phys. Rev. Lett. 70, 2313 (1993).
- (45) G. L. Richmond, Chem. Rev. 102, 2693 (2002).
- (46) Y. R. Shen and V. Ostroverkhov, Chem. Rev. 106, 1140 (2006).
- (47) W. Gan, D. Wu, Z. Zhang, R. R. Feng, and H. F. Wang, J. Chem. Phys. 124, 114705 (2006).
- (48) W. Gan, D. Wu, Z. Zhang, Y. Guo, and H. F. Wang, Chin. J. Chem. Phys. 19, 20 (2006).
- (49) E. Tyrode, C. M. Johnson, S. Baldelli, C. Leygraf, and M. W. Rutland, J. Phys. Chem. B 109, 329 (2005).
- (50) M. A. Wilson, A. Pohorille, and L. R. Pratt, J. Phys. Chem. 91, 4873 (1987).
- (51) B. Yang, D. E. Sullivan, B. Tjipto-Margo, and C. G. Gray, J. Phys.: Condens. Matter 3, F109 (1991).
- (52) I. Benjamin, Phys. Rev. Lett. 73, 2083 (1994).
- (53) N. A. M. Besseling and J. Lyklema, J. Phys. Chem. 98, 11610 (1994).
- (54) R. S. Taylor, L. X. Dang, and B. C. Garrett, J. Phys. Chem. 100, 11720 (1996).
- (55) V. P. Sokhan and D. J. Tildesley, Mol. Phys. 92, 625 (1997).
- (56) C. Fradin, A. Braslau, D. Luzet, D. Smilgies, M. Alba, N. Boudet, K. Mecke, and J. Daillant, Nature 403, 871 (2000).
- (57) A. Morita and J. T. Hynes, Chem. Phys. 258, 371 (2000).
- (58) A. Perry, H. Ahlborn, B. Space, and P. B. Moore, J. Chem. Phys. 118, 8411 (2003).
- (59) I-F. W. Kuo and C. J. Mundy, Science 303, 658 (2004).
- (60) K. Jaqaman, K. Tuncay, and P. J. Ortoleva, J. Chem. Phys. 120, 926 (2004).
- (61) Z. Zhang, D. S. Zheng, Y. Guo, and H. F. Wang, Phys. Chem. Chem. Phys. DOI:10.1039/b813187b (2008).
- (62) R. R. Feng, H. T. Bian, Y. Guo, and H. F. Wang, submitted to J. Chem. Phys.
- (63) W. Kunz, P. L. Nostro, and B. W. Ninham, Curr. Opin. Coll. Int. Sci. 9, 1 (2004).
- (64) L. M. Pegram and M. T. Record, J. Phys. Chem. B 111, 5411 (2007).
- (65) K. D. Collins and M. W. Washabaugh, Quart. Rev. Biophys. 18, 323 (1985).
- (66) E. C. Bingham, J. Phys. Chem. 45, 885 (1941).
- (67) M. G. Cacace, E. M. Landau, and J. J. Ramsden, Quart. Rev. Biophys. 30, 241 (1997).
- (68) H. S. Frank and M. W. Evans, J. Chem. Phys. 13, 507 (1945).
- (69) A. J. Rutgers and Y. Hendrikx, Trans. Faraday Soc. 58, 2184 (1962).
- (70) G. N. Patwari and J. M. Lisy, J. Chem. Phys. 118, 8555 (2003).
- (71) D. J. Miller and J. M. Lisy, J. Chem. Phys. 124, 024319 (2006).
- (72) M. Carrillo-Tripp, H. Saint-Martin, and I. Ortega-Blake, J. Chem. Phys. 118, 7062 (2003).
- (73) M. C. Gurau, S. Lim, E. T. Castellana, F. Albertorio, S. Kataoka, and P. S. Cremer, J. Am. Chem. Soc. 126, 10522 (2004).
- (74) X. Chen, T. L. Yang, S. Kataoka, and P. S. Cremer, J. Am. Chem. Soc. 129, 12272 (2007).
- (75) A. Tongraar, K. R. Liedl, and B. M. Rode, J. Phys. Chem. A 102, 10340 (1998).
- (76) R. Mancinelli, A. Botti, F. Bruni, M. A. Ricci, and A. K. Soper, J. Phys. Chem. B 111, 13570 (2007).
- (77) C. D. Cappa, J. D. Smith, B. M. Messer, R. C. Cohen, and R. J. Saykally, J. Phys. Chem. B 110, 5301 (2006).
- (78) A. W. Omta, M. F. Kropman, S. Woutersen, and H. J. Bakker, Science 301, 347 (2003).
- (79) A. H. Muenter, J. L. DeZwaan, and G. M. Nathanson, J. Phys. Chem. B 110, 4881 (2006).
- (80) A. H. Muenter, J. L. DeZwaan, and G. M. Nathanson, J. Phys. Chem. C 111, 15043 (2007).
- (81) J. L. DeZwaan, S. M. Brastad, and G. M. Nathanson, J. Phys. Chem. C 112, 3008 (2008).
-
Table 1
The results for the , , R, D, (assuming distribution) and Ns for the neat water, KF, KCl and KBr salt solution interfaces.
-
Table 2
The relative ability for each salt to increase the thickness of the interfacial water is determined by fitting the slopes in the Figure 3. The six salts followed the following order: KBr NaBr KCl NaCl NaF KF.
| Concentration/M | R | D | |||||
|---|---|---|---|---|---|---|---|
| H2O | 0.0 | 0.290.03 | 2.530.06 | 0.690.02 | 1.710.02 | 40.10.4 | 1 |
| KF | 0.5 | 0.300.03 | 2.510.06 | 0.690.02 | 1.720.02 | 40.30.4 | 1.010.02 |
| 1.0 | 0.300.03 | 2.570.06 | 0.690.02 | 1.720.02 | 40.30.4 | 1.010.02 | |
| 2.0 | 0.310.03 | 2.580.06 | 0.700.02 | 1.720.02 | 40.30.4 | 1.020.02 | |
| 3.0 | 0.310.03 | 2.580.06 | 0.700.02 | 1.720.02 | 40.30.4 | 1.040.02 | |
| 4.0 | 0.320.03 | 2.620.06 | 0.700.02 | 1.720.02 | 40.30.4 | 1.050.02 | |
| 5.0 | 0.330.03 | 2.600.06 | 0.710.02 | 1.720.02 | 40.30.4 | 1.070.02 | |
| KCl | 0.5 | 0.290.03 | 2.520.06 | 0.690.02 | 1.710.02 | 40.10.4 | 1.020.02 |
| 1.0 | 0.290.03 | 2.570.06 | 0.690.02 | 1.720.02 | 40.30.4 | 1.030.02 | |
| 2.0 | 0.280.03 | 2.530.06 | 0.680.02 | 1.710.02 | 40.10.4 | 1.080.02 | |
| 2.5 | 0.280.03 | 2.520.06 | 0.680.02 | 1.710.02 | 40.10.4 | 1.100.02 | |
| 3.0 | 0.290.03 | 2.560.06 | 0.690.02 | 1.720.02 | 40.30.4 | 1.120.02 | |
| 4.0 | 0.280.03 | 2.540.06 | 0.680.02 | 1.720.02 | 40.30.4 | 1.160.02 | |
| KBr | 0.5 | 0.290.03 | 2.540.06 | 0.690.02 | 1.710.02 | 40.10.4 | 1.050.02 |
| 1.0 | 0.280.03 | 2.540.06 | 0.680.02 | 1.720.02 | 40.30.4 | 1.080.02 | |
| 2.0 | 0.270.03 | 2.590.06 | 0.680.02 | 1.730.02 | 40.50.4 | 1.170.02 | |
| 3.0 | 0.270.03 | 2.610.06 | 0.680.02 | 1.730.02 | 40.50.4 | 1.250.02 | |
| 4.0 | 0.270.03 | 2.570.06 | 0.680.02 | 1.720.02 | 40.30.4 | 1.310.02 |
| Salts | KBr | NaBr | KCl | NaCl | NaF | KF |
|---|---|---|---|---|---|---|
| Slope (M-1) | 0.0800.001 | 0.0690.001 | 0.0400.001 | 0.0280.001 | 0.0290.002 | 0.0130.001 |
-
Fig. 1
Polarization and concentration dependent SHG (400nm) data: a. left panel, KF, KCl and KBr solution surfaces; b. right panel, NaF, NaCl and NaBr solution surfaces. These data were obtained by fitting the s and p detection data measured for each concentration and each salt solution. The procedure used was fully described previously,ZhangWKJCP224713 ; BianPCCP and it can ensure the accuracy of the data for each polarization combination. The 45∘-in/s-out data need to be scaled up by the factor of 1.23 because of the different detection efficiency for the s and p polarized SHG signal at 400nm in the detection setup in this experiment. The data for NaF, NaCl and NaBr are identical to the data in our previous article,BianPCCP and the scale is changed to be the same as the KF, KCl and KBr data for better visual comparison.
-
Fig. 2
The orientational parameters D (top) and the apparent orientational angles (bottom) for the KF (solid triangle), KCl(solid circle), KBr (solid square), NaF (open triangle), NaCl(open circle) and NaBr (open square) solution interfaces. The data for KF, KCl and KBr are from Table 1. The data for NaF, NaCl and NaBr were from the Table 1 in the previously published paper.BianPCCP It is clear that the D values for the neat water and low bulk concentration for the sodium halides and the potassium halides data series were well within the experimental error; while at higher concentrations the D values for the two series went to different directions.
-
Fig. 3
The relative interfacial density of the water molecules at different salt bulk concentration: KF (solid triangle), KCl(solid circle), KBr (solid square), NaF (open triangle), NaCl(open circle) and NaBr (open square). The data for KF, KCl and KBr are from Table 1. The data for NaF, NaCl and NaBr were the same as in the previously published work.BianPCCP
-
Fig. 4
The polarization dependent per molecule hyperpolarizabilities (, , and ) are simulated with Eqs.2.2 and Eqs.2.4. In calculating the Fresnel factors, the effective surface dielectric constant was calculated according Zhuang et al.’s model.ShenZhuangPRB The experimental configuration is in the reflection geometry with =70∘. The values of R==0.69 and =1 are used. In the simulation, the angular distribution function was assumed a Gaussian function . The values for distribution function () and for FWHM=30∘ (=12.7∘) are both plotted. The vertical dash line is at the average orientational angle () of the neat air/water interface which was determined at 40.1∘. The horizontal dash line is drawn at =0.
-
Fig. 5
Illustration of the two types of interfacial water structure as well as the specific cation effects on the average orientation of the non-straddle type surface water molecules. There may exist different type of configurations for the non-straddle type water molecules. Here only their averaged orientation of these hydrogen bonded water molecules is representatively illustrated.