Polyelectrolytes in electric fields: Measuring the dynamical effective charge and effective friction
Accepted XXXXth Month, 200X
DOI: 10.1039/)
We use a coarse-grained molecular dynamics model to study the electrophoretic behaviour of flexible polyelectrolyte chains. We first characterize the static properties of the model with respect to the chain length, the polyelectrolyte concentration, additional salt and the influence of an applied external field. Next we investigate the dynamic behaviour in the oligomer range and compare to data obtained by two different experimental methods, namely capillary electrophoresis and PFG-NMR. We find excellent agreement of experiments and simulations when hydrodynamic interactions are accounted for in the simulations. We then present novel estimators for the dynamical effective charge during free solution electrophoresis and compare them to static estimators. We find complete agreement between the static and the dynamic estimators. We further evaluate the scaling behaviour of the effective friction of the polyelectrolyte-counterion complex with the surrounding fluid. We identify a hydrodynamic screening length beyond which the friction during electrophoresis is linear depending on the chain length resulting in a constant mobility for long polyelectrolyte chains. Our results show a convincing agreement with experimental data and demonstrate that it is possible to model dynamic behaviour of polyelectrolytes using coarse grained models, provided they include the effects of hydrodynamical interactions.
1 Introduction
In order to be able to improve the processes involved in current electrophoretic separation methods it is a prerequisite to gain a thorough understanding of the behaviour of polyelectrolytes in an externally applied electric field. Electrophoretic methods are widely used to study polyelectrolytes (PEs) such as proteins, DNA and synthetic polymers [1, 2, 3]. Several theories [4, 5, 6, 7] have been developed to describe PE electrophoresis and successfully described qualitatively the experimentally observed behaviour of various PEs under bulk conditions. In a recent publication [8], we showed how coarse-grained molecular dynamics simulations can extend this theoretical understanding on a more microscopic level. In this article, we will extend this work by rigorously studying additional effects on the electrophoretic behavior such as polyelectrolyte concentration, concentration of added salt, and variations of the externally applied field.
We start to characterize the polyelectrolyte’s static properties on the externally applied field. We then continue to investigate the dynamic properties, putting emphasis on the hydrodynamic interactions between the polyelectrolyte and the surrounding solvent. Our results on the PE diffusion coefficient and the mobility are compared to two experimental data sets and yield very good agreement. Since the mobility of the PE can be expressed as the quotient of an effective charge and an effective friction term, we concentrate on finding a reasonable operational definition of an effective charge. This would then yield a measure of the effective friction, and we believe that a direct measurement of the effective charge will help to fully understand the electrophoretic process. We also would like to clarify if there are differences in the obtained values of the effective charge, when purely dynamical or static estimators are used, as has been found for charged colloidal suspensions [9]. We compare five different ways to estimate the effective charge of the polyelectrolyte-counterion complex, and use the effective charge to characterize the effective friction, thereby identifying the role of counterions on hydrodynamic shielding.
The paper is organised as follows: in Section 2 we present our simulation model and briefly describe the different systems investigated. The model is characterised in Section 3 by analyzing the dependence of static system properties on the the system parameters such as chain lengths and concentration, effect of added salt, and the influence of the external electric field applied during electrophoresis. We then determine two relevant transport coefficients, the diffusion and the electrophoretic mobility, and compare the results to recent experimental data (Section 4). To understand the observed results, we introduce and compare several estimators for the effective charge of the polyelectrolyte-counterion-complex that is created in solution (Section 5). In Section 6, we use the charge estimate to calculate the effective friction of the complex during free solution electrophoresis. We identify a linear increase of the friction with the chain length beyond a screening length. We conclude the paper by interpreting the observed results and show how this helps to understand the underlying processes in free solution electrophoresis.
2 Model
We employ molecular dynamics (MD) simulations using the ESPResSo package [10] to study the behaviour of linear PEs of different lengths. The PEs are modelled by a totally flexible bead-spring model in a set of spheres that represent the individual monomers which are connected to each other by finitely extensible nonlinear elastic (FENE) bonds [11]
with stiffness , and maximum extension , and being the distance between the interacting monomers. Additionally, a truncated Lennard-Jones or WCA potential [12]
is used for excluded volume interactions. A cutoff value of ensures a purely repulsive potential. All dissociated counterions and additional salt ions are modelled by appropriately charged spheres using the same WCA potential.
Here, and define the energy and length scale of the simulations. We use , i.e. the energy of the system is expressed in terms of the thermal energy. The length scale defines the size of the monomers. In this model, the average bond length between the successive monomers in a PE chain is , whereas the real distance between two monomers of a fully sulfonated polystyrene chain is approximately 2.5 Å. Therefore, is mapped to in reality. Different polyelectrolytes can be mapped by changing . Unless mentioned otherwise, all observables are expressed in reduced simulation units, and we will not use and explicitly from now on.
All chain monomers carry a negative electric charge , where is the elementary charge. For charge neutrality, monovalent counterions of charge are added. Where mentioned, additional monovalent salt is added to the simulation. Full electrostatic interactions are calculated with the P3M algorithm using the implementation of Reference [13]. The Bjerrum length in simulation units corresponds to 7.1 Å, the Bjerrum length in water at room temperature. This means that the effect of the surrounding water is modelled implicitly by simply using the dielectric properties of water, having a relative dielectric constant of .
The simulations are carried out under periodic boundary conditions in a cubic simulation box. The size of the box is varied to realize a constant monomer concentration independent of chain length as specified.
We compare two types of MD simulations. In the first one, we use simple Langevin equations of motions with a velocity dependent dissipative and a random term in addition to the interparticle forces. Together, both additional terms implicitly model the effects of a solvent surrounding the particles: the dissipative force, , provides local friction and the non-correlated zero-mean Gaussian random forces, , mimic thermal kicks (Brownian motion). In order to fulfill the fluctuation-dissipation theorem, dissipative and random force have to be coupled together: . This approach only offers local particle-fluid interactions, but destroys long-range hydrodynamic interactions (HI).
The second set of simulations include hydrodynamics using a Lattice Boltzmann (LB) algorithm [14] that is interacting with the MD simulations via a frictionally coupling introduced by Ahlrichs et al. [15]. The mesoscopic LB fluid is described by a velocity field generated by discrete momentum distributions on a spatial grid rather than explicit fluid particles. We use an implementation of the D3Q18 model with a kinematic viscosity , and a fluid density . The resulting fluid has a dynamic viscosity . The space is discretised by a grid with spacing . As in the Langevin approach, the particle-fluid interaction is realised by a dissipative force depending on the difference between the particle velocity and the fluid velocity at the particle position : . Here, the coupling constant is . Additional random fluctuations for particles and fluid act as a thermostat. The interaction between particles and fluid conserve total momentum, and this algorithm has been shown to yield correct long-range hydrodynamic interaction between individual particles[15].
By comparing both types of MD simulations, we can characterize the impact of HI on the dynamics of the system. The individual approaches are mapped by setting the Langevin friction parameter to match the single particle mobility obtained with the mesoscopic fluid.
The simulations are carried out with a MD time step and LB time step . After an equilibration time of steps, steps are used for generating the data. The time-series are analyzed using auto-correlation functions to estimate the statistical errors as detailed in Reference [16]. Error bars of the order of the symbol size or smaller are omitted in the figures. Up to ten independent simulations are carried out for each data point, taking between one day and three weeks on a single standard CPU depending on the chain length and the monomer concentration .
3 Static properties
In this section, the proposed coarse-grained model is used to quantify the static properties of the polyelectrolyte chain and the surrounding counterions. The influence of the individual concentrations of the monomers and the counterions as well as the dependence on the strength of the external electric field are investigated.
3.1 Chain scaling
The polyelectrolyte chain conformations can be characterised by the average end-to-end distance
the radius of gyration
and by the hydrodynamic radius
Here, is the number of chain monomers, the position of the -th monomer, and the center of mass of the polyelectrolyte chain. The angular brackets indicate an ensemble average. All three quantities are expected to exhibit a power law scaling , where the scaling exponent depends on the system. For an uncharged polymer with ideal chain behaviour (Flory exponent) [17], whereas for a fully charged polyelectrolyte without electrostatic screening (no counterions), we expect to find .
Figure 1 shows for polyelectrolyte chains of different length in the presence of the neutralizing counterions at a concentration for monomers and counterions of mM and in the absence of an external field. The obtained effective scaling exponent for and for chains up to indicates the counterion influence on electrostatic screening and on the chain conformations. The hydrodynamic radius exhibits a very slow asymptotic behaviour which leads to a lower apparent scaling exponent for short and intermediate chains. In Section 4.1, we will demonstrate, however, that this is in perfect agreement with the measured diffusion coefficients. Figure 1 also examplifies that there are no influences of the hydrodynamic interactions on all static chain properties, as it should be.
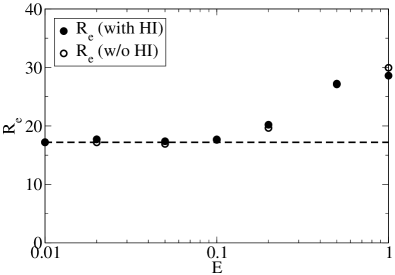
If the polyelectrolyte chain is subject to a strong external electric field , then, depending on the magnitude of , conformational changes can be induced [18].
In Figure 2, we show that the model polyelectrolyte of length experiences conformational changes if the external electric field is or larger. According to [19, 18], depends on the strength of the electrostatic coupling and on the length . The approximation of Netz yields a value comparable to the one found in our simulations.
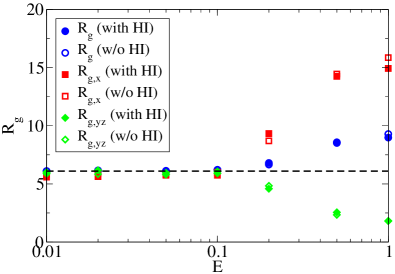
The increased end-to-end distance (Figure 2) indicates that the polyelectrolyte chain conformation is extended. This can also be seen by looking at in Figure 2. Additionally, we introduce two new observables
and
where is the position component in -direction of the -th particle. For an isotropic chain, , which is shown in Figure 2 for . For electric fields beyond the threshold, an increase of and a decrease of is observed. This can be understood as an extension of the polyelectrolyte conformation in x-direction (into the direction of the external field) and a compression perpendicular to it. This alignment in high electric fields has also been studied in Reference 20. There it was shown, that for even higher fields and stiff polymers, the phase of alignment along the electric field is followed by an alignment perpendicular to it. This transition has also been recently observed by [21]. Figure 2 also shows that this effect is independent of long range hydrodynamic interactions, which is consistent with the initial observations by Netz that were obtained without the inclusion of hydrodynamic interactions [19, 18].
For the purpose of this paper, we note that for electrical fields of or lower, no conformational change and no orientational order is induced.
Adding salt to a polyelectrolyte solution screens electrostatic interactions on a length scale known as the Debye length . For monovalent salt, is inversely proportional to the square root of the added salt concentration:
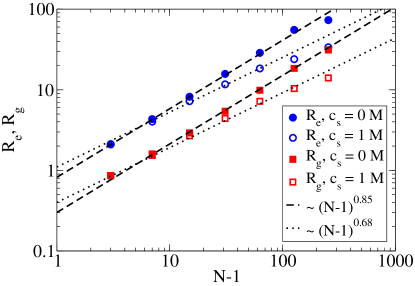
where is the concentration of the monovalent salt, is the concentration of the polyelectrolyte’s counterions and is the Avogadro number. In Figure 3, the screening effect of added salt can be seen. We compare the scaling of and for the salt-free case () to a solution with M of added salt (). The additional salt screens the electrostatic interactions between the polyelectrolyte monomers and reduces the scaling coefficient to , which is close to the scaling for an uncharged polymer with the Flory exponent. It remains to be pointed out, that the measured scaling exponent is only an effective value for the length range investigated. For chains with a blob diameter much larger than the finite electrostatic screening length , the scaling is expected to be equal to the scaling of an uncharged polymer, .
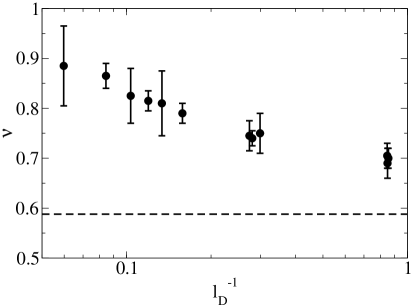
By adding salt, the polyelectrolyte conformations become less extended. The effective scaling exponent depends on the inverse Debye length in the system. We illustrate this in Figure 4: for no additional salt (small inverse Debye lengths), the observed scaling exponent is close to 1 as it is expected for an unscreened polyelectrolyte chain. As we add additional salt and thereby increase the inverse Debye length, the scaling exponent decreases and approaches the Flory number. The additional salt screens the electrostatic interactions along the polyelectrolyte chain which starts to assume configurations close to those of an uncharged polymer in ideal solvent.
We note that adding monovalent salt to the solution, decreases the spatial extension of the polyelectrolyte chain and makes the conformations more compact.
3.2 Counterions
After having investigated the chain conformations in some detail, we now take a look at the counterion distribution around the polyelectrolyte chains. Strongly charged polyelectrolytes attract some of the released counterions and effectively reduce their line charge density. This phenomenon was described by Manning and Oosawa under the term counterion condensation [22, 23]. This topic has been discussed from varying viewpoints (see [24, 25] and the references therein).
According to Manning’s theory, the distribution of counterions around highly charged rodlike polyelectrolytes can be described in terms of the Manning parameter where is the Bjerrum length and is distance between charges along the backbone of the polyelectrolyte (inverse line charge density), thus .
Here, we investigate highly charged polyelectrolytes with , for which a finite number of counterions is always found in close vicinity of the polyelectrolyte chain, thus reducing the effective charge of the created polyelectrolyte-counterion complex. The simple counter ion condensation theory predicts the fraction of those condensed counterions to be , but without specifying the actual distance to the chain in which those counterions are to be found. Following the prediction, the total number is
| (1) |
where is the length of the polyelectrolyte. This leads to a predicted effective charge .
In Figure 5, we compare this prediction to the average number of counterions that we find within a distance of to the polyelectrolyte chain. We will present more elaborate estimators based on Poisson-Boltzman theory in Section 5. For long polyelectrolyte chains (), the measured number of condensed counterions approaches the predicted Manning value. The distribution of counterions around the chain is not influenced by hydrodynamic interactions, as it should be.
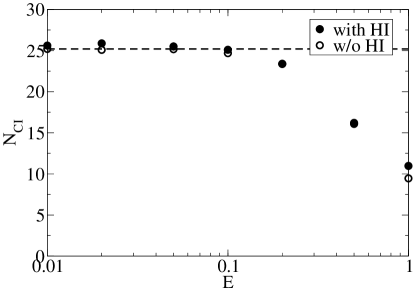
An external electric field not only couples to the polyelectrolyte monomers, but also acts on the oppositely charged counterions. Strong electric fields are known to reduce the number of condensed counterions in the vicinity of the chain [19, 18]. In Figure 6, the number of counterions within around a polyelectrolyte chain with monomers is determined for different values of the applied electric field. Beyond a critical threshold of , counterions are stripped away from the polyelectrolyte chain. The onset of this effect coincides with the observed extension and alignment of the chain (Figure 2).
Again, we note that for electrical fields of or lower, no change to the counterion distribution around the polyelectrolyte chain is found.
4 Transport coefficients
In this section, we will determine the transport coefficients for flexible polyelectrolytes. We will briefly review the results from an earlier study combining different experimental data sets on polystyrene sulfonate (PSS) with simulation results [8]. We augment the study by an additional investigation about the dynamical and static effective charge and friction, respectively, to expand the understanding of the microscopic processes.
4.1 Diffusion
The diffusion coefficient characterizes the thermal motion of the polyelectrolyte. It can be obtained from the simulation trajectory of the polyelectrolyte chain by recording the center of mass mean-square displacement versus time, and subsequently measuring the corresponding slope according to
| (2) |
where is the position of the center of mass, and is the time. The angular brackets indicate the averaging over many configurations.
Alternatively, the diffusion coefficient can be obtained from the integration of the velocity auto-correlation function of the center of mass
| (3) |
Here, is the center of mass velocity of the polyelectrolyte at a given time. Again, the angular brackets indicate the averaging over many configurations.
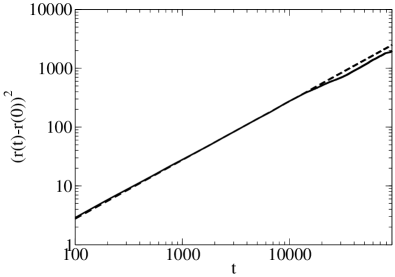
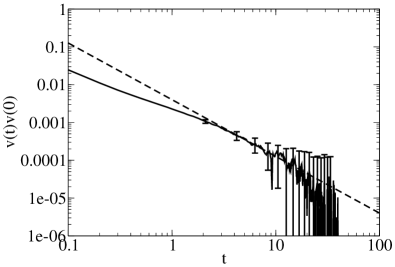
The accuracy of both methods depends on the number of statistically independent data samples. In Figure 7, we present sample graphs to determine the diffusion of a polyelectrolyte chain of length using Equations 2 and 3. Since simulations with hydrodynamic interactions are computationally very demanding, the achievable accuracy is limited. The errors are determined from the statistical fluctuations of the data and the uncertainty in the fit parameter.
In Figure 7, the diffusion is obtained from a fit to the linear part of the mean square displacement. This yields a diffusion coefficient of in simulation units. To calculate the integral in Equation 3, a fit to the slowly decaying long-time tail of the center of mass’ velocity auto-correlation function has to be obtained as shown in Figure 7. Here, the theoretical predicted functions are used to match the long-time tail: without hydrodynamic interactions, an exponential decay of the velocity correlations is expected, whereas with hydrodynamic interactions the correlation function decays with . The figure shows the more interesting case with hydrodynamic interactions. The combined results of simulation data and long-time fit are integrated and a diffusion coefficient of is obtained, which is in agreement with the corresponding value obtained from the mean square displacement.
Both methods are strictly equivalent for classical systems, but for the remainder of the paper, the integral method is used to obtain the diffusion coefficient as one can use a similar formulation to obtain the mobility of the polyelectrolyte (see Equation 6), and thus can determine both quantities without additional computational effort. Specifically, both auto-correlation functions have to be determined accurately on the interval , whereas the root mean square displacement has to be determined on the interval , as shown in Figure 7.
The diffusion of polymers in the presence or absence of hydrodynamic interactions is very well studied from a theoretical point of view. In general, the following Einstein equation is valid
where is the so-called friction coefficient of the studied object, is the Boltzmann factor and is the temperature.
Without hydrodynamic interactions, one expects Rouse behaviour, i.e. a friction coefficient that linearly depends on the change length :
Here, is the friction coefficient of a single monomer of the polymer chain.
With hydrodynamic interactions, Zimm behaviour is expected. The scaling of with the chain length is no longer proportional to , but can be described by the Kirkwood-Zimm theory [26, 27]. Within this theory, the diffusion coefficient is expected to be
| (4) |
where is the diffusion coefficient of a single monomer of the polymer chain, is the chain length, is the viscosity of the solvent, and is the hydrodynamic radius of the polymer. In general as pointed out in Section 3, is not linear in , resulting in a scaling different from for the diffusion coefficient of a polyelectrolyte in the presence of hydrodynamic interactions.
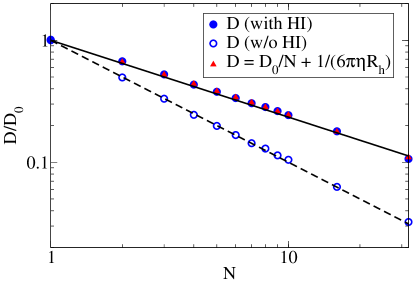
In Figure 8, we compare the normalised diffusion coefficient for polyelectrolyte chains of varying length with and without hydrodynamic interactions. When hydrodynamic interactions are present, the polyelectrolyte diffusion shows a behaviour which can be described by a power law scaling , where is the monomer diffusion coefficient. For our model polyelectrolyte, a scaling exponent of is observed. Another way to obtain the diffusion coefficient from is to insert the statically (or dynamically) measured hydrodynamic radii and insert them into Equation 4. Both ways of obtaining the PE diffusion constant are in perfect agreement, demonstrating the applicability of Zimm theory. This is especially remarkable, as it shows that the counterions, which are not considered in Equation 4, do not directly influence the diffusion of polyelectrolytes. Instead only the conformations of the polyelectrolyte itself, i.e. the internal monomer-monomer distances, determine the diffusive behaviour.
The observed scaling exponent is in good agreement with experimental results for the diffusion coefficient of polyelectrolytes as we have shown earlier [8]. For the standard polyelectrolyte PSS (polystyrene sulfonate), Böhme and Scheler [28] obtained , whereas Stellwagen et. al. [29] reported a scaling with . It is worth mentioning that the latter value was obtained in the presence of 50 to 100 mM additional salt and for PSS chains of upto 20000 repeat units, therefore a smaller scaling exponent can be expected as shown in Section 3.
When hydrodynamic interactions are switched off, the polyelectrolyte chain exhibits Rouse behaviour with a scaling of , demonstrating the importance of hydrodynamic interactions for the observed diffusion scaling with chain length.
However, as shown in the previous chapter, the static chain properties, including the hydrodynamic radius do not depend on the presence of hydrodynamic interactions. This allows for the correct calculation of the diffusion coefficient even in the absence of hydrodynamic interactions by means of Equation 4. Having said that, the direct measurement of is only possible, when hydrodynamic interactions are included in the simulation model.
For this study, we also lowered the monomer concentration of the polyelectrolyte from mM up to 1 mM. Within this range, no change of diffusion coefficients was observed (data not shown).
4.1.1 Influence of the electric field
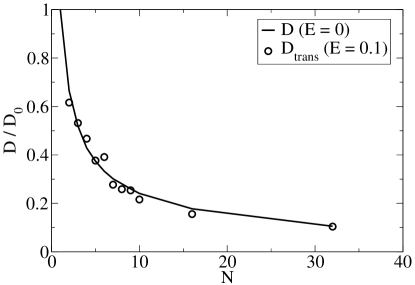
When an external electric field is applied to the polyelectrolyte solution the diffusive motion in the direction of the electric field is mixed with the induced directed motion. However, it is possible to determine the translational diffusion coefficient perpendicular to the electric field. Figure 9 shows that for a reduced electric field of no deviation from the diffusive behaviour at vanishing electric field is found. This is in-line with the findings of Section 3, i.e., that for small enough electric fields, the conformation of the polyelectrolyte chains and the surrounding counterions are unchanged, such that the measured quantities do not depend on the applied electric field.
Experimentally [30], it is also possible to determine the diffusion coefficient in the direction of the field by separating the diffusive from the directed motion. The electric field showed no influence on the diffusion coefficient.
4.2 Electrophoretic mobility
The second transport coefficient of interest is the electrophoretic mobility . It characterizes the motion of the polyelectrolyte in an external electric field.
In capillary electrophoresis experiments [1], the electrophoretic mobility of the solute is determined by , where is the velocity, is the electric field, is the applied voltage, is the total length of the capillary, is the migration (or effective) length up to the detector, and is the detection time of the solute.
This method can be directly transferred and applied to computer simulations. The external electric field is modelled by a constant force acting on the charged particles in the solution. This causes a directed motion with a certain velocity . From this one can obtain the electrophoretic mobility
| (5) |
Netz [19, 18] studied the behaviour of flexible polyelectrolytes in strong electric fields in the absence of hydrodynamic interactions. He showed, that the electrophoretic mobility determined by Equation 5 for large electric fields depends on the magnitude of the electric field. This effect is attributed to the polarization and the following removal of the counterion cloud surrounding the polyelectrolyte. Below a critical value, the mobility is not affected by the electric field, and the system is in the linear response regime.
Experimentally used electric fields are usually below 1 kV/cm, which corresponds to a reduced field strength of , and as such are far below this critical threshold. Thus we will focus on the behaviour of polyelectrolytes in weak electric fields. In Section 3, we identified the threshold to be . For simulations, the usage of a weak electrical driving force requires long simulations times, in order to be able to accurately separate the directed motion from the thermal fluctuations.
Alternatively, the electrophoretic mobility can be calculated from the following Green-Kubo relation
| (6) |
where the summation is over all charged particles (monomers and counterions) in the system, and is their individual velocity and their charge. Here, is the velocity of the center of mass of the polyelectrolyte. This approach has been successfully applied in simulations of charged colloids [31, 32].
While there are several theories [4, 5, 6, 7] that have been used to describe qualitatively the experimentally observed electrophoretic behaviour of various PEs, there are still some open questions to address. Recent experiments on strongly charged flexible PEs, such as polystyrene sulfonate (PSS) and single-stranded DNA (ssDNA) of well defined length have shown a characteristic behaviour for the short chain free-solution mobility [33, 34, 35, 29]: after an initial increase of the mobility with increasing length, passes through a maximum, and then decreases towards a constant mobility for long chains.
The increase of for short chains and the long-chain limit constant can be explained within the theoretical approaches, but the origins for the maximum for intermediate chains have not been accounted for yet. In [8], we showed that the experimentally observed behaviour can be simulated using a coarse-grained MD model. We also showed that the maximum is due to the complex hydrodynamic interactions between the polyelectrolyte and its counterions and the solute.
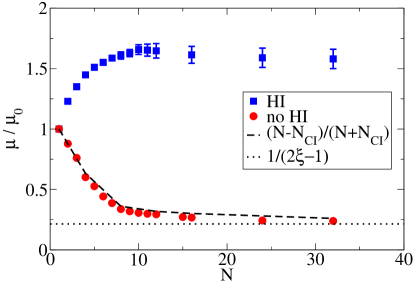
In Figure 10, we illustrate that the maximum in the electrophoretic mobility can only be reproduced when hydrodynamic interactions are properly accounted for. The neglect of hydrodynamic interactions leads to a decreasing electrophoretic mobility for short chains. This observation was also made in a recent publication by Frank and Winkler [21].
In addition to the measured mobilities, Figure 10 includes a prediction for the mobility without hydrodynamic interactions based on a local force balance: without hydrodynamic interactions, every particle of the polyelectrolyte-counterion complex is subject to the same frictional force that counterbalances the electric driving force . From this we can easily obtain the following expression for the electrophoretic mobility in absence of hydrodynamic interactions, where is the mobility of a single monomer, is the length of the polyelectrolyte, and is the number of condensed counterions that move with the polyelectrolyte:
| (7) |
In order to utilize Equation 7 we need the number of condensed counterions. These we obtain by counting the average number of counter-ions found within of the chain. Additionally, we can substitute from Eq. 1 and obtain the Manning prediction for the mobility
| (8) |
Figure 10 shows excellent agreement of of Equation 7 and also demonstrates, that the Manning mobility is approached nicely for long chains.
We conclude that the local force picture successfully describes the observed behaviour in absence of hydrodynamic interactions, but qualitatively fails to describe the mobility for shor chains in any real experiment, where hydrodynamic interactions are obviously present.
4.2.1 Influence of the electric field
The effect of high electric fields on the mobility of polyelectrolytes has been investigated theoretically before. Below the critical field strength, i.e. in the linear response regime, the electrophoretic mobility is independent of the applied electric field. In Figure 11, we compare for a polyelectrolyte chain at obtained at zero field via Equation 6 to the mobility at finite fields, and 0.1, via Equation 5. The measured values agree within their displayed precision. For comparison, all data sets were obtained using the same computational effort (same number of simulation steps). For short chains, the Green-Kubo based method yields more accurate results, whereas longer chains can be simulated at equal accuracy by an external applied field. For short chains and weak fields, the thermal (Brownian) motion dominates the directed electrophoretic motion, which decreases the accuracy of the obtained values.
Based on this observation, we conclude that the Green-Kubo method to measure the electrophoretic mobility of polyelectrolytes in solution has several advantages. Firstly and most importantly, it guarantees the measurement of free-solution mobilities in the linear regime, which are comparable to experimental measurements at standard field strengths. The alternative method uses fields that are about a factor 100 higher than the experimentally used ones and are close to the critical value at which static and dynamic properties of the polyelectrolyte are significantly changed. Secondly, the computational effort needed to achieve a given accuracy for short polyelectrolytes chains () is up to 50% smaller than with the direct method. And last but not least, the trajectories simulated at zero field can be used to determine the electrophoretic mobility and the diffusion (using Equation 3) at the same time, additionally reducing the computational cost of such a study.
4.2.2 Influence of the monomer concentration
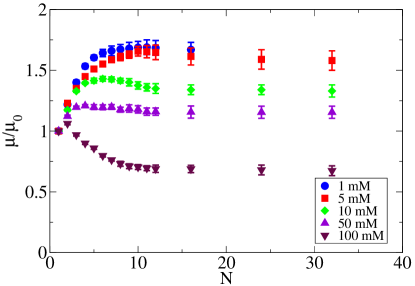
It is well known, that the free-solution mobility of polyelectrolytes is depending on the salt concentration of the solution [34]. With increasing additional salt, the maximal free-solution mobility decreases due to increased counterion condensation. We point out that the long chain mobility also shows a dependence on the monomer concentration in the absence of additional salt. This effect can be mainly attributed to the electrostatic screening mediated bu the chain monomers and counterions (self-screening).
Figure 12 shows that not only the long chain limit is influenced by increased electrostatic screening, but also the short chain behaviour. The maximum is significantly reduced for higher monomer concentrations. From a value higher or equal to mM it is completely reduced, and the behaviour in the presence of hydrodynamic interactions is similar to one without hydrodynamic interactions as seen in Figure 10. The increased electrostatic screening caused by a higher concentration (resulting in a shorter Debye length) suppresses the short-range hydrodynamic interactions that are essential for the formation of the maximum.
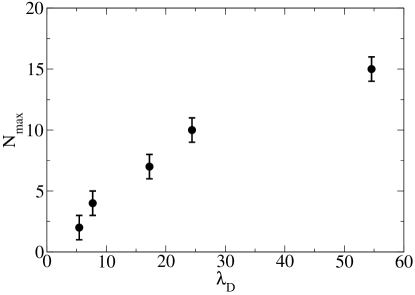
This is reflected in Figure 13, where we show the degree of polymerization with the maximum mobility versus the Debye length . The lower the Debye length, i.e. the higher the electrostatic screening, the more the maximum is shifted to shorter chains. This correlation has not been investigated previously. In the remainder of this paper, we will analyze the importance of the interplay of the electrostatic screening with the hydrodynamic interactions.
5 Charge estimators
In this section, we present five different estimators to measure the effective charge of the polyelectrolyte counterion complex. The first two are based on static ion distributions, whereas the latter three are based on dynamic quantities that can be computed with or without hydrodynamic interactions included. We will compare the practicability and accuracy of the estimators and discuss the obtained results in the context of polyelectrolyte electrophoresis. At the same time we can see if any difference can be observed between a static effective charge and a dynamic effective charge [9, 31].
5.1 Primitive estimate
A simple method of estimating the effective charge has been used in Figure 5 for describing the static properties of the polyelectrolyte counterion complex:
| (9) |
where is the average number of counterions that can be found within a distance around the polyelectrolyte, where is distance to the closest monomer. The threshold is usually chosen to be .
In Section 3.2, we showed that the effective charge estimated in this way is not affected by hydrodynamic interactions.
This method is computationally inexpensive and as seen in Figure 5 yields a reasonable estimate for the effective charge. The draw back is that the threshold is arbitrarily defined which limits the usefulness of this estimator.
5.2 Inflection criterion
A more advanced method uses the inflection criterion to estimate the threshold of counterion condensation [36, 37, 38] that has its basis in Poisson-Boltzmann theory. It has been shown that the position of the inflection point (zero of the second derivative) for the integrated ion distribution with respect to the logarithmic distance from the closest chain monomer yields a cutoff that accurately separates free from bound counterions in the case of a rod-like polyelectrolyte in cylindrical geometry. The applicability to polyelectrolytes will be shown here.
The integrated ion distribution is defined as
| (10) |
where is the normalised density of counterions at a distance to the closest chain monomer, and is the fraction of counterions found at a distance closer than . The total number of condensed counterions up to this distance given by multiplying this number with .
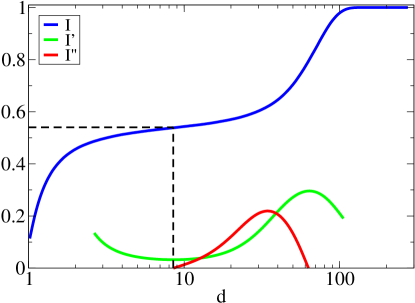
In order to apply the inflection point criterion to the polyelectrolyte model, the integrated ion distribution has to be measured and plotted logarithmically. Figure 14 shows the result for a chain of monomers. Additionally, the first and second derivative obtained numerically are plotted. The cutoff value indicated by the inflection point and the associated fraction of condensed counterions can be directly read off Figure 14.
The effective charge of the polyelectrolyte using the inflection criterion is then given by
| (11) |
The cutoff is not a fixed parameter anymore, but has to be determined for every chain length.
5.3 Langevin model
In Section 4.2, we used the local force picture and derived Equation 7 for the electrophoretic mobility in absence of hydrodynamic interactions. Similarly, we can derive an expression for the effective charge of the polyelectrolyte in absence of hydrodynamic interactions based on the measured mobility of the PE-counterion complex.
| (12) |
Equation 12 offers a way to determine the effective charge of the polyelectrolyte counterion complex based purely on the measured mobility in the absence of hydrodynamic interactions without the need of free parameter and at reasonable computational costs. The accuracy of this estimator is limited by the accuracy of the measured electrophoretic mobility , and it is strictly valid only for the Langevin model without HI.
5.4 Ion diffusion
The local force picture used for the Langevin model assumes that a finite amount of counterions is bound to the polyelectrolyte while the remaining ions can move freely. We will now motivate another charge estimator that is especially promising as it can also be directly applied in experimental setups, since all necessary quantities can be measured experimentally.
The bound counterions are expected to diffuse together with the polyelectrolyte with a diffusion coefficient as determined in Section 4.1. Likewise, the free counterions will diffuse with a different diffusion coefficient . If one measures the ion diffusion coefficient for all ions in such a system, the measured quantity will be the weighted average of the bound and the free diffusion coefficient:
From this we derive a novel estimator for the effective charge
| (13) |
that has the advantage of only including quantities that are experimentally accessible and as such can be used to directly measure the effective charge in experiments.
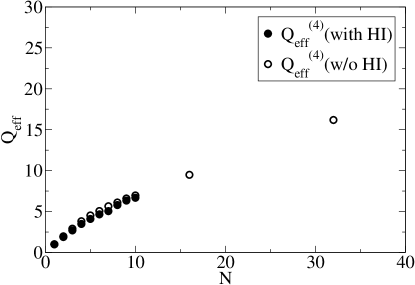
In Figure 15 we compare the results of estimator with and without hydrodynamic interactions and that within the accuracy of the method, no difference can be observed, even though the individual diffusion coefficients are different for both types of simulations. Equation 13 is valid for simulations independent of the presence or absence of hydrodynamic interactions and has the computational complexity of determining the diffusion coefficients (see Section 4.1).
This estimator is especially interesting, as it only involves quantities that are directly obtainable from experiments. As such, it might provide a great opportunity to measure the effective charge of macromolecules. To our knowledge, this method has not been suggested before. The derivation of equation 13 assumes the absence of additional salt, i.e. , but can be modified to account for a finite amount of additional salt. A similar analysis can be done using the free and the bound mobility, but these quantities are experimentally more difficult to obtain.
5.5 Co-moving counterions
The last estimator for the effective charge we introduce in this article is based on directly determining the counterions that are co-moving with the polyelectrolyte during free-solution electrophoresis similar to the method used in [40, 39].
When applying an external electric field , the polyelectrolyte moves with a velocity in the direction of the electric field. Co-moving counterions move with the same velocity in the same direction, whereas free counterions move with a velocity into the opposite direction. Here, is the mobility of free counterions.
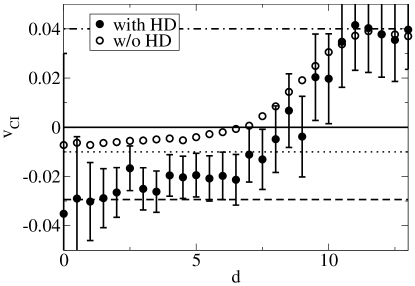
In Figure 16, we plot the velocity of the ions versus the distance to the center of mass of the polyelectrolyte. It can be seen, that ions close to the center of mass are co-moving, i.e. , and ions far away from the chain are indeed freely moving with a velocity . For an intermediate value of , the , i.e. the ions are not moving relative to the electric due to the interaction with the polyelectrolyte. This distance separates the co-moving counterions from the free-moving ones. Similar to (Eq. 9), the effective charge is obtained by averaging the number of counterions found within a distance of the center of mass of the chain.
| (14) |
Note, that for this estimator is the distance of the counterion to the center of mass of the polyelectrolyte, not to the closest polyelectrolyte monomer.
The results shown in Figure 16 indicate a small influence of the hydrodynamic interactions on the value of , but it is important to note that the ion density in this region is very low resulting in almost identical values of the in both cases.
The threshold used for this estimator is not predefined, but has to be determined from the simulation and generally is a function of the chain length. Since has to be determined for each distance to the center of mass of the polyelectrolyte requiring high statistics.
5.6 Comparison
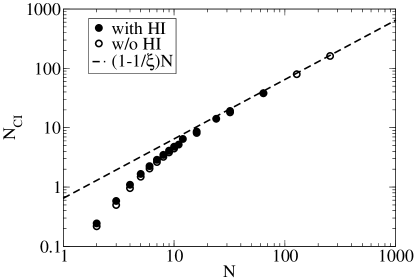
Figure 17 compares the results of all presented charge estimators to . For short chains (), the estimators agree and coincide with the bare, unscreened charge of the polyelectrolyte. In this regime, no counterion condensation is observed.
For intermediate and long chains (), the effective charge is reduced as it deviates from the bare charge and tends towards the Manning prediction. However, it probably will never reach it completely as the polyelectrolyte starts to assume a coiled conformation that is not accounted for in condensation theory. Here, the condensation parameter for the polyelectrolyte system is . In this regime, the simple estimator measures a higher effective charge, i.e., not all condensed counterions that are correctly included in the other estimators are taken into account. This effect is not observed if the cutoff value is chosen using the inflection criterion.
All estimators show no or little influence of the hydrodynamic interactions on the effective charge of the polyelectrolyte counterion complex. This independence on the hydrodynamic interactions has been recently observed for highly charged colloid using a similar simulation approach [39].
Furthermore, no difference between the static estimate, and the dynamic estimates for the effect charge are observed. This is especially remarkable as it is an open question if there is a difference between the static and the dynamic effective charge. For the case of charged colloids this seems to be the case [9, 31], but the results of this work show that for strongly charged linear polyelectrolytes both quantities are identical and one does not have to differentiate between a statically and dynamically renormalized charge.
Two of these estimators are particularly promising. The charge estimator based on the Langevin model, , has the advantage that it is only necessary to determine one dynamic quantity, namely the electrophoretic mobility. All other parameters are directly given by the model. In this way one can obtain an accurate estimate without much computational effort. The ion-diffusion estimator , on the other hand, requires the calculation of three dynamic quantities, which is slightly more costly in simulation but has the great advantage of being directly transferable to experiments, since all needed quantities, i.e., the free ion diffusion, the bound ion diffusion, and the chain diffusion can be measured by standard techniques. To the author’s knowledge, this is the first time this method is proposed to determine the effective charge of polyelectrolytes during electrophoresis.
6 Effective friction
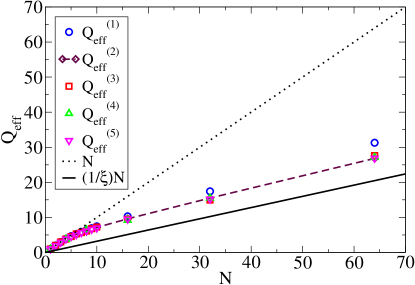
We will now use the effective charge obtained in the previous section to quantify the effective friction of the polyelectrolyte-counterion complex. As shown in Figure 17, the estimators to yield the same effective charge, we thus only employ to determine the effective friction in the following equation:
| (15) |
Here, we use as obtained in Section 4.2.
From the result displayed in Figure 18 we can see that for short chains the effective friction determined by Equation 15 is in agreement with the hydrodynamic polymer friction that follows the Einstein relation. For longer chains, on the other hand, a significant deviation is observed. The effective friction no longer follows the behaviour of the Einstein relation (with ), but instead tends towards a linear increase in N. The length scale separating both regimes is of the order of the Debye length in the system.
From this we infer that the increased effective friction is caused by the counterions close to the polyelectrolyte chain, which destroy long-range hydrodynamic interactions between distant parts of the polyelectrolyte. In this way they also increase the hydrodynamic screening, and effectively decouple the chain monomers from each other. An similar conclusion is obtained in an independent study by Fischer et. al. [41]. The effect is strongly related to the counterion density in the vicinity of the chain and thus depends on the Debye length in the system.
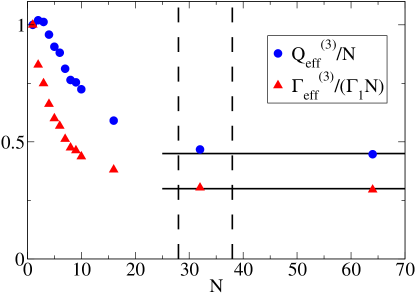
It becomes even more evident when looking at the effective friction per monomer, Figure 19. Initially, for short chains, the effective friction decreases strongly with increasing chain length. The monomers move together through the solvent and can shield each other from the flow and in this way reducing the effective friction with the solvent. For longer chains, this reduction of the effective friction becomes less effective because the counterions that associate with the polyelectrolyte influence the solvent flow around the polyelectrolyte effectively canceling the beneficial shielding effects. On a length scale that is comparable to the Debye length in the system, different parts of the polyelectrolyte become hydrodynamically decoupled and the effective friction per monomer does not depend on the length of the polyelectrolyte any more.
The effective charge per monomer shows a different behaviour. Short chains do not have any bound counterions and show their bare charge of 1e per monomer. With increasing length, they can attract counterions which are then co-moving with the polyelectrolyte and reducing its effective charge. Again the concentration of counterions around the polyelectrolyte plays an important role and the relevant length-scale can be compared to the Debye length. The similarities in length scales of the Debye length to the hydrodynamic screening length have been treated analytically previously in Refs. [42, 43, 44].
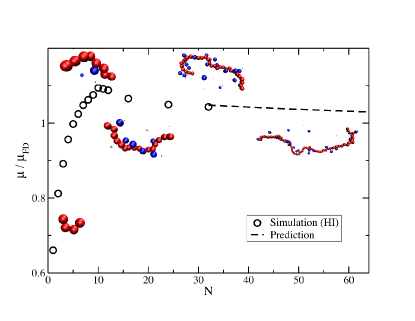
The combined behaviour of effective friction and effective charge leads to the observed length dependent mobility for short chains and the constant mobility for long chains is illustrated in Figure 20. Initially, very few counterions are attracted to the polyelectrolyte and the rise in mobility is due to the hydrodynamic interactions between the chain monomers, which are in an extended conformation. Then, at intermediate chain lengths, the counterion condensation increases, reducing the effective charge of the polyelectrolyte, which leads to the observed maximum. For longer chains, the counterions shield the electrostatic and hydrodynamic interactions between the chain monomers and thereby induce a transistion to less extended conformations, that for even longer chains (not shown here) become globular and coil-like. The screening of hydrodynamic interactions together with the conformational change increases the effective friction of the polyelectrolyte, leading to the observed decrease in the electrophoretic mobility and the long-chain plateau value.
More specifically, the mobility maximum, which is observed for flexible polyelectrolytes, is due to the efficient shielding between monomers for short chains which reduces the effective friction. Stiffer polyelectrolytes experience a stronger friction since the monomers in rod-like conformations can not shield each other that efficiently. This is the reason, why the maximum in the mobility for intermediate chains is only observable for flexible or semi-flexible polyelectrolytes such as PSS or single-stranded DNA but not for the more rigid double-stranded DNA. On the other hand, the decrease of the effective charge by counterion attraction is depending on the linear charge density of the polyelectrolyte. The higher the polyelectrolyte is charge, the more the effective charge is reduced by co-moving counterions. Additionally, we showed that the counterions also increase the effective friction. Both effects work in the same direction and cause the maximum to be shifted to shorter chains (in case of PSS) or disappear completely (for double-stranded DNA).
7 Conclusion
We studied in detail the electrophoretic behaviour of flexible polyelectrolyte chains by means of a coarse-grained molecular dynamics model. The static chain properties have been investigated for various values of the external electric field, and for different salt concentrations. The static properties do not depend on the presence or absence of hydrodynamic interactions. Our results show the expected behaviour of polyelectrolyte chains: the scaling of for short chains exhibits an effective exponent that lies between the infinite dilution exponent, , and the Flory exponent for uncharged chains, , and decreases with increasing salt concentration due to electrostatic screening.
We tested the influence of the strength of an applied external electric field on the chain conformations and the counterion cloud. Below a critical value , no dependence on the field strength is observed, which is in agreement with linear response theory. An applied electric field larger than a critical value of leads to extended chain conformations and to a significant loss of condensed counterions. Our results agree with the theoretical predictions by R. R. Netz [19, 18], which, for our system, yielded a value of .
When simulating the dynamic transport properties, such as diffusion coefficient and electrophoretic mobility, long-range hydrodynamic interactions become crucial. Only when they are included, the experimentally observed behaviour is reproduced and excellent agreement between experiments and simulations is found for our PSS model system. Our results demonstrate convincingly that it is possible to model quantitavively the dynamic behaviour of polyelectrolytes using coarse grained models.
To investigate the dynamics even further, we present five different approaches to estimate the dynamical effective charge of the polyelectrolyte-counterion complex during free-solution electrophoresis. The charges calculated by the estimators are not influenced by hydrodynamic interactions, nor by the fact if they were obtained from static or dynamic observables. Thus we find no difference between a static and a dynamic effective charge. In addition, it is possible to use the estimators in simulations without hydrodynamic interactions that are computationally inexpensive.
For the charge estimate based on the Langevin model, , it is only necessary to determine one dynamical quantity, the electrophoretic mobility. All other parameter are directly given by the model. In this way one can obtain an accurate estimate without too much computational effort. The ion-diffusion estimator , on the other hand, requires the calculation of three dynamical quantities, which is slightly more costly in simulation but has the great advantage of being directly transferable to experiments since all needed quantities, i.e. the free ion diffusion, the bound ion diffusion and the chain diffusion can be measured by standard techniques. To our knowledge, this is the first time, this method is proposed to determine the effective charge of polyelectrolytes during electrophoresis.
Using theses estimators, we determined the length dependence of the effective charge, and combined it with the measurements of the electrophoretic mobility to obtain the effective friction of the polyelectrolyte. The results indicate that this effective friction during electrophoresis is different from the hydrodynamic friction for a single polyelectrolyte chain obtained from diffusion measurements. We attribute this difference to the contribution by the co-moving counterions, which cause a shielding of the hydrodynamic interactions. We identified a hydrodynamic screening length beyond which the effective friction approaches a constant value per monomer which - together with the constant value per monomer of the effective charge - leads to the well-known and observed constant electrophoretic mobility for long polyelectrolyte chains. We showed that this hydrodynamic screening range is comparable to the Debye length for electrostatic screening with the system.
The results of this study provide an in-depth understanding of the microscopic processes that govern the macroscopic behaviour of charged polyelectrolytes in free solution. The characterisation of the dynamical effective friction of macromolecules based on the direct measurement of the effective charge seems to be a promising tool to investigate and understand related systems, such as the dynamics of polyelectrolytes slowed down by additional hydrodynamic drag tags (ELFSE). A study of this topic is currently under preparation.
Acknowledgements
We acknowledge inspiring discussions with U. Scheler on the matter of charge estimators. Furthermore, we thank B. Dünweg, U. Schiller, and G. Slater for helpful remarks. Funds from the the Volkswagen foundation, the DAAD, and DFG under the TR6 are gratefully acknowledged. All simulations were carried out on the compute cluster of the Center for Scientic computing at Goethe University Frankfurt.
References
- [1] P. G. Righetti, ed., Capillary Electrophoresis in Analytical Biotechnology (CRC Press, Boca Raton, 1996).
- [2] H. Cottet, C. Simo, W. Vayaboury, A. Cifuentes, Journal of Chromatography A 1068, 59 (2005).
- [3] V. Dolnik, Electrophoresis 27, 126 (2006).
- [4] J.-L. Barrat, J.-F. Joanny, Advances in Chemical Physics 94, 1 (1996).
- [5] M. Muthukumar, Electrophoresis 17, 1167 (1996).
- [6] A. R. Volkel, J. Noolandi, J. Chem. Phys. 102, 5506 (1995).
- [7] U. Mohanty, N. C. Stellwagen, Biopolymers 49, 209 (1999).
- [8] K. Grass, U. Böhme, U. Scheler, H. Cottet, C. Holm, Physical Review Letters 100, 096104 (2008).
- [9] T. Palberg, et al., J. Phys.: Condens. Matter 16, 4039 (2004).
- [10] H. J. Limbach, A. Arnold, B. A. Mann, C. Holm, Comp. Phys. Comm. 174, 704 (2006).
- [11] T. Soddemann, B. Dünweg, K. Kremer, Eur. Phys. J. E 6, 409 (2001).
- [12] J. D. Weeks, D. Chandler, H. C. Andersen, J. Chem. Phys. 54, 5237 (1971).
- [13] M. Deserno, C. Holm, J. Chem. Phys. 109, 7678 (1998).
- [14] G. R. McNamara, G. Zanetti, Physical Review Letters 61, 2332 (1988).
- [15] P. Ahlrichs, B. Dünweg, J. Chem. Phys. 111, 8225 (1999).
- [16] U. Wolff, Comput. Phys. Commun. 156, 143 (2004).
- [17] M. A. Moore, A. J. Bray, Journal of Physics A-Mathematical and General 11, 1353 (1978).
- [18] R. R. Netz, Journal of Physical Chemistry B 107, 8208 (2003).
- [19] R. R. Netz, Physical Review Letters 90, 128104 (2003).
- [20] X. Schlagberger, R. R. Netz, Europhysics Letters 70, 129 (2005).
- [21] S. Frank, R. G. Winkler, Europhys. Lett. 83, 38004 (2008).
- [22] G. Manning, J. Chem. Phys. 51, 924 (1969).
- [23] F. Oosawa, Polyelectrolytes (Marcel Dekker, New York, 1971).
- [24] G. S. Manning, J. Ray, Journal of Biomolecular Structure and Dynamics 16, 461 (1998).
- [25] D. Stigter, Biophysical Journal 69, 380 (1995).
- [26] J. G. Kirkwood, J. Riseman, Journal of Chemical Physics 16, 565 (1948).
- [27] B. H. Zimm, J. Chem. Phys. 24, 269 (1956).
- [28] U. Böhme, U. Scheler, Macromolecular Chemistry and Physics 208, 2254 (2007).
- [29] E. Stellwagen, Y. J. Lu, N. C. Stellwagen, Biochemistry 42, 11745 (2003).
- [30] U. Böhme, U. Scheler, Colloids and Surfaces A 222, 35 (2003).
- [31] V. Lobaskin, B. Dünweg, M. Medebach, T. Palberg, C. Holm, Phys. Rev. Lett. 98, 176105 (2007).
- [32] B. Dünweg, V. Lobaskin, K. Seethalakshmy-Hariharan, C. Holm, Journal of Physics: Condensed Matter 20, 404214 (2008).
- [33] E. Stellwagen, N. C. Stellwagen, Electrophoresis 23, 2794 (2002).
- [34] D. A. Hoagland, E. Arvanitidou, C. Welch, Macromolecules 32, 6180 (1999).
- [35] H. Cottet, P. Gareil, O. Theodoly, C. E. Williams, Electrophoresis 21, 3529 (2000).
- [36] L. Belloni, M. Drifford, P. Turq, Chem. Phys. 83, 147 (1984).
- [37] L. Belloni, Colloids and Surfaces A 140, 227 (1998).
- [38] M. Deserno, C. Holm, S. May, Macromolecules 33, 199 (2000).
- [39] A. Chatterji, J. Horbach, The Journal of Chemical Physics 126, 064907 (2007).
- [40] V. Lobaskin, B. Dünweg, New J. Phys. 6, 54 (2004).
- [41] S. Fischer, A. Naji, R. R. Netz, Phys. Rev. Lett. 101, 176103 (2008).
- [42] D. Long, J. L. Viovy, A. Ajdari, Physical Review Letters 76, 3858 (1996).
- [43] J. L. Viovy, Reviews of Modern Physics 72, 813 (2000).
- [44] M. Tanaka, A. Y. Grosberg, Euro. Phys. J. E 7, 371 (2002).
-
Fig. 1
Both the end-to-end distance and the radius of gyration at vanishing external field for a monomer concentration of mM exhibit an effective scaling exponent . The hydrodynamic radius shows a different behaviour for short chains and only slowly reaches the asymptotic scaling. The static chain properties are not influenced by hydrodynamic interactions (HI) and fully agree with the ones obtained without HI.
-
Fig. 2
(a) The end-to-end distance and (b) the radius of gyration radius for a chain of monomers differ from the value at zero external field (dashed line), if a critical value is reached. Beyond this threshold, the polyelectrolyte chain is extended (increased and ) and starts to align with the field directed in x-direction. This effect is independent of hydrodynamic interactions (HI).
-
Fig. 3
The end-to-end distance and the radius of gyration at zero external field and for a monomer concentration mM and no added salt ( M) exhibit an effective scaling exponent (dashed line). With M monovalent salt added, the scaling exponent drops down to (dotted line).
-
Fig. 4
The effective scaling factor shows strong dependence of the Debye length. With out added salt (i.e. large Debye lengths) is close to 1, whereas for high salt concentrations (i.e. small Debye lengths) approaches the Flory number, the value of an uncharged polymer.
-
Fig. 5
As a simple estimate of the number of condensed counterions all ions within a distance of around the PE chain are summed up. For long polyelectrolyte chains, the value predicted by Equation 1 is approached. The static counterion distributions are not influenced by hydrodynamic interactions (HI).
-
Fig. 6
The number of condensed counterions for a polyelectrolyte chain of depends on the applied external electrical field. Above a threshold of , counterions start to be stripped from the PE chain and differs from the value at zero field (dashed line). This effect is independent of hydrodynamic interactions (HI).
-
Fig. 7
The diffusion coefficient of a polyelectrolyte chain of length is determined. (a) A fit (dashed line) to the linear part of the mean square displacement yields a diffusion coefficient of via Equation 2. (b) By fitting a power law to the long-time tail of the center of mass auto-correlation function and using Equation 3 we obtain .
-
Fig. 8
The diffusion of a polyelectrolyte chain of length at a monomer concentration mM, normalised by the monomer diffusion , shows the influence of hydrodynamic interactions (HI). With HI a scaling exponent of is obtained (solid line), whereas without HI, the slope is (dashed line). The diffusion in presence of HI agrees with the values obtained from Equation 4, where is determined from the simulation (triangles).
-
Fig. 9
The translational diffusion coefficient measured at a reduced electric field (circles) is in agreement with the measurements at zero electric field (solid line)
-
Fig. 10
The normalised electrophoretic mobility at a monomer concentration of mM with hydrodynamic interactions (HI) reproduces the experimentally observed behaviour and shows a maximum for intermediate chains. Without HI the measures mobility strongly deviates from this showing a decrease with increasing chain length . This behaviour can be explained by Equation 7 in the local force picture (dashed line) and approaches the limiting value of the Manning prediction (Eq. 8).
-
Fig. 11
Electrophoretic mobility of polyelectrolyte chains at monomer concentration mM measured without electric field (circles) and with field at and 0.1 (triangles) with the corresponding error bar. (Data sets have been shifted to increase readability.)
-
Fig. 12
The normalised electrophoretic mobility shows a strong dependence on the monomer concentration . For dilute systems, the experimental behaviour is recovered, while at high monomer concentrations, the shape is significantly altered.
-
Fig. 13
The approximate position of the maximum changes with the Debye length .
-
Fig. 14
The integrated ion distribution for a chain of monomers shows a clear inflection point identified by the zero of the second derivative with respect to . The value of at the inflection point specifies the fraction of condensed counterions .
-
Fig. 15
Estimated charge of polyelectrolyte chains of varying length using Equation 13 with and without hydrodynamic interactions (HI).
-
Fig. 16
The ion velocity distribution for a polyelectrolyte chain of length shows the transition from co-moving counterions with a velocity similar to (dashed line and dotted line indicate with and without hydrodynamic interactions (HI)) to the free ion velocity (dash-dot line). defines the threshold between co- and counter moving ions and is used to determine the effective charge of the polyelectrolyte counterion complex in Equation 14.
-
Fig. 17
The effective charge of polyelectrolyte chains of length using the estimators to . The dotted line indicates the bare, unscreened charge of the polyelectrolyte, whereas the solid line shows a prediction based on counterion condensation theory, with being the condensation parameter. Whereas estimators to agree over the range of lengths tested, overestimates the effective charge of the polyelectrolyte counterion complex.
-
Fig. 18
The effective friction of the polyelectrolyte counterion complex is in agreement with the hydrodynamic friction () for short chains only. For longer chains beyond the Debye length in the system (indicated by the dashed lines) the effective friction deviates and seems to approach a linear behaviour.
-
Fig. 19
The effective charge and the effective friction per monomer show a strong dependence on the chain length for short chains. For long chains, both values are constant. The transition occurs on a length-scale similar to the Debye length (dashed lines).
-
Fig. 20
The interplay between counterion condensation and conformational change of the polyelectrolyte results in the combined behaviour of effective friction and effective charge that leads to the observed length- dependence of the electrophoretic mobility.