Constraining the energy budget of GRB 080721
Abstract
We follow the bright, highly energetic afterglow of Swift-discovered GRB 080721 at out to 36 days or 3106 s since the trigger in the optical and X-ray bands. We do not detect a break in the late-time light curve inferring a limit on the opening angle of and setting tight constraints on the total energy budget of the burst of erg within the fireball model. To obey the fireball model closure relations the GRB jet must be expanding into a homogeneous surrounding medium and likely lies behind a significant column of dust. The energy constraint we derive can be used as observational input for models of the progenitors of long gamma-ray bursts: we discuss how such high collimation-corrected energies could be accommodated with certain parameters of the standard massive star core-collapse models. We can, however, most probably rule out a magnetar progenitor for this GRB which would require 100% efficiency to reach the observed total energy.
keywords:
gamma-rays:bursts1 Introduction
The discovery (van Paradijs et al., 1997; Costa et al., 1997) of afterglows to long-duration gamma-ray bursts (GRBs) showed them to occur in star-forming galaxies at high redshifts. Many aspects of the observed GRB behaviour could be explained reasonably well by the relativistic fireball models, in which the prompt emission is largely produced by shocks internal to the outflow, and the long-lived afterglow by the outflow impacting and shocking the external ambient medium (Mészáros & Rees, 1997; Sari et al., 1998). However, it was early appreciated that if they emitted isotropically then the radiative energies implied for some bursts would be very large (in excess of a Solar rest mass in the case of GRB 990123, for example; Kulkarni et al. 1999). Since no known mechanism can produce high-energy photons with efficiency approaching 100%, the total explosive energy required would be even greater, implausibly large for a stellar core-collapse powered event.
The energetics argument led to the expectation that the GRB outflow must be confined to a jet, reducing the overall energy requirements. In that case a sufficiently massive core collapsing to a black-hole might produce an outflow which could pierce a hydrogen-stripped envelope to still produce a relativistic jet (MacFadyen & Woosley, 1999). This picture received support from the observation of concurrent supernova events at GRB sites for some (low-redshift) low-luminosity bursts (Galama et al., 1998; Hjorth et al., 2003; Stanek et al., 2003; Pian et al., 2006). The class of GRB-supernovae could be explained by the explosion of a Wolf-Rayet star, and it has been widely assumed that this progenitor must account for most if not all long-GRBs.
A strong prediction of all collimated models is that the observed light curve should exhibit an achromatic break, visible in both optical and X-ray light curves, when the relativistic outflow slows to the point that the Doppler beaming angle becomes wider than the opening angle of the jet (Rhoads, 1997): the later the break time, the wider the jet. In the pre-Swift era a number of bursts with good afterglow observations showed breaks in the optical, at times ranging from a few hours to a few days. Furthermore, it was contended that the implied jet opening angles anti-correlated with the isotropic-equivalent -ray energies (Frail et al., 2001) – in other words, corrected for collimation nearly all bursts seemed to be accessing a rather standard energy reservoir (to within about an order of magnitude), potentially usable as standard candles at high redshift. While the total rotational energies available from a collapsing core may be of order 1054 erg, the maximal extraction of energy is unlikely to exceed 1051–1052 erg (Paczynski, 1998; Popham et al., 1999). With this in mind, the standard energy reservoir with energies of 1051 erg appeared very attractive.
Unfortunately the X-ray data available pre-Swift only provided definitive evidence of (single) breaks for a few bursts. One of the expectations of Swift was that many more bursts would be seen with clear breaks in the X-ray coincident with optical breaks. After more than four years of operations this is not what has been found. In fact, the situation is much more confusing, with X-ray light curves exhibiting complex behaviour including flares and plateaux (Nousek et al., 2006; O’Brien et al., 2006; Willingale et al., 2007). When late breaks (beyond a few hours) are seen they rarely coincide in time or degree with optical breaks, and are hard to reconcile with simple fireball model predictions (e.g. Panaitescu et al., 2006), though there are notable exceptions. It is possible that from X-ray data alone a number of jet breaks, particularly those at late times or those which turn over rather smoothly, may go undetected through misinterpretation of their light curves. These so-called ‘hidden’ breaks may be revealed on comparison of X-ray light curves with optical light curves (Curran, van der Horst & Wijers, 2007), but the emphasis remains on X-ray light curves for break detection owing to the large numbers of well-sampled X-ray light curves now available.
Most crucially, in many GRBs no temporal break is seen at all to late times, implying much more energy than expected. The most extreme example to-date is that of GRB 060729, which continued a smooth X-ray power-law decline for 125 d, implying an opening angle greater than 28 degrees (Grupe et al., 2007). This source continues to be monitored in the X-rays with Chandra and was still detected one year after the GRB event (Grupe et al. 2009). The light curve now shows a possible break at 290 d: the nature of this break is not yet known. While the modest luminosity and low redshift of GRB 060729 ( erg, Grupe et al. 2007) make it unsuitable to test collapsar models to their limits, such observations provide a crucial guide to further theoretical developments. If such high collimation-corrected energies continue to be inferred, then the situation looks bleak for simple core-collapse models as the explanation for the high-luminosity long-GRBs. In fact, it would suggest a different progenitor is required for high- and low-luminosity long-bursts. On the other hand, if late breaks are seen, although the jet model is not proven this could provide evidence for an upper envelope to the energy tapped by GRBs which may still be consistent with that available in principle from core-collapse, but would require a new understanding of how such high efficiencies of radiative emission could be achieved.
In this paper we follow a high redshift GRB with a high isotropic energy out to late times to search for a jet break and thereby measure the total energy budget of the prompt -ray emission. In Section 2 we describe the -ray, X-ray and optical observations and analyses. We derive the GRB fluence in Section 3. In Section 4 we characterise the afterglow spectra and light curves and compare the results to the fireball model in Section 5 discussing the possibility of an early jet break. In Section 6 we calculate limits on the jet opening angle and collimation-corrected energy of this GRB. In Section 7 we note the caveats associated with our results, discuss the energetics of this GRB in relation to current popular progenitor models and compare this GRB to other bursts of interest. In Section 8 we conclude.
2 Observations
Throughout this paper we use the conventions for temporal and spectral power law models. Errors are quoted at the 90% confidence level unless otherwise stated.

2.1 -ray
The Swift satellite triggered on GRB 080721 on 2008 July 21 at 10:25:16.979 UT (T0,BAT). The Burst Alert Telescope (BAT) -ray light curve showed approximately six peaks, 3 strong followed by 3 weak, spanning T0,BAT-11 s to T0,BAT+370 s and the burst duration as defined by the T90 parameter was 16.24.5 s (Marshall et al., 2008). The BAT data were reduced using the Swift analysis software version 29 (released 2008 June 29, part of HEAsoft 6.5.1).
The Konus-Wind experiment triggered on the prompt emission of GRB 080721 beginning at 10:25:10.927 UT (T0,KW). The propagation delay from Swift to Konus-Wind is 3.375 s for this GRB, i.e., correcting for this factor one sees that the Konus-Wind trigger time corresponds to T0,BAT-9.427 s. From T0,KW to T0,KW+482.560 s, 64 spectra in 101 channels (from 20 keV to 15 MeV) were accumulated on time scales varying from 64 ms near the trigger time to 8.192 s by the time the signal became undetectable (Golenetskii et al., 2008). Data were processed using standard Konus-Wind analysis tools. The 20 keV–7 MeV peak flux is ()10-5 erg cm-2 s-1 (using the spectrum accumulated over the main peak, from T0,KW+8.448 s to T0,KW+10.494s). The corresponding isotropic peak luminosity is erg s-1.
The -ray light curves from both BAT and Konus-Wind are shown in Fig. 1.
2.2 X-ray
The Swift X-Ray Telescope (XRT) slewed to the burst and began observations in Windowed Timing (WT) mode 113 s after the BAT trigger, detecting the tail of the prompt emission and the X-ray afterglow, and transitioned to Photon Counting (PC) mode in the second orbit of data collection. With XRT we have monitored the bright afterglow out to 1.4106 s or 16 d (Marshall et al., 2008). The XRT data were reduced using the Swift analysis software version 29, as described in Evans et al. (2007, 2009). Light curves use dynamic binning with a minimum binsize of 5 s and spectra are grouped such that a minimum of 20 counts lie in each bin.
We triggered our target-of-opportunity programme on the XMM-Newton satellite to obtain continued observations of GRB 080721 once the X-ray afterglow flux had fallen below the sensitivity limits of the Swift XRT. The afterglow is clearly detected with the European Photon Imaging Cameras’ (EPIC) PN in a 12 ks observation performed on 2008 August 12 and again in a 73 ks observation beginning 2008-08-26 and ending 2008-08-27. The XMM-Newton data were reduced using the standard XMM-Newton Science Analysis Software version 20080701-1801. The second observation is partially affected by high background so we removed periods of background with 1 count s-1 in the PN data leaving 46.5 ks of useful exposure time. We used the tool EDETECT-CHAIN to identify the source position and measure a background-subtracted count rate. We then used ESPECGET to create spectra, and obtain the flux at each epoch by assuming a spectral shape identical to that of the best fit to the time-averaged Swift XRT PC mode spectrum.
2.3 Optical
The UltraViolet-Optical Telescope (UVOT) on-board Swift began observations 118 s after the BAT trigger and found a bright optical afterglow in all optical filters, while the source was not detected in the UV filters (Marshall et al., 2008). Here we will focus on the and bands where temporal coverage was most comprehensive.
We initiated ground-based observations once GRB 080721 became visible from the Roque de Los Muchachos Observatory, La Palma. Observations were taken using the Nordic Optical Telescope (NOT) and the Liverpool Telescope (LT), followed several hours later by observations from Paranal Observatory with the Very Large Telescope (VLT) UT2 (Kueyen). After the initial observations, we initiated our programme for late-time light curve monitoring, obtaining further observations with the LT, the Isaac Newton Telescope (INT), the William Herschel Telescope (WHT) and the VLT UT1 (Antu). All optical afterglow photometry is listed in Table 1. Ground-based optical photometry have been reduced in the standard fashion using IRAF (Tody, 1986). For the photometric calibration, we used the zeropoints for the VLT FORS2, provided by the observatory111http://www.eso.org/observing/dfo/quality/FORS2/qc/photcoeff/photcoeffs_fors2.html, after verifiying the corresponding nights were photometric using standard stars. For the and filters, we converted the and zeropoints to SDSS filters using the conversion at the SDSS webpages222http://www.sdss.org/dr6/algorithms/sdssUBVRITransform.html#Lupton2005. We adopt a Galactic extinction of mag (Schlegel, Finkbeiner & Davis, 1998).
A low resolution spectrum was taken at the NOT from which we measured a redshift of reported in Jakobsson et al. (2008), confirming an earlier redshift determination from independent data (D’Avanzo et al., 2008). Starting on 2008 July 22.121 (0.7 d post-burst), we obtained a sequence of higher resolution spectra using the VLT FOcal Reducer and low dispersion Spectrograph (FORS) 1 in long-slit spectroscopy mode with a 10 wide slit. The progression of grisms used was 300V (1200 s), 1200B (1800 s) and 600V+GG435 (1800 s). The individual spectra were cosmic ray cleaned using the method of van Dokkum (2001). The seeing stayed relatively stable during the observations, between 11 and 13, yielding a spectral resolution of 13.4 (300V), 2.9 (1200B) and 5.9 (600V+GG435) Å full width at half maximum (FWHM). Flux calibration was performed using an observation of the standard star BPM16274. From the optical spectrum we derive a neutral hydrogen column density of log (H I) cm-2. A more detailed analysis of the optical spectra appears in Fynbo et al. (2009).
| Tstart (UT) | Tmid (days since T0,BAT) | Texp (s) | filter | magnitude | flux (Jy) | telescope + instrument |
| 2008-07-21 10:27:14 | 0.0019 | 98.19 | Swift UVOT | |||
| 2008-07-21 10:37:15 | 0.0084 | 9.61 | Swift UVOT | |||
| 2008-07-21 10:39:34 | 0.0105 | 98.20 | Swift UVOT | |||
| 2008-07-21 11:51:29 | 0.0610 | 196.62 | Swift UVOT | |||
| 2008-07-21 12:15:25 | 0.0777 | 196.61 | Swift UVOT | |||
| 2008-07-22 04:13:23 | 0.9049 | 2414.0 | Swift UVOT | |||
| 2008-07-24 00:50:14 | 2.0790 | 1860.5 | Swift UVOT | |||
| 2008-07-21 10:29:01 | 0.0049 | 393.4 | Swift UVOT | |||
| 2008-07-21 10:37:54 | 0.0089 | 19.4 | Swift UVOT | |||
| 2008-07-21 10:41:20 | 0.0135 | 393.5 | Swift UVOT | |||
| 2008-07-21 11:58:19 | 0.0658 | 196.6 | Swift UVOT | |||
| 2008-07-21 12:22:16 | 0.0820 | 135.6 | Swift UVOT | |||
| 2008-07-21 15:23:23 | 0.2118 | 797.2 | Swift UVOT | |||
| 2008-07-22 04:20:38 | 0.9074 | 2524.4 | Swift UVOT | |||
| 2008-08-01 00:30:33 | 10.5880 | 180 | 25.57 0.23 | VLT Antu + FORS2 | ||
| 2008-08-01 00:34:06 | 10.5905 | 180 | 25.64 0.25 | VLT Antu + FORS2 | ||
| 2008-07-21 20:51:00 | 0.4444 | 980 | 20.12 0.12 | NOT + ALFOSC | ||
| 2008-07-22 02:36:32 | 0.6747 | 30 | 20.82 0.08 | VLT Kueyen + FORS1 | ||
| 2008-07-22 02:41:25 | 0.6781 | 30 | 20.80 0.12 | VLT Kueyen + FORS1 | ||
| 2008-07-30 20:57:27 | 9.4533 | 2100 | 25.22 0.50 | WHT + API | ||
| 2008-08-01 00:37:49 | 10.5931 | 180 | 24.94 0.16 | VLT Antu + FORS2 | ||
| 2008-08-01 00:41:23 | 10.5956 | 180 | 25.01 0.17 | VLT Antu + FORS2 | ||
| 2008-08-10 23:11:45 | 20.5467 | 1080 | 25.75 0.44 | VLT Antu + FORS2 | ||
| 2008-08-20 23:40:32 | 30.5695 | 2700 | 26.47 0.28 | VLT Antu + FORS2 | ||
| 2008-07-21 21:10:12 | 0.4585 | 1800 | 20.43 0.10 | LT + RATCAM | ||
| 2008-07-23 22:40:16 | 2.5211 | 1800 | 22.86 0.13 | LT + RATCAM | ||
| 2008-07-24 21:56:17 | 3.4959 | 1500 | 23.47 0.12 | INT + WFC | ||
| 2008-07-27 21:30:27 | 6.4759 | 980 | 24.56 0.28 | INT + WFC | ||
| 2008-08-01 00:45:06 | 10.5981 | 180 | 24.16 0.54 | VLT Antu + FORS2 | ||
| 2008-07-21 22:17:07 | 0.5050 | 1800 | 20.43 0.22 | LT + RATCAM |
3 Measuring the GRB fluence
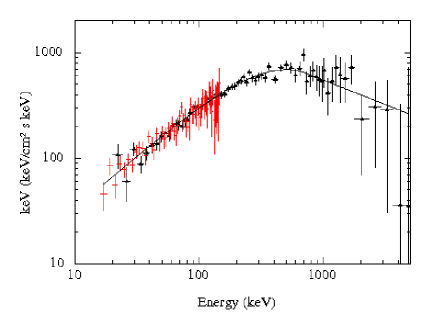
We performed a joint fit to the 20 keV–7 MeV Konus-Wind and 15–150 keV BAT spectra, time integrated over the 23.81 s of simultaneous observations (covering the main peaks of gamma-ray emission, Fig. 1). Adopting the Band function model (Band et al. 1993, in which and are spectral slopes as opposed to the definitions given in Section 2 used elsewhere in this paper) and allowing for a constant normalisation offset between the BAT and Konus instruments, we find the data are well fitted with /dof = 105.6/138. We measure a low energy spectral slope , high energy spectral slope and spectral peak energy keV. The -ray spectral energy distribution, showing the location of the spectral peak in the Konus-Wind energy range at this time, is plotted in Figure 2. The ratio of BAT to Konus-Wind normalisation was , with all other model parameters tied. We also split these observations into four time intervals over which we searched for spectral variability. There is no evidence for highly statistically significant () spectral variations within the measured errors, therefore we use the time-averaged spectral fit parameters in further analysis. We measure a fluence (or time-integrated flux), , of (8.81) erg cm-2 (20 keV–7 MeV) from the joint spectral fit.
4 Characterising the afterglow
4.1 Spectral fits
The X-ray hardness ratio (HR), defined as the count rate ratio in the energy bands 1.5-10 keV/0.3-1.5 keV, indicates that there are no significant X-ray spectral changes throughout the entire duration of Swift XRT observations. We have fit the HR with a constant value and find a value of HR = 0.780.01 with /dof = 222.36/246. To allow for an increase or decrease in HR we fit the data with a linear function and found that this extra degree of freedom does not improve the fit (which then goes to /dof = 221.9/245) but is an equally good fit to the constant value assumption.

To investigate spectral evolution further we created seven time-sliced Swift XRT spectra covering almost the entire decay: T0,BAT+112–288 s (WT), 304–1376 s (WT), 4.5–7.2 ks (PC orbit 2), 10.3–12.9 ks (PC orbit 3), 16.9–18.7 ks (PC orbit 4), 23.3–92.6 ks (PC from orbit 5 to 1.16 d) and 137.7–1400 ks (PC from 1.16 d onwards). We fit these spectra simultaneously with an absorbed power law; the Galactic absorption was fixed to 1020 cm-2 (Kalberla et al., 2005), the intrinsic absorption at was tied i.e. was required to have the same value at each epoch, and the power law photon index, , and normalisation were left as free parameters per epoch. The best fit has /dof = 1765/1307 ( = 1.35). Intrinsic X-ray absorption at the host galaxy is best fitted with cm-2, assuming Solar metallicity, and we note that this is comparable to the column density derived in the optical from hydrogen Lyman-. Plotting the resulting values against the mean photon arrival time per spectrum (Figure 3) we find that an increasing or decreasing spectral slope is not a significant improvement over a constant value fit. The best fitting constant value is , while the standard error between the fit and the datapoints of 0.1 gives a measure of the scatter among the slopes about the constant fit value.
We derived the count rate to flux conversion of 1 count s-1 = 4.110-11 erg cm-2 s-1 from the time-averaged spectrum of the XRT PC mode data from 0.5 d onwards (to coincide with the time range covered by our final light curve fits described in the following section).
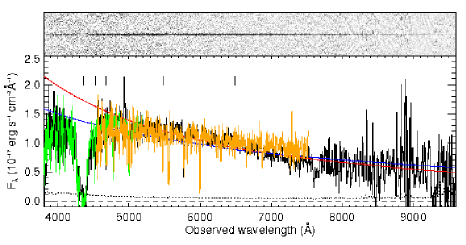
An estimate for the spectral index between optical and X-rays (centred at 1.7 keV) after 0.5 d results in . Note that this estimate does not take into account any optical extinction in the host: we feel that our late-time optical data suffer from too much noise to reliably estimate any extinction in the host galaxy, while the assumption of a standard fireball model may not be valid at the time of the (early) UVOT data where extinction may be best measured. We also attempt to estimate the optical spectral index using our optical spectra taken 0.7 d after the GRB event. The three spectra taken with the VLT are shown in Fig. 4. We overlay on these a power law with spectral slope equal to that found in the X-rays () and a power law with slope shallower by 0.5 () and see that both may be accommodated when all three spectra are included. Again, intrinsic extinction is not included in these power law models and would be impossible to disentangle from the underlying spectral slope in this case. Thus we conclude we cannot reliably estimate .
4.2 Light curve fits
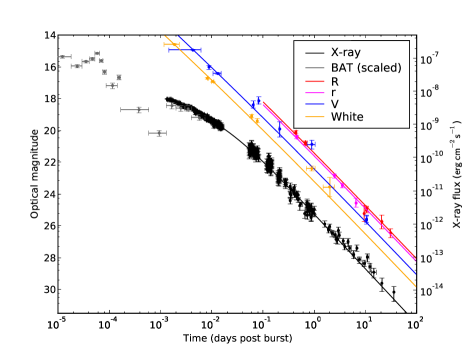
To obtain an estimate of some of the blastwave parameters, we fit the light curves and compare the results with the spectral slope for the X-rays. The full optical and X-ray light curves are shown in Fig. 5. We can obtain a good fit to the X-ray light curve using a smoothly broken power law, as suggested by e.g. Beuermann et al. (1999; subsequently explored further in Granot & Sari 2002), which allows for a smooth transition from one power law to another. We use the formulation
| (1) |
with and the decay parameters before and after the break respectively, , the break time and a “smoothness” parameter for the break (fixed at the value of 1 throughout our fits). We omit the first 430 s of XRT data from the fitting, where we see deviations from a power law shape (e.g. Marshall et al. 2008). Overlap between the XRT and BAT light curves at these very early times also suggests the prompt emission may contribute significantly. Thereafter, the light curve decays in a very smooth fashion.
We simultaneously fit the optical data, where we keep the decay parameters for each optical band tied together. We initially employed models where the decay indices and break time of the X-ray light curve are free parameters, and the optical decays either as a smoothly broken power law as well (with the break time the same as that in X-rays, Fig. 5), or a single power law. The resulting difference between the latter two scenarios is minimal, but the preferred scenario is the smoothly broken power law for both the X-ray and optical light curves, which improved the fits over a sharply broken power law fitted to the optical light curve (the F-test gives a probability of this result being obtained by chance of 0.4%). Based on these initial results, we see a difference at late times between optical and X-ray decay slopes of , which is expected in one particular blastwave scenario (see the following section). We then fitted the models again, but this time we constrained the late-time light curves with a fixed 0.25 slope difference between the X-ray and the optical regime. The resultant fit parameters are shown in Table 2.
| model | (d) | /dof | ||||
|---|---|---|---|---|---|---|
| data from 430 s: | ||||||
| sbplX, plO | — | |||||
| sbplX, sbplO | ||||||
| sbplX, plO with | — | |||||
| sbplX, sbplO with | ||||||
| data from 0.5 d: | ||||||
| pl | — | — | — | |||
| pl, with | — | — | — | |||
| pl, with +0.25 | — | — | — |
We then concentrate our efforts on estimation of the light curve decay of the very late-time data only, where we can be more confident there is little to no influence of possible other components, including flares and energy injection. From 0.5 d onwards, we measure an X-ray decay of (Table 2). This is interestingly and significantly different from the found when we fit the whole dataset from 430 s onwards (in which a single break is best fitted at 0.02 d), and indicates a change in slope which is not obvious when combined with earlier data. Fitting the optical and X-ray decay indices independently rather than tied shows a difference of only , while any difference owing to a so-called cooling break (see the following section) between optical and X-rays should be in the fireball model (e.g. Sari et al., 1998). We thus conclude there is no such spectral break in this scenario.
The question arises as to which of the two fits is actually better: the one containing data from 430 s onwards (smoothly broken power law), or the one with data only after 0.5 d (single power law). For this, we calculate the final value, only for the data past 0.5 d, for both fits. That is, the fits themselves are still done by minimizing calculated from the full applicable data range (post 430 s and post 0.5 d, respectively), but we compare calculated by using only data past 0.5 d for each fit (where likely only a power law applies). The /dof for the smoothly broken power law in this case is rather bad, 111.1/55, compared to 55.3/58 for a power law only. This would indicate that the relatively good total value for the smoothly broken power law fit arises largely from the early data between 430 s and 0.5 d. This could be the case if errors in the early section are slightly overestimated. It could also indicate a second break at X-ray wavelengths in this interval, which would account for the difference in final power law decays ( of 1.6 versus 1.4). Such a break would, however, increase the complexity of the underlying light curve model, and may make it more difficult to interpret the results. Lastly, we could also be seeing effects from fitting a smoothly broken power law, where the second decay index is the actual final decay index, and thus may not be equal to the decay index measured along a small portion of the light curve (see e.g. Jóhannesson, Björnsson & Gudmundsson, 2006).
5 Consistency with the fireball model
We now investigate whether or not the data are consistent with the fireball model predictions. We use the closure relations (found in, e.g., Table 1 of Zhang & Mészáros 2004) relating the optical and X-ray spectral and temporal slopes to determine how this GRB afterglow may fit into the standard fireball model. In Section 4.2 we have performed the same light curve fits to two subsets of the data: one beginning at 430 s since the GRB and one beginning 0.5 d since the GRB, with two different outcomes. Following the reasoning in the last paragraph of Section 4.2, we examine the results obtained from fitting the data from 0.5 d to a single power law.
The late-time temporal fits show that the slopes are essentially the same in the X-ray and optical bands, with , which indicates that both observing bands are in the same spectral regime, either both below or above the cooling break. In the case where they are both below the cooling break and the circumburst medium is homogeneous, the value of can be derived to be from (well within the range of previously found values, Shen et al. 2006; Starling et al. 2008), and the predicted temporal slope is , which is consistent with the observed value. A stellar-wind-like medium or a scenario in which both the optical and X-ray bands are situated above the cooling frequency can be ruled out by the standard closure relations between the spectral and temporal indices. The value for the X-ray spectral index, however, is somewhat at odds with the estimated , if there is no supposed break across the range. Host galaxy extinction may mean the intrinsic optical magnitudes are brighter than those observed, allowing an increase in , which could resolve this apparent discrepancy. To investigate this, we can combine the optical photometry (Table 1) with an X-ray spectrum to estimate extinction from the broadband spectral energy distribution (SED) in the case that . The SED, centred at 1.725 d, was created and fitted via the method outlined in Starling et al. (2007) and adopts a single absorbed power law as the underlying model and Small Magellanic Cloud-like host galaxy extinction. We find that extinction is required at the level of , corresponding to magnitudes. This value is one of the highest measured for a GRB host galaxy (Starling et al., 2007; Schady et al., 2007a), but such measurements are made only for GRBs with detected optical afterglows and presumably extinction is much higher in the optically undetected dark bursts (e.g. Cenko et al., 2009; Fynbo et al., 2009).
For completeness we performed the same tests on the best-fitting smoothly broken power law model to the data from 430 s onwards. We find that the power law index of the electron energy distribution, , derived from the light curve predicts harder spectral indices than are observed. We investigated the possibility of an additional spectral component, caused by Inverse Compton (IC) emission, which would harden the spectrum (as also proposed for e.g. GRB 990123, Corsi et al. 2005 and GRB 000926, Harrison et al. 2001). Following the equations in Sari & Esin (2001) and Corsi et al. (2005), we find that the closure relations for the temporal and spectral indices still can not be satisfied. We note that in this scenario the break at 0.02 d may be considered an early jet break. There are two arguments against attribution of this feature to the jet break. Firstly, after a jet break the temporal slopes are given by , regardless of whether the observing frequency is above or below the cooling frequency, so the optical and X-ray temporal slopes should be the same. This is not the case for this dataset. Secondly, if this feature were a jet break it would imply an opening angle of 0.44∘ (calculated using the equations in the following section), far smaller than most previously determined values (e.g. Frail et al., 2001; Berger, Kulkarni & Frail, 2003, but see also Schady et al. 2007b; Racusin et al. 2008).
Concluding, the results from fits to the late-time only data indicate that both observing bands are in the same spectral regime and in order to correctly predict the X-ray spectral slope the jet must be traversing a homogeneous medium. The difference between the optical-to-X-ray spectral index and the X-ray spectral slope is not predicted, but could be explained by the invocation of host galaxy extinction of . The results from using the full range of data can not be satisfactorily described by the fireball model and/or with an early jet break, and it is likely that in this case a single smoothly broken power law model is not applicable.
6 Energetics
These data have shown that a late-time temporal break at X-ray or optical wavelengths is not required. We can therefore use the latest observation time as a lower limit to any jet break time, and calculate the required limits on opening angle and total energy budget for the GRB jet. To calculate the isotropic energy we use the following equation
| (2) |
adopting the values listed in Sections 2 and 3 (, fluence erg cm-2) and a luminosity distance of 6.51028 cm (where km s-1 Mpc-1, and , adopted in order to compare our value with the sample of Kocevski & Butler 2008). We find erg. We have not included a correction, because the energy range used encompasses the peak energy, and the measured fluence should be sufficiently close to the bolometric fluence333For comparison, the restframe 1–10000 keV fluence is 7.99 erg cm-2 corresponding to erg.
Using this value for we can go on to calculate an upper limit on the jet opening angle (e.g. Frail et al., 2001), since no jet break is seen up to our last XMM-Newton observation. This is assuming we may apply the fireball model for the case of a uniform jet (see Section 5 for further discussion of this).
| (3) |
Adopting typical values for efficiency and density of and cm-3, we find radians or (.
The lower limit on the total energy budget in -rays for the GRB is then obtained from the following equation which accounts for jet collimation using the newly derived jet opening angle upper limit,
| (4) |
which gives erg, or more conservatively taking the lower limit for then erg using the end of the final XMM-Newton observation (36.08 d or 3.12106 s) as our lower limit on any jet break time.
7 Discussion
7.1 Summary of results and associated caveats
We have followed the afterglow of the high , relatively high redshift GRB 080721 to beyond 106 s at both X-ray and optical wavelengths. The late-time decay is well fitted with a single power law with no requirement for a break. This suggests that the jet break must lie beyond the detection limits of the intruments used, and from this we calculate a lower limit to the total prompt -ray energy of the GRB of erg and to the jet opening angle of . This relies on the assumption that the fireball model describes the physics of the jet, the jet is uniform in structure, and that the standard values for surrounding density and efficiency of energy conversion are applicable. We note that the dependence of the total energy on these latter two parameters is very weak (Equation 2). We have compared the closure relations from the fireball model with the observed temporal and spectral slopes. The model and the observations cannot be reconciled for the whole dataset, with departures from the model at early times (before half a day), and different temporal slopes are derived depending on whether data before 0.5 d are included in the fit. It is likely that additional components combine with the afterglow emission at the onset of the afterglow, rendering the fireball model inapplicable, but at what time the afterglow begins to dominate is not known. This illustrates the difficulties of pinning down the details of the blastwave physics even when broad-band well-sampled data are available. The data either from 0.5 d or from 430 s onwards require that the GRB jets traverse a homogeneous circumburst medium. The apparent inconsistency between the X-ray spectral index and the optical to X-ray spectral index may be caused by extinction in the host galaxy.
We have also investigated the alternative scenario in which an earlier break in the light curve at 0.02 d is the jet break, and found that this can not work within the fireball model. If we assume the fireball model, and therefore that one of the measured observational parameters is contaminated (perhaps by an additional component or incorrect other assumption), the implied jet opening angle would be very small (0.44∘) for a GRB (or indeed any known jet source). Such collimation cannot be explained by any current models and the chances of the narrow jet happening upon our line-of-sight are small. We do not prefer this scenario for these reasons, but we note that this explanation has been the preferred model for some other GRBs which we discuss in Section 7.3. In the following subsection we summarise the main classes of long GRB progenitor models, and discuss whether any of these can reach energies 1052 erg and beyond.
7.2 Implications for GRB progenitor models
In the collapsar scenario, two different ways to extract energy to make a GRB are suggested in the literature, one using neutrinos and the other harnessing magnetic fields.
In the neutrino-driven model, the energy that can be extracted depends sensitively on the accretion rate of collapsing material onto the newly formed black hole through the accretion disc and on the Kerr parameter describing the rotation of the black hole, as seen in Table 3 of Popham et al. (1999; see also MacFadyen & Woosley 1999; Aloy et al. 2000; Nagataki et al. 2007). For typical long GRB durations (tens to hundreds of seconds) a GRB total energy of 1052 erg is certainly possible within this model particularly for fast rotation rates. The observational testing of such models depends, therefore, not on measurements of GRB total energies but on determination of the rotation and mass accretion rates. According to the recent GRB progenitor models by Yoon & Langer (2005), Yoon, Langer & Norman (2006) and Woosley & Heger (2006), a lower metallicity star is preferred for a higher Kerr parameter. Yoon & Langer (2005) and Yoon, Langer & Norman (2006) introduced models of chemically homogeneous evolution which produces helium stars with little or no hydrogen envelope that are metal-poor fast-rotators, and can therefore go on to form a GRB. The complexities of stellar evolution are not all well understood, and make the determination of GRB progenitors a difficult undertaking.
However, the identification of the crucial role of metallicity opens up an avenue for observational constraints. We can measure the metallicity of the circumburst medium or host galaxy along the line-of-sight to GRBs through afterglow spectroscopy, and for most long GRBs metallicities of order a tenth the Solar value have been inferred from this method (Fynbo et al., 2006; Prochaska et al., 2007), with the lowest measured value being Solar for GRB 050730 (Chen et al., 2005; Starling et al., 2005b; Prochaska et al., 2007) though lines are often saturated hence likely to provide only lower limits on the metallicity (Prochaska, 2006). We can measure the metallicity, , of the environment of GRB 080721 from the column densities of neutral hydrogen (H I Ly) and singly ionised silicon (Si II 1808 Å) in absorption (Fig. 4) of [Si/H]-1.1. All the other observed spectral lines are likely to be saturated, hence we have used the weakest detected metal line. This equates to times the Solar value, within the typical distribution for GRBs. While this should strictly be treated as a lower limit due to possible saturation of the Si II 1808 Å line, saturation is likely to be moderate at most and, therefore, the actual metallicity of the absorber should be of the order of one tenth of solar, unless significant dust depletion effects are at play (as silicon is a mildly refractory element). If the metallicity is significantly lower than 0.1 Solar, the Kerr parameter may be close to (Yoon & Langer, 2005; Yoon, Langer & Norman, 2006), and an energy of 11052 erg could be easily achieved according to the calculations of Popham et al. (1999). A high metallicity could be an indication of large initial stellar masses, or simply that the models are not applicable.
The magnetic-field-driven model uses the Blandford-Znajek mechanism to extract rotation energy from the black hole (Blandford & Znajek, 1977). This idea is indeed supported by the recent general relativistic magnetohydrodynamical simulations by Barkov & Komissarov (2008) and Komissarov et al. (2009). The energies that can be extracted are up to 1054 erg at 100% efficiency. Typical efficiencies are likely to be far lower than this (but see Komissarov et al., 2009), and with 1% efficiency the lower limit on total energy of GRB 080721 can be accommodated. Here again the Kerr parameter is an important factor in determining the available energy, in which case lower metallicity progenitor stars may be preferable.
Interestingly, the measured energy limit for GRB 080721 is comparable to the energy budget in the magnetar scenario (Thompson, Chang & Quataert, 2004), where the extraction of the rotational energy of a millisecond pulsar by strong magnetic fields is suggested (Duncan & Thompson, 1992; Wheeler et al., 2000; Thompson, Chang & Quataert, 2004; Komissarov & Barkov, 2007). The magnetar scenario for long GRBs has received renewed interest in recent observational works, where it has been suggested to explain some plateau phases and very steep X-ray declines (Zhang & Mészáros, 2001; Rosswog & Ramirez-Ruiz, 2003, specifically in e.g. GRB 070110, Troja et al. 2007; Lyons et al. 2008). The claim of an 8 s periodicity in the highest energy bands for GRB 090709A suggests association with a magnetar for this source (Golenetskii et al., 2009; Gotz et al., 2009; Markwardt et al., 2009; Ohno et al., 2009). The theoretical prediction for the upper limit on the energy of a maximally rotating neutron star is few1052 erg (Thompson, Chang & Quataert, 2004), and we note that 1052 erg is the lower limit we derive for this GRB implying very high efficiency close to 100%. We therefore conclude that it is unlikely that GRB 080721 is produced via magnetar formation.
7.3 Comparison with other long GRBs
The implied total energy for GRB 080721 based on the lower limit calculated here is not only a challenge to some progenitor models, but is a rare occurrence among GRBs. We have compared this limit to the energies measured from detections of jet breaks in a Swift sample of GRBs published by Kocevski & Butler (2008) in Fig. 6. The lower limit for GRB 080721 is much larger than any energy measured from a jet break in this sample. Comparing this source with the Amati relation (Amati et al., 2008) we see that it falls at the high – end of the correlation, in a continuation of the long GRB population out to the most energetic sources. The XMM-Newton observations have enabled a longer baseline for jet searches and this source was chosen specifically for its unusually high isotropic energy.

GRB 061007 (Mundell et al., 2007; Schady et al., 2007b) was also a highly energetic GRB with an isotropic energy of 11054 erg (Golenetskii et al., 2006). The closure relations for this source were also not entirely satisfied and no spectral evolution was found from 80 s to 3.1 d after the trigger. The high implied total energy, in both the wind and homogeneous medium cases considered in Schady et al. (2007b) led the authors to conclude that an early jet break must have occurred, before T0+80 s, which implies a highly collimated outflow with opening angle –, four times smaller than any determined previously. This scenario, which we investigated for GRB 080721 in Section 5 and subsequently ruled out, requires that the narrow jet happens to lie along our line-of-sight, may be supported by the rarity of such non-evolving afterglows and the unusually high initial optical brightness for GRB 061007. However, we discussed long GRB progenitor models in the previous section for which the large energies measured both for GRB 061007 and in this paper for GRB 080721 when assuming a very late, unobserved jet break with a more typical jet opening angle, are in fact achievable.
Another case for which the observations implied a high energy budget, while the standard fireball model was a poor description of the afterglow, was GRB 080319B (Racusin et al., 2008). This collapsar scenario for this long GRB is, however, supported by the detection of a supernova signature (Tanvir et al., 2008). To explain the complex afterglow behaviour, not smooth and featureless in this case but appearing to have a number of components including an initially extremely bright optical counterpart, Racusin et al. (2008) introduced a second jet. This 2-jet model consisted of an inner jet with = 0.03 d and opening angle 0.2∘ and an outer jet more typical of GRBs with = 11.6 d and opening angle 4∘. Double and even triple jet systems are occasionally invoked when single jet models simply cannot explain the observations (e.g. GRB 030329, Berger et al. 2003; GRB 021004, Starling et al. 2005a; GRB 050401, Kamble et al. 2009; GRB 050802, Oates et al. 2007, De Pasquale et al. 2009), and while it is likely to be more physical to assume some structure across the jet (e.g. Rossi, Lazzati & Rees, 2002; Zhang & Mészáros, 2002), the interaction of multiple jets is not well known.
8 Conclusions
We have observed the bright, highly energetic afterglow of GRB 080721 out to 36 days since the trigger in the optical and X-ray bands. We conclude that no jet break is present in the late-time light curve and we rule out a jet-break origin for the early light curve break, inferring a limit on the opening angle of and setting constraints on the total energy budget of the burst of erg within the fireball model. To obey the fireball model closure relations the GRB jet must be expanding into a homogeneous medium and be extincted in the optical bands by approximately 0.6 magnitudes. The energy constraint we derive can be used as observational input for models of the progenitors of long gamma-ray bursts. We can likely rule out a magnetar progenitor for this GRB as this would require close to 100% efficiency to reach the observed total energy. Such high collimation-corrected energies could be accommodated with certain parameters of the standard massive star core-collapse models. One of the key observational parameters in distinguishing between various core-collapse models is the metallicity, diagnostic only if it lies outside of the typical range of . The metallicity we measure for GRB 080721 unfortunately does not allow a distinction between models to be made.
The occurrence of such highly energetic or narrowly beamed GRBs is rather rare, and for those which have the required measurements to allow a study such as this one on GRB 080721 we estimate there may be a handful per year among the 100–130 well localised GRBs currently triggering operational satellites. Measurement of the high energy spectral peak, securing the redshift and monitoring the light curves for as long as possible (preferably in multiple bands) are all crucial, and these data have shown that a full understanding of the blastwave physics can be difficult to achieve even with a good quality, well-sampled, broad-band dataset. To determine whether these sources are true outliers from the GRB population, perhaps requiring different or more extreme progenitors, will require dedicated efforts to build up small samples to compare with each other and with the growing database of more typical GRBs.
9 Acknowledgments
We acknowledge useful discussions with Andrew Read, Jenny Carter, Daniele Malesani and Tayyaba Zafar. RLCS, ER, KLP, KW, PAC and JPO acknowledge financial support from STFC. AJvdH is supported by an appointment to the NASA Postdoctoral Program at the MSFC, administered by ORAU through a contract with NASA. S-CY is supported by the DOE SciDAC Program (DOE DE-FC02-06ER41438). PJ acknowledges support by a Marie Curie European Re-integration Grant within the 7th European Community Framework Program under contract number PERG03-GA-2008-226653, and a Grant of Excellence from the Icelandic Research Fund. This work made use of data supplied by the UK Swift Science Data Centre at the University of Leicester and XMM Newton data taken under AO-7 Proposal No. 055597. The Konus-Wind experiment is supported by a Russian Space Agency contract and RFBR grant 09-02-00166a. Based on observations made with ESO Telescopes at the Paranal Observatory under programme ID 081.D-0853. The INT and WHT are operated on the island of La Palma by the Isaac Newton Group in the Spanish Observatorio del Roque de los Muchachos of the Instituto de Astrofísica de Canarias. The Liverpool Telescope is operated on the island of La Palma by Liverpool John Moores University in the Spanish Observatorio del Roque de los Muchachos of the Instituto de Astrofisica de Canarias with financial support from the UK Science and Technology Facilities Council. Based on observations made with the Nordic Optical Telescope, operated on the island of La Palma jointly by Denmark, Finland, Iceland, Norway, and Sweden, in the Spanish Observatorio del Roque de los Muchachos of the Instituto de Astrofísica de Canarias. We thank Birgitta Nordstrom and Edita Stonkute for performing the NOT observations.
References
- Aloy et al. (2000) Aloy M.A., Müller E., Ibáñez J.M., Martí J.M., MacFadyen A., 2000, ApJ, 531, L119
- Amati et al. (2008) Amati L., Guidorzi C., Frontera F., Della Valle M., Finelli F., Landi R., Montanari E., 2008, MNRAS, 391, 577
- Band et al. (1993) Band D. et al., 1993, ApJ, 413, 281
- Barkov & Komissarov (2008) Barkov M.V., Komissarov S.S., 2008, MNRAS, 385, L28
- Berger et al. (2003) Berger E. et al., 2003, Nature, 426, 154
- Berger, Kulkarni & Frail (2003) Berger E., Kulkarni S.R., Frail D.A., 2003, ApJ, 590, 379
- Beuermann et al. (1999) Beuermann K. et al., 1999, A&A, 352, L26
- Blandford & Znajek (1977) Blandford R.D., Znajek R.L., 1977, MNRAS, 179, 433
- Cenko et al. (2009) Cenko S.B. et al., 2009, ApJ, 693, 1484
- Chen et al. (2005) Chen H.-W., Prochaska J.X., Bloom J.S., Thompson B., 2005, ApJ, 634, L25
- Chevalier & Li (1999) Chevalier R.A., Li Z.-Y., 1999, ApJ, 520, L29
- Corsi et al. (2005) Corsi A. et al., 2005, A&A, 438, 829
- Costa et al. (1997) Costa E. et al., 1997, Nature, 387, 783
- Curran, van der Horst & Wijers (2007) Curran P.A., van der Horst A.J., Wijers R.A.M.J., 2008, MNRAS, 386, 859
- D’Avanzo et al. (2008) D’Avanzo P. et al., 2008, GCN Circular 7997
- De Pasquale et al. (2009) De Pasquale M. et al., 2009, MNRAS, 392, 153
- Duncan & Thompson (1992) Duncan R.C., Thompson C., 1992, ApJ, 392, L9
- Evans et al. (2007) Evans P.A. et al., 2007, A&A, 469, 379
- Evans et al. (2009) Evans P.A. et al., 2009, MNRAS in press
- Frail et al. (2001) Frail D.A. et al., 2001, ApJ, 562, L55
- Fynbo et al. (2006) Fynbo J.P.U. et al., 2006, A&A, 451, L47
- Fynbo et al. (2009) Fynbo J.P.U. et al., 2009, ApJS submitted
- Galama et al. (1998) Galama T. et al., 1998, Nature, 395, 670
- Golenetskii et al. (2006) Golenetskii S., Aptekar R., Mazets E., Pal’shin V., Frederiks D, Cline T., 2006, GCN Circular 5722
- Golenetskii et al. (2008) Golenetskii S. et al., 2008, GCN Circular 7995
- Golenetskii et al. (2009) Golenetskii S. et al., 2009, GCN Circular 9647
- Gotz et al. (2009) Gotz D., Mereghetti S., von Kienlin A., Beck M., 2009, GCN Circular 9649
- Granot & Sari (2002) Granot J., Sari R., 2002, ApJ, 568, 820
- Grupe et al. (2007) Grupe D. et al., 2007, ApJ, 662, 443
- Harrison et al. (2001) Harrison F.A. et al, 2001, ApJ, 559, 123
- Hjorth et al. (2003) Hjorth J. et al., 2003, Nature, 423, 847
- Jakobsson et al. (2008) Jakobsson P. et al., 2008, GCN Circular 7998
- Jóhannesson, Björnsson & Gudmundsson (2006) Jóhannesson G., Björnsson G., Gudmundsson E.H., 2006, ApJ, 640, L5
- Kalberla et al. (2005) Kalberla P.M.W., Burton W.B., Hartmann D., Arnal E.M., Bajaja E., Morras R., Poppel W.G.L., 2005, A&A, 440, 775
- Kamble et al. (2009) Kamble A., Misra K., Bhattacharya D., Sagar R., 2009, MNRAS, 394, 214
- Kocevski & Butler (2008) Kocevski D., Butler N., 2008, ApJ, 680, 531
- Komissarov & Barkov (2007) Komissarov S.S., Barkov M.V., 2007, MNRAS, 382, 1029
- Komissarov et al. (2009) Komissarov S.S., Vlahakis N., Königl A., Barkov M.V., 2009, MNRAS, 394, 118
- Kulkarni et al. (1999) Kulkarni S. et al., 1999, Nature, 398, 389
- Lyons et al. (2008) Lyons N., O’Brien P.T., Zhang B., Willingale R., Troja E., Starling R.L.C., 2008, MNRAS submitted
- MacFadyen & Woosley (1999) MacFadyen A., Woosley S., 1999, ApJ, 524, 262
- Markwardt et al. (2009) Markwardt C.B., Gavriil F.P., Palmer D.M., Baumgartner W.H., Barthelmy S.D., 2009, GCN Circular 9645
- Marshall et al. (2008) Marshall F.E., Guidorzi C., Ward P.A., Barthelmy S., Burrows D.N., Roming P., Gehrels N., 2008, GCN Report 156.1
- Mészáros & Rees (1997) Mészáros P., Rees M., 1997, ApJ, 476, 232
- Mundell et al. (2007) Mundell C.G. et al., 2007, ApJ, 660, 489
- Nagataki et al. (2007) Nagataki S., Takahashi R., Mizuta A., Takiwaki T., 2007, ApJ, 659, 512
- Nousek et al. (2006) Nousek J.A. et al., 2006, ApJ, 642, 389
- Oates et al. (2007) Oates S.R. et al., 2007, MNRAS, 380, 270
- O’Brien et al. (2006) O’Brien P.T. et al., 2006, ApJ, 647, 1213
- Ohno et al. (2009) Ohno M. et al., 2009, GCN Circular 9653
- Paczynski (1998) Paczynski B., 1998, ApJ, 494, L45
- Panaitescu et al. (2006) Panaitescu A. et al., 2006, MNRAS, 366, 1357
- Panaitescu (2007) Panaitescu A., 2007, MNRAS, 380, 74
- Pian et al. (2006) Pian E. et al., 2006, Nature, 442, 1011
- Popham et al. (1999) Popham, Woosley S., Fryer C., 1999, ApJ, 518, 356
- Prochaska (2006) Prochaska J.X., ApJ, 650, 272
- Prochaska et al. (2007) Prochaska J.X., Chen H.-W., Dessauges-Zavadsky M., Bloom J., ApJ, 666, 267
- Racusin et al. (2008) Racusin J. et al., 2008, Nature, 455, 183
- Rhoads (1997) Rhoads J., 1997, ApJ, 487, L1
- Rossi, Lazzati & Rees (2002) Rossi E.M., Lazzati D., Rees M.J., 2002, MNRAS, 332, 945
- Rosswog & Ramirez-Ruiz (2003) Rosswog S., Ramirez-Ruiz E., 2003, AIPC, 727, 361
- Sari et al. (1998) Sari R. et al., 1998, ApJ, 497, L17
- Sari & Esin (2001) Sari R., Esin A.A., 2001, ApJ, 548, 787
- Schady et al. (2007a) Schady P. et al., 2007, MNRAS, 377, 273
- Schady et al. (2007b) Schady P. et al., 2007, MNRAS, 380, 1041
- Schlegel, Finkbeiner & Davis (1998) Schlegel D.J., Finkbeiner D.P., Davis M., 1998, ApJ, 500, 525
- Shen et al. (2006) Shen R.-F., Kumar P., Robinson E.L., 2006, MNRAS, 371, 1441
- Stanek et al. (2003) Stanek K.Z. et al., 2003, ApJ, 591, L17
- Starling et al. (2005a) Starling R.L.C., Wijers R.A.M.J., Hughes M.A., Tanvir N.R., Vreeswijk P.M., Rol E., Salamanca I., 2005a, MNRAS, 360, 305
- Starling et al. (2005b) Starling R.L.C. et al., 2005b, A&A, 442, L21
- Starling et al. (2007) Starling R.L.C., Wijers R.A.M.J., Wiersema K., Rol E., Curran P.A., Kouveliotou C., Heemskerk M.H.M., 2007, ApJ, 661, 787
- Starling et al. (2008) Starling R.L.C., van der Horst A.J., Rol E., Wijers R.A.M.J., Kouveliotou C., Wiersema K., Curran P.A., Weltevrede P., 2008, ApJ, 672, 433
- Tanvir et al. (2008) Tanvir N.R. et al., 2008, ApJ submitted, arXiv:0812.1217
- Thompson, Chang & Quataert (2004) Thompson T.A., Chang P., Quataert E., 2004, ApJ, 611, 380
- Tody (1986) Tody D., 1986, Instrumentation in astronomy VI; Proceedings of the Meeting, Tucson, AZ, Mar. 4-8, 1986. Part 2 (A87-36376 15-35). Bellingham, WA, Society of Photo-Optical Instrumentation Engineers, p.733.
- Troja et al. (2007) Troja E. et al., 2007, ApJ, 665, 599
- van Dokkum (2001) van Dokkum P.G., 2001, PASP, 113, 1420
- van Paradijs et al. (1997) van Paradijs J. et al., 1997, Nature, 386, 686
- Wheeler et al. (2000) Wheeler C.J., Yi I., Höflich P., Wang L., 2000, ApJ, 537, 810
- Willingale et al. (2007) Willingale R. et al., 2007, ApJ, 662, 1093
- Woosley & Heger (2006) Woosley S.E., Heger A., 2006, ApJ, 637, 914
- Yoon & Langer (2005) Yoon S.-C., Langer N., 2005, A&A, 443, 643
- Yoon, Langer & Norman (2006) Yoon S.-C., Langer N., Norman C., 2006, A&A, 460, 199
- Zhang & Mészáros (2001) Zhang B., Mészáros P., 2001, ApJ, 552, L35
- Zhang & Mészáros (2002) Zhang B., Mészáros P., 2002, ApJ, 571, 876
- Zhang & Mészáros (2004) Zhang B., Mészáros P., 2004, IJMPA, 19, 2385