Twins Among the Low Mass Spectroscopic Binaries
Abstract
We report an analysis of twins of spectral types F or later in the 9th Catalog of Spectroscopic Binaries (SB9). Twins, the components of binaries with mass ratio within 2% of 1.0, are found among the binaries with primaries of F and G spectral type. They are most prominent among the binaries with periods less than 43 days, a cutoff first identified by Lucy. Within the subsample of binaries with P days, the twins do not differ from the other binaries in their distributions of periods (median P d), masses, or orbital eccentricities. Combining the mass ratio distribution in the SB9 in the mass range 0.6 to 0.85 M⊙ with that measured by Mazeh et al. for binaries in the Carney-Latham high proper motion survey, we estimate that the frequency of twins in a large sample of spectroscopic binaries is about 3 %. Current theoretical understanding indicates that accretion of high specific angular momentum material by a protobinary tends to equalize its masses. We speculate that the excess of twins is produced in those star forming regions where the accretion processes were able to proceed to completion for a minority of protobinaries. This predicts that the components of a young twin may appear to differ in age and that, in a sample of spectroscopic binaries in a star formation region, the twins are, on average, older than the binaries with mass ratios much smaller than 1.
1 Introduction
Stars form by fragmentation and grow to their final mass by accretion from the molecular cloud and their immediate surroundings. Binaries, and higher order multiples, are common products of star formation (see for example Patience et al. (2002), Delgado-Donate et al. (2004) and references therein). Broadly, the same processes of fragmentation and accretion also operate on a protobinary, with the additional possibilities of dynamical interactions with circumbinary disks and other protostars in the star forming region. Bate et al. (2002) in their Fig. 2 list the sequence of events that produced some of their model binaries. The variety of processes and their diverse sequences are bewilderingly complex. Nonetheless, there is a theoretical consensus that, for binaries with small separations, AU, the accretion processes favor the formation of binaries with mass ratios approaching 1 (see the pioneering work of Artymowicz, 1983, and the reviews by Bate, 2002, and Clarke, 2007). We use mass ratio in the usual sense, = secondary mass/primary mass. The distribution of mass ratios, , thus provides a fossil remnant of the processes that produced the final masses of their components. There are two general approaches to the measurement of . Mass ratios in angularly resolved binaries are determined by photometric estimates of the component masses. This approach depends on, and is limited by, using a reliable mass-luminosity relation and knowing the distance to the binaries. To get close to the epoch of star formation in well-defined young clusters, Patience et al. (1998, 2002) studied the visual binary population of the Hyades, Persei, and Praesepe, determined masses photometrically, and measured down to . In the second approach spectroscopic velocity measurements of a double-lined spectrocopic binary (SB2) yield directly, thereby avoiding the uncertainties of the mass-luminosity relation and distances. The spectroscopic measurements are usually directed at binaries with much shorter periods than the visible binaries and that are angularly unresolved. The only statistically complete dynamical measurement of over the full mass ratio range of a well-defined sample of binaries of which we are aware was obtained by Mazeh et al. (2003, M03). Bender (2006) and Bender and Simon (2008) describe the start of such a determination for the Hyades open cluster.
In this paper we are concerned with understanding two aspects of the dynamically measured of SB2s. First, M03 measured of main sequence double-lined spectroscopic binaries (SB2s) drawn from the Carney-Latham survey of high proper motion stars in the galactic disk (Carney et al. 1994, CL94). They showed that is approximately constant for in the mass range 0.6 to 0.85 M⊙. The second aspect is that of the stellar “twins”, the primary and secondary components of SB2s with very nearly the same mass, first identified in Lucy and Ricco’s (1979) seminal work. Tokovinin (2000, T00) showed that twins with were present at a small but statistically significant level in a sample of main sequence binaries with primaries of spectral type K0V to F5V and periods in the range 2 to 30 days. Tokovinin suggested that accretion from a circumbinary disk could be responsible for their formation. Lucy (2006, L06) confirmed and sharpened the result using the large sample in the 9th Catalog of the Elements of Spectroscopic Binaries (Pourbaix et al. 2004, SB9). Lucy found that twins in the SB9 are limited to narrow interval and that the twin phenomenon is most prominent among the spectroscopic binaries with periods less than 43 days.
We wanted to understand why twins did not appear in M03’s work. We therefore sought answers to the following questions in this work:
1) What are the properties of the low-mass twins? How do they differ from other spectroscopic binaries?
2) What is their frequency?
3) What is their origin?
We divided the SB2s in the the SB9 into subsamples by mass that were large enough to provide statisically significant results (§2) and describe the period spectral type, and mass ranges of the twins in §3. We estimate the frequency at which the twins are found in §4. We discuss our findings and a possible formation mechanism in §5.
2 Contents of the SB9 Relevant To This Study
We used the SB9 catalog111http://sb9.astro.ulb.ac.be as it was available on 4 June, 2007. Of the 2746 binaries in the catalog, 930 are SB2s, binaries with measured velocity semi-amplitudes and . Defining the relative uncertainty of by
where the ’s are standard deviations, listed in SB9 for and , we extracted two samples of SB2s according to the precision with which their mass ratio was known.
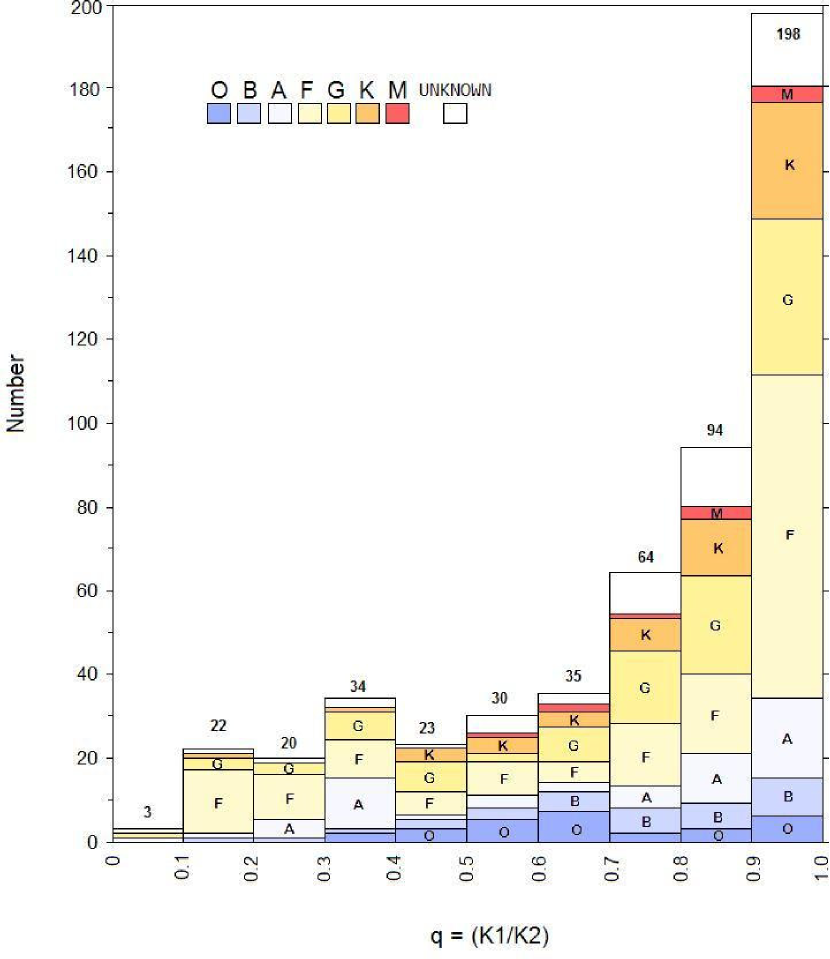
The first sample, SN3, consists of 524 SB2s with signal-to-noise, . We used the SN3 to obtain an overview of the SB2s with reliable ’s. Fig. 1 plots the number of SB2s, N(), vs q with the mass ratio binned by . A few binaries in the SB9 have calculated mass ratios slightly greater than 1.0, one as large as 1.04. Mass ratios slightly larger than 1 are the result of either mistaking the primary for the very similar secondary or are the result of the uncertainties in the velocity semi-amplitudes. Therefore, for such cases we set the s to their inverse values. SB2s in SN3 span essentially the entire mass ratio range, to 1.0. Within each bin, we show the number of binaries by spectral type of the primary as listed in SB9. Binaries with primaries of spectral types F and G dominate each bin even though the stellar luminosity function indicates that M dwarfs greatly outnumber the more massive stars of earlier spectral types. This selection effect probably arises in the facts that F and G stars have many sharp spectral lines in the visible that enable precision velocity measurement and that M stars are under-represented because they are faint. We discuss the other striking feature of Fig. 1, the large number of SB2s with , in the Appendix.
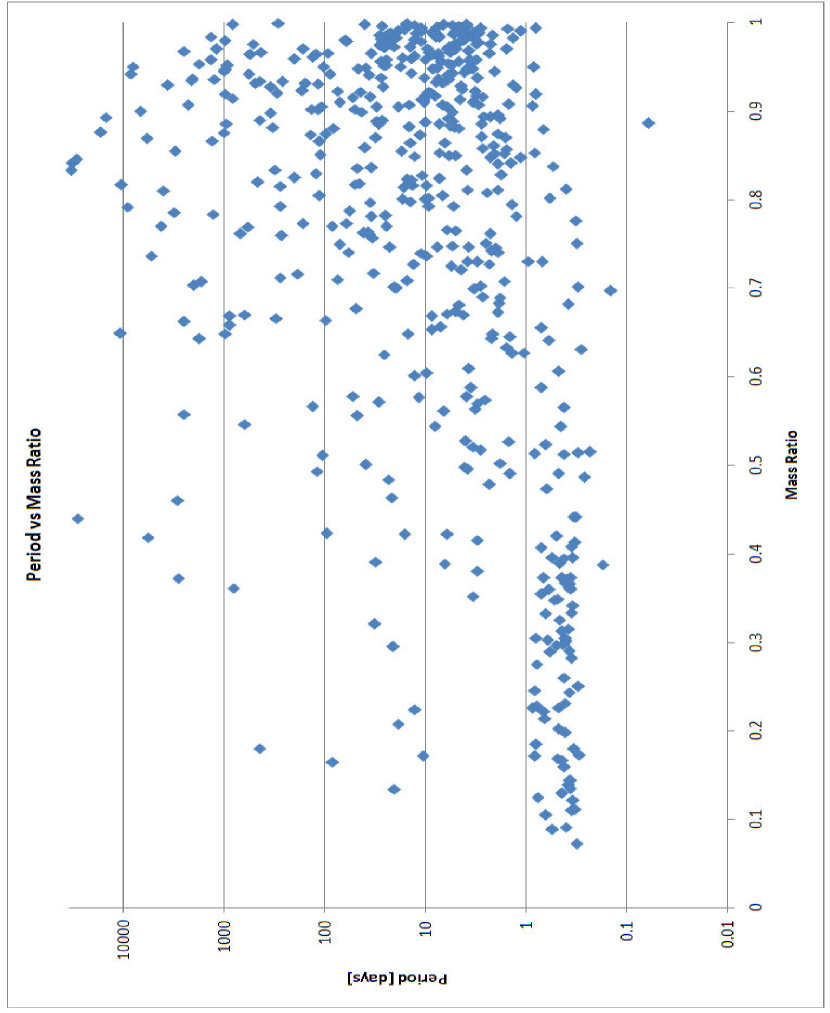
Figure 2 shows the orbital period, P, mass ratio for the SB2s in SN3; a large number of binaries are found at low values, less than , for example. Secondaries in the low mass ratio binaries are normally not detected by visible light spectroscopy because the strong dependence of luminosity on mass favors the detection of SB2s with high mass ratios (Carney et al. 1994; Tokovinin 2000). Fig. 2 shows that this selection effect is important below and is probably insignificant above at . Fig. 2 also shows that most of the low mass ratio binaries have periods day. They are probably eclipsing binaries and fortuitous orientation explains their presence in the SB9.
We also defined a high precision sample, HPS, containing SB2s with and . The precision of the HPS and its mass ratio range are identical to L06’s high precision sample, . We restricted the HPS to include spectral types F or later for two reasons. We wanted a sample comparable to Tokovinin’s (2000) study and, more specifically, our goal was to compare the of the HPS to M03’s result. The HPS contains 112 SB2s, 10 more than L06’s even though we limited the range of spectral types, probably because the number of binaries with precise q-values increased between 2005 and 2007. The SB9 as a whole contains 141 SB2s with . The HPS contains 64 systems with an F spectral type spectrum, probably that of the primary, 31 G’s, and 17 K’s. Of the systems with F spectral type spectra for which the SB9 provides a luminosity classification, there are 23 dwarfs, three subgiant-dwarfs, two subgiants, one giant-subgiant, and two giants. Of the G-spectra with luminosity classification, 18 are dwarfs and one a subgiant. Six of the K spectral type spectra indicate dwarfs, one is a subgiant, and one a giant.
3 Properties of the Low-Mass Twins
Lucy (2006) showed that twins among the SB2s with precisely determined mass ratios, lie in a exceedingly well defined and small mass ratio range 0.98 to 1.0. Properties of the twins are therefore best studied in our HPS. Figure 3 plots the N() distribution of the binaries in the HPS, binned to . We divided the sample according to whether the orbital periods were greater or less than 43 days because L06 had shown that the statistical significance of the twins is diluted at the longer periods. N() for the P days binaries is approximately constant in the seven -bins centered at 0.85 to 0.97 at the average value . The distribution shows a strong concentration in the last bin centered at . These are the twins and we will refer to their location as the twins bin. Their excess, the number greater than the average at smaller ’s, is significant at the 3.5 level. There is no excess of twins among the SB2s with P days. Application of the test shows that the probability that the two distributions for period greater or less than 43 days are the same, differing only by random noise, is 0.04. The two distributions are almost certainly different. The statistical significance of the twins would be diminished if the binning of the distribution were much larger. These results agree completely with Lucy’s (2006), as they should, because the HPS contains only more binaries than the .
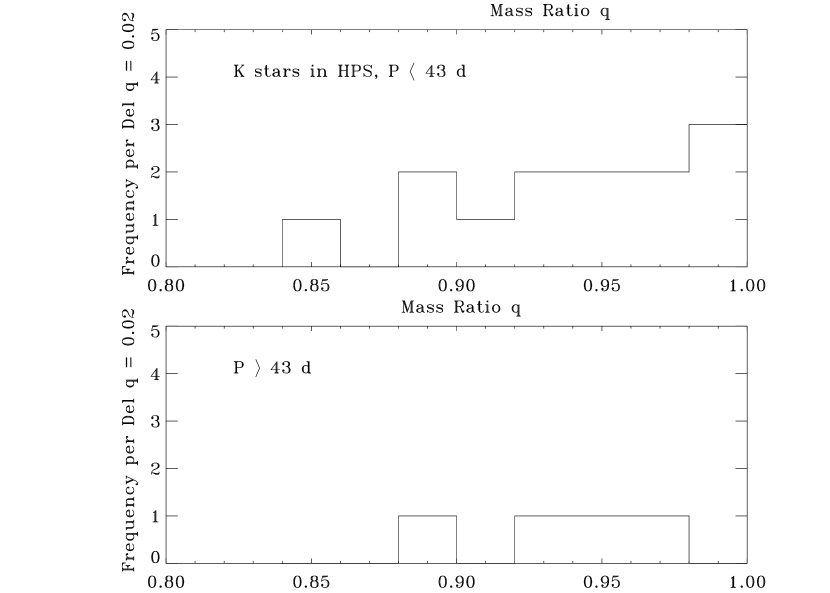
Figures 4, 5, and 6 show for the SB2s with F, G, and K type spectra in the HPS. Binaries having periods less than and greater than 43 days plotted separately. An excess of twins is evident for the short period F and G systems, significant at the levels for the P day binaries. Only 3 twins are present among the the binaries with K type spectra. If twins are present at the same frequency as in the F and G star samples, about a third of those samples, the number of twins expected among the 13 K star binaries would be 4. This close to the 3 that are observed but their number is not statistically significant because the K-star sample is so small.
Figures 3, 4, and 5 show that for mass ratios smaller than the twins peak, N(q) does not decrease significantly toward , and in fact appears roughly constant. This indicates that there is no bias against detecting secondaries in this mass ratio range. Figure 7 shows the distribution of periods for the binaries in the HPS. Only the periods of the binaries with F and G type spectra are plotted because the binaries with K type spectra did not show a significant excess of twins. The dashed histogram shows the period distribution of only the twins, the solid one for all the F and G binaries in the HPS. A chi-square test indicates a 62% probability that the two distributions are drawn from the same parent distribution. The two distributions have the same median period days. Figure 8 plots the eccentricities of the F and G binaries in the HPS. The binaries show the effects of circularization at the short periods (some of the binaries with periods of a few days have their eccentricities set at 0.0 in the SB9) but there is no obvious difference between the eccentricity distribution of the twins and of the binaries with . Figure 8 also shows clearly that twins are short period systems; there are none in the HPS with Pd. We do not regard this as significantly different from the 43d limit derived by Lucy (2006) because the HPS and Lucy’s sample are slightly different in content. The median spectral type among the F stars is about F5 for the twins and others. Among the G stars, the median spectral type is G1 for the twins and G4 for the others. The periods, eccentricities, spectral types, and hence masses, of the twins do not differ significantly from the other binaries in the P samples.
4 Comparison of the High Precision Sample and the Mazeh et al. (2003) Survey
The binaries surveyed by M03 have primary masses in the range 0.60 to 0.85 M⊙ and K2 to F8 spectral types222The mass estimates are given in Table 1 and 2 of M03 and are quoted from Carney et al (1994). The spectral types are as given in the SIMBAD Astronomical Database of the Centre de Donées Astonomiques de Strasbourg. The spectral types of the stars are consistent with their colors. Since the spectral type is a directly measured parameter we used it to define the coverage of the HPS that would be consistent with the M03 sample.. In this range of spectral types, the M03 sample contains 16 K’s, 41 G’s, and 5 F’s (percentages 26, 66, and 8, respectively). In order to compare the M03 to the HPS we selected binaries of spectral type K2 to F8 from the HPS. This yielded an HPS subsample consisting of 12 K’s, 31 G’s, and 15 F’s (percentages 21, 53, and 26, respectively). The two samples do not have identical composition with F’s favored in the HPS subsample. The mass of a typical FV star on the main sequence is M⊙, for a GV, it is M⊙. It is difficult to see why the formation of twins would be very different for stars this similar in mass. Hence it seems unlikely that the different fractions F’s in the HPS and M03 would affect the mass ratio distribution. Fig. 9 shows the number distribution vs of the HPS subsample. All the binaries are plotted, regardless of period, because M03 used no period cutoff in defining their sample. N() is approximately constant in the range at binaries per interval. The 15 twins in the last bin represent an excess over significant at the level.
The mass ratio distribution derived by M03, , is shown in their Fig. 9. Here, in Fig. 10 of this paper, we reproduce M03’s result but plot it as a frequency distribution where , the number in M03’s sample. The values of are per , the binning used by M03. Figure 10 shows that the frequency distribution derived from M03’s work is constant over at least the range to 1.0 at the values for the directly observed distribution (top panel) and for the corrected one (bottom panel).
We can estimate the frequency of twins among SB2s in the galactic disk if we assume that the binaries in the M03 and the HPS subsample (as in Fig. 9) have similar frequency distributions. Using the value from M03 the frequency of twins, is
% represents our estimate of frequency of twins in a bin in the M03 sample. (It is not the excess over the mean frequency.) At %, and a 62 binary sample size, M03’s study might have contained twins, but if it had, their number would not have been statistically significant333The SB2 G 87-20 in M03 with is consistent with being a twin. We thank the referee for noticing this.. We emphasize that the % uncertainty represents the formal statistical value of counting statistics; it does not include any uncertainty resulting from comparison of the M03 and HPS samples.
5 Discussion
5.1 Nature of the Twins
Twins are found in the range of spectral type K2 to F8 in the HPS (Fig. 9). That twins are also of masses greater than corresponding to F8 spectral type is indicated by the presence of twins of spectral type F0 and F2 in the HPS. These are included in the “twin bin” in Fig. 4. Twins with components outside the K2 to F0 range are not found in the HPS. We do not know whether this is the result of the difficulty in identifying SB2s and measuring their parameters precisely or of the formation mechanism of the twins. We believe the former is the more likely because Fig. 1 indicates that most of the binaries in the SN3 are of F and G spectral type, Fig. 6 indicates that the sample of K-star binaries available in the HPS is too small to measure their number reliably, and because we cannot identify a reason for a cutoff in twin formation outside this range.
The twins are distinguished from the other binaries with very precisely determined parameters only by the fact that they are found at periods less than 43 days, the demarcation identified by Lucy (2006) or, in our HPS, at periods less than 25 days. In fact, half of the twins have periods less than 7 days. For a typical component mass of 0.75 M⊙, hence 1.5 M⊙ total mass of the binary twin, the 7 and 43 day periods correspond to semi-major axes 0.08 and 0.28 AU, respectively. Theoretical modeling shows that the high mass ratio binaries form by the accretion of high specific angular momentum material from the molecular cloud and that the separation of the protobinary components increases as the accretion continues (Bate 2000 and earlier references therein). Our empirical result indicates that this mechanism operates most effectively on the binaries that now have separations less than AU and had smaller separations in their protobinary phase.
5.2 A Possible Formation Mechanism
Within the sample of binaries with P days, the twins are not different from the binaries with mass ratios in the range in their periods, eccentricities, and masses. The frequency of twins in a large sample of binaries of diverse origins is small, only about 3 % if our linking the HPS and M03 samples is valid. This suggests that the accretion processes acting to equalize the masses of the protobinary components proceed to completion at mass ratio 1 in only a small fraction of protobinaries. Hertzsprung-Russell diagrams of diverse star forming regions show that typically there is a spread of a few million years in the ages of their stars. It is plausible then that protobinaries do not have the same amount of time available to form their final masses; the most recently formed may experience accretion from the molecular cloud for the shortest time. The form of the mass ratio distribution at the end of binary formation in a region thus contains information not only about the accretion processes but about their history.
These ideas are testable by observation. First, consider a region where star formation is still continuing, in which astronomers have identified spectroscopic binaries, and have measured their mass ratios. When stars are young, theoretical isochrones of different ages are well separated in the HR diagram. It is thus possible to determine reliable estimates of the relative, if not absolute, ages of the stars in the region. According to the accretion scenario applied to a protobinary, the initially lower mass secondary preferentially gains in mass. Our suggestion for twin formation thus predicts that if mass equalization proceeds to completion, the star that was the original secondary will reach its final mass later than the original primary and appear younger. This may explain the few year difference in age of the components of Parenago 1802, a pre-main sequence twins binary in the Orion Cluster (Stassun et al. (2008). On average, twins need more time to reach their final mass ratio than do the lower mass ratio binaries. Thus, for star forming regions in which a large sample of SB2s with a distribution of mass ratios is available, our suggestion also predicts that the twins are older, on average, than the binaries with smaller mass ratios.
According to our scenario, the form of the mass ratio distribution, , in a cluster is determined by the time dependence of the rate of star formation and how the mass accreted is distributed between the secondary and primary during the evolution of the protobinary. Given that an ensemble of SB2s have such a distribution, it is not the existence of twins that is significant but rather their excess above the average of at . The excess in an open cluster is determined by the average mass accretion rate during the formation of its stars, and by the duration of star formation. Calculation of model ’s on this scenario is beyond the scope of this paper, but we note that Artymowicz(1983) described early analytical models for the formation of an excess of twins. The mass ratio distribution of the SB2s in an open cluster is a fossil record of its epoch of star formation. Measurements of will require large samples of SB2s with well determined mass ratios. For specificity, consider the necessary size of a well defined sample in order that it yield a statistically significant number of twins. If twins occur at the estimated frequency 3.4%, a sample size of 250 would yield 9 twins which would be significant at the level. The more stringent requirement that the number of twins must be significant as an excess over the average distribution at the level would require a sample of 560. Samples such as these are far bigger than available now but the availability of fiber-fed multi-object spectrographs suggests that they are not out of reach.
6 Summary
1) We confirm Lucy’s (2006) statistically significant identification of twins, binaries with masses within 2% of each other, in the 9th Catalog of Spectroscopic Binaries (Pourbaix et al. 2004).
2) Demographics of the low mass (spectral type later than F8) SB2 population show that twins are indistinguishable from other binaries except that twins are found at periods less than 25 d. However, the median periods of the twin and non-twin populations are the same, d.
3) The mass ratio distribution is approximately constant for .
4) Combining (3) with Mazeh et al’s (2003) determination of a constant mass ratio distribution between and 1 for SB2s drawn from the Carney-Latham sample, we estimate that the frequency of twins in such a sample is %.
5) The low frequency of twins explains why they do not appear in the Mazeh et al. (2003) sample; it was too small to yield a statistically significant number of twins.
6) Theoretical studies of mass accretion by a protobinaries (e.g. Bate 2004; Clarke 2007) and the observational result that star formation in a given region lasts a few million years, suggest that low mass twins are formed in binary populations in which the accretion processes have the time to proceed to completion.
7) The finite time duration over which a protobinary accretes mass also suggests that the star in a twin that was initially the lower mass component will appear younger than its companion. This effect may be responsible for the unequal ages of the components in the twin binary Parenago 1802 reported by Stassun et al. (2008).
8) The mass ratio distribution of an open cluster represents a fossil record of the mass accretion rate, star formation rate, and duration of the epoch of star formation in their region of origin.
Appendix A Binaries with in the SN3 Sample
There are 198 SBs with mass ratios between 0.9 and 1.0 determined to a precision (Fig. 1). Of these, 180 have known spectral types. The F, G, and K spectral type binaries are the most common at levels 77, 37, and 28, respectively, compared to their corresponding numbers 64, 31, and 17 in the HPS. The differences are simply those SBs whose mass ratios did not satisfy the cutoff for inclusion in the HPS. We excluded SBs of spectral type O, B, and A from the HPS, and no M spectral type SBs satisfied the precision cutoff. We summarize the characteristics of the SBs of these spectral types in the SN3 with here:
O-spectral type SB2s- There are 6, the longest period among them is 6.1 d. One of the O-type SBs is a twin in the strict sense of this paper, and .
B-spectral type SB2s- There are 9, their longest period is 15.3 d. The group contains one twin.
A-spectral type SB2s- There are 19, most have periods of a few days but there are two with relatively long periods, 135 and 6810 d. The group includes 3 twins.
M-spectral type SB2s- There are 4, no twins among them. One binary has a 1015 d. period, the others have periods of a few days.
Thus, twins are found among binaries with components more massive than 1.6 M⊙. Their formation by accretion processes that equalize the masses may be similar to those for the less massive stars (Zinnecker and Yorke, 2007) but other mechanisms may also be important. For example, Krumholz and Thompson (2007) show that mass transfer during a pre-main sequence phase of deuterium burning can equalize the masses of the components.
References
- (1) Artymowicz, P. 1983, Acta. Astron. 33, 223
- (2) Bate, M.R. 2000, MNRAS, 314, 33
- (3) Bate, M.R., Bonnell, I.A. and Bromm, V. 2002, MNRAS, 336, 705
- (4) Bate, M.R. 2004, RevMexAA (Serie de Conferencias), 21, 175
- (5) Bender, C. 2006, PhD thesis, Stony Brook University
- (6) Bender, C.F. and Simon, M. 2008, AJ, in press for December, 2008, astr-ph 0808.3393
- (7) Clarke, C.J. 2007, astro-ph 0707.0973
- (8) Carney, B.W. et al. 1994, AJ, 107, 2240
- (9) Delgado-Donate, E.J. 2004, MNRAS, 351, 617
- (10) Krumholz, M.R. and Thompson, T.A. 2007, ApJ. 661, 1034
- (11) Lucy, L.B. and Ricco, E. 1979, AJ, 84, 351
- (12) Lucy, L.B. 2006, A&A, 457, 629
- (13) Mazeh, T. et al. 2003, ApJ, 599, 1344
- (14) Patience, J. et al. 1998, AJ, 115, 1972
- (15) Patience, J. 123, 1570, 2002
- (16) Pourbaix, D. et al. 2004, A&A, 424, 727
- (17) Stassun, K. et al. 2008, Nature, 453, 1079
- (18) Tokovinin, A.A. 2000, A&A, 360, 997
- (19) Zinnecker, H. and Yorke, H.W. 2007, ARAA, 45, 481