Discovery of slow X-ray pulsations in the high-mass X-ray binary 4U 2206+54
Abstract
Context. The source 4U 2206+54 is one of the most enigmatic high-mass X-ray binaries. In spite of intensive searches, X-ray pulsations have not been detected in the time range - s. A cyclotron line at 30 keV has been suggested by various authors but never detected with significance. The stellar wind of the optical companion is abnormally slow. The orbital period, initially reported to be 9.6 days, disappeared and a new periodicity of 19.25 days emerged.
Aims. The main objective of our RXTE monitoring of 4U 2206+54 is to study the X-ray orbital variability of the spectral and timing parameters. The new long and uninterrupted RXTE observations allow us to search for long (1 hr) pulsations for the first time.
Methods. We divided the 7-day observation into five intervals and obtained time-averaged energy spectra and power spectral density for each observation interval. We also searched for pulsations using various algorithms.
Results. We have discovered 5560-s pulsations in the light curve of 4U 2206+54. Initially detected in RXTE data, these pulsations are also present in INTEGRAL and EXOSAT observations. The average X-ray luminosity in the energy range 2–10 keV is erg s-1 with a ratio . This ratio implies an eccentricity of 0.4, somewhat higher than previously suggested. The power spectrum is dominated by red noise that can be fitted with a single power law whose index and strength decrease with X-ray flux. The source also shows a soft excess at low energies. If the soft excess is modelled with a blackbody component, then the size and temperature of the emitting region agrees with its interpretation in terms of a hot spot on the neutron star surface.
Conclusions. The discovery of X-ray pulsations in 4U 2206+54 confirms the neutron star nature of the compact companion and definitively rules out the presence of a black hole. The source displays variability on time scales of days, presumably due to changes in the mass accretion rate as the neutron star moves around the optical companion in a moderately eccentric orbit. If current models for the spin evolution in X-ray pulsars are correct, then the magnetic field of 4U 2206+54 at birth must have been G.
Key Words.:
stars: individual: 4U 2204+54, BD+53∘2790 – X-rays: binaries – stars: neutron – stars: binaries close –stars: emission line, Be
| ObsID | MJD start–MJD stop | On-source | I | Obs. |
| time (s) | c s-1 | int. | ||
| 01-01-05 | 54235.1628–54235.1908 | 1600 | 17.8 | A |
| 01-01-02 | 54235.8369–54236.1095 | 23472 | 28.2 | A |
| 01-01-03 | 54236.8613–54237.1036 | 20672 | 28.0 | B |
| 01-01-04 | 54237.8639–54238.0000 | 11696 | 30.0 | B |
| 01-02-00 | 54238.0010–54238.0841 | 7120 | 18.1 | C |
| 01-02-01 | 54238.8408–54239.0647 | 17328 | 8.8 | C |
| 01-02-01 | 54239.0865–54239.1199 | 2384 | 7.4 | D |
| 01-02-02 | 54239.8821–54240.0452 | 11328 | 6.6 | D |
| 01-02-02 | 54240.0671–54240.1124 | 2512 | 5.6 | D |
| 01-02-02 | 54240.1365–54240.1799 | 2256 | 3.2 | D |
| 01-02-03 | 54240.8137–54241.0263 | 13584 | 5.7 | D |
| 01-02-03 | 54241.0482–54241.0930 | 2528 | 7.9 | E |
| 01-02-05 | 54241.1412–54241.1604 | 400 | 6.9 | E |
| 01-02-040 | 54241.7899–54241.9452 | 9328 | 10.7 | E |
| 01-02-040 | 54241.9545–54242.0069 | 3776 | 7.3 | E |
| 01-02-040 | 54242.0287–54242.0743 | 2544 | 6.2 | E |
| 01-02-04 | 54242.0982–54242.1408 | 2256 | 5.1 | E |
| 01-02-04 | 54242.1663–54242.1991 | 1984 | 4.9 | E |
| : Background subtracted 4–30 keV, PCU2 only | ||||
1 Introduction
The X-ray source 4U 2206+54 is one of the most enigmatic high-mass X-ray binaries (HMXB). Although it has been studied by numerous ground- and space-based observatories, many questions about the nature of its variability patterns remain unanswered. In the optical and UV bands, the emitting spectrum is complex (Negueruela & Reig 2001) and far from that of a Be star. Initially classified as a B0-2 star (Steiner et al. 1984), the optical counterpart defies any standard spectral analysis. The absence of any obvious long-term trends in the evolution of the H line spectral parameters and the lack of any correlation between the H line equivalent width and infrared magnitudes and colours rules out a Be classification. However, the strength and shape of the H line do not resemble those seen in supergiant stars either. Although the presence of an O9.5V star is virtually secured, the He abundance is abnormally strong (Blay et al. 2006).
Without a circumstellar disc around the donor, the material needed for accretion and production of X-rays must come from the stellar wind. However, the expected X-ray luminosity using the typical wind velocities of an O9.5V star is about two orders of magnitude lower than the observed X-ray luminosity erg s-1. The distance to 4U 2206+54 is estimated to be 2.6 kpc (Blay et al. 2006). Ribó et al. (2006) found that the wind terminal velocity of 4U 2206+54 is abnormally slow (350 km s-1). With such a low velocity, an eccentric orbit and using the Bondi-Hoyle formalism it is possible to reproduce the average X-ray luminosity of the system as well as the orbital variability seen in the RXTE/ASM light curve between 1996 and 2005. 4U 2206+54 is the only permanent wind-fed HMXB with a main-sequence donor (Ribó et al. 2006).
Equally enigmatic is the nature of the compact companion, which has not been settled beyond doubt. Although a neutron star is the most likely scenario, the low X-ray luminosity, compared to other persistent HMXB, has been used as an argument to suggest the presence of a white dwarf (Saraswat & Apparao 1992; Corbet & Peele 2001), while the lack of pulsations and the similarities with LS 5039 do not allow us to rule out a black hole companion (Negueruela & Reig 2001) – the most recent results show, however, that LS 5039 is probably a non-accreting neutron star (Ribó et al. 2008).
Broad-band X-ray observations favour the presence of a neutron star (Torrejón et al. 2004). When modelled with Comptonization models, the resulting seed photons have keV, while the bolometric luminosity is low ( erg s-1). The only way to reconcile these two results is by invoking a small emitting area ( km), like that of a polar cap in a neutron star (Masetti et al. 2004), also ruling out the presence of an accretion disc (Torrejón et al. 2004). The presence of a magnetic field with G is implied by the possible detection of a cyclotron resonance scattering feature at 30 keV. Although the statistical significance of this feature is only marginal, it has been observed by three different observatories, namely RXTE, BeppoSAX and INTEGRAL (Torrejón et al. 2004; Masetti et al. 2004; Blay et al. 2005).
Another debated question is the orbital period of the system. Corbet & Peele (2001) reported an orbital period of 9.6 days. This value was based on observations made with the RXTE ASM instrument over 5 years. This orbital period was refined to 9.5591 days by Ribó et al. (2006) using 9 years worth of data of the same instrument. However, Corbet et al. (2007) could not find the 9.6-day modulation in the light curves of SWIFT BAT and RXTE ASM for observations carried out from 2004 to 2005. Instead, they found a strong modulation at 19.25 d, that is, consistent with twice the 9.6-day period (or 19.12 d).
In this paper we investigate the X-ray variability of 4U 2206+54 on time scales of hours to days. The main objective is to search for 1-hr pulsations and study possible spectral and timing orbital variability.


2 Observations
4U 2206+54 was observed by the Rossi X-ray Timing Explorer (RXTE) during the interval 15–22 May 2007 (JD 2454235.1628–2454242.1991) for a total on-source time of 136.8 ks. Observation time with RXTE was awarded in response to the A11 call for proposals and corresponds to the RXTE proposal P92068. Light curves, spectra and response matrices were extracted using the tools available in the RXTE subpackage of version v.6.4 of the FTOOLS software package.
RXTE is designed to facilitate the study of time variability in the emission of X-ray sources with moderate spectral resolution. The pay-load consists of a Proportional Counter Array (PCA), which is sensitive to X-rays in the 2-60 keV energy range and has a total effective area of 6500 cm2, shared by five PCU or proportional counter units (Jahoda et al. 1996). PCA data can be collected and telemetered to the ground in many different ways depending on the intensity of the source and the spectral and timing resolution desired. In this work we used the two standard modes: Standard1 provides 0.125-s resolution and no energy resolution; in the Standard2 configuration data are accumulated every 16 seconds in 129 channels. The High Energy X-ray Timing Experiment (HEXTE) comprises two independent clusters of detectors with a total collecting area of 1400 cm2, covering the energy range 15-250 keV. The spectral resolution is 15% at 60 keV energy range. During normal operation, the two clusters rock on and off target to collect background data (Rothschild et al. 1998). Due to malfunction of the rocking mechanism, cluster A was left permanently on the on-source position for the entire duration of the observations. Thus, no background light curve could be obtained. Data presented in this work correspond to cluster B only. The third instrument on board RXTE is the All-Sky Monitor (ASM),which produce daily flux averages in the energy range 1.3-12.1 keV at 30 mCrab sensitivity (Levine et al. 1996).
The log of the RXTE observations is shown in Table 1. Good time intervals were defined when the pointing of the satellite was stable ( from the source), the elevation above 8∘ and far away from the South Atlantic Anomaly. Due to RXTE’s low-Earth orbit, the data consist of a number of contiguous data intervals (typically 1 hr long) interspersed with observational gaps produced by Earth occultations of the source and passages of the satellite through the South Atlantic Anomaly. In general, the visibility of a target depends on its position with respect to the plane of RXTE’s orbit around the Earth. Objects that are within a critical angle from the normal to the orbit will be visible for longer periods of time. In fact, if the object is close enough to the normal then it would lie in the so-called Continuous Viewing Zone (CVZ). Since RXTE orbits relatively close to the Earth’s equator, the regions of high visibility and the CVZ are close to the north and south pole of the Earth. 4U 2206+54 is at high ecliptic latitude (about 58 degrees), hence it has a relatively high visibility. The observations reported here are considerably longer than commonly reported for other sources. There are two long ( 6 hr) uninterrupted observations. These longer observations, together with the monitoring of 4U 2206+54 over 7 days, allow us to give new insights into the properties of the X-ray emission in 4U 2206+54. In particular, they allow us to search for periodicities on timescales of 1 hr. To investigate potential orbital variability, the RXTE observations were divided into five intervals with roughly the same on-source time, 20–30 ks (Fig. 1).
In addition to the RXTE pointing observations, we also analysed archived data from the INTEGRAL and EXOSAT missions. The International Gamma-ray Astrophysics Laboratory (INTEGRAL) observations were made between 16–19 December 2006 during revolution 510. INTEGRAL carries two main gamma-ray instruments: the high angular resolution Imager (IBIS) and the high-energy resolution spectrometer (SPI). In our study we only used data from the upper detector system of IBIS, called the Soft Gamma-ray Imager (ISGRI). ISGRI is sensitive to photons in the energy range 20 keV to 1 MeV, has an angular resolution of 12’ and a source location accuracy that depends on the significance of the detection: for a source at the limit of detection the source location accuracy is about 4-5’ while for a strong source it can go down to about 0.5’ (Gros et al. 2003). The energy resolution is 7% at 100 keV (Ubertini et al. 2003). 4U 2206+54 was detected in a total of 19 INTEGRAL science windows of around 2.3 ks exposure each. In all these observations the satellite followed a dithering pattern. We only analysed images in which the source fell in the fully coded field of view (). Data reduction was done with the Offline Scientific Analysis (OSA) software version 7 (Courvoisier et al. 2003).
The European Space Agency’s X-ray Observatory, EXOSAT, was operational from May 1983 to April 1986. The pay-load consisted of 2 Wolter Type I grazing incidence Low Energy (LE; 0.05-2 keV) Imaging Telescopes, a Medium Energy (ME) Proportional Counter and a Gas Scintillation (GS) Proportional Counter. The ME detectors covered the energy range 1-50 keV and had a field of view of 45 arcmin and an effective area 1600 cm2 (Turner et al. 1981). For our study we retrieved the ME detector standard products available in the NASA’s HEASARC archive. EXOSAT observed 4U 2206+54 with the Medium Energy (ME) proportional counter in three occasions: 8 August 1983, 7 December 1984 and 27 June 1985 for a total of 9.8 ks, 9.3 ks and 6.3 ks, respectively.

|

|

|

3 Timing analysis
We have performed a timing analysis on two time scales: a) minutes to hours to search for slow pulsations and b) days to investigate orbital variability. Figure 1 shows the entire RXTE/PCA light curve. Each point represents the average of one observation interval (see Table 1). On short time scales the X-ray light curve of 4U 2206+54 is dominated by erratic flaring, with changes in the X-ray intensity by a factor 3–5 over a few minutes (Fig. 2). Despite the different wind parameters and optical companion believed to be present in 4U 2206+54 (Blay et al. 2006; Ribó et al. 2006), the light curves are very similar to those of X-ray sources in which a neutron star is fed by direct accretion from the wind of a supergiant, such as Vela X-1. This supports the idea that accretion in this source is not mediated by an accretion disc, but proceeds directly from the wind. Figure 2 shows a portion of the light curve for each interval. The -axis spans the same intensity range in all panels to show the large variability of 4U 2206+54 on short timescales.
Figure 3 shows a colour-intensity diagram where three hardness ratios are plotted as a function of 4–30 keV PCU2 count rate. Each point represents an average over 512 seconds. The source becomes harder as the count rate increases. A fit to a constant function does not give good fits to the top two panels, with reduced of 8.5 and 5.1, indicating that the variation is statistically significant. In contrast, the data of the bottom panel give . The correlation coefficients to a linear regression fits in the three panels are, from top to bottom, 0.6, 0.7 and –0.2.
3.1 Search for long-term pulsations
In spite of intensive searches, X-ray pulsations have not been detected in 4U 2206+54. Searches for X-ray coherent emission have been performed with EXOSAT (Corbet & Peele 2001, but see Saraswat & Apparao 1992), RXTE (Negueruela & Reig 2001; Torrejón et al. 2004; Corbet et al. 2007), BeppoSAX (Masetti et al. 2004; Torrejón et al. 2004) and INTEGRAL (Blay et al. 2005). These studies demonstrate the lack of X-ray pulsations on timescales from 1 ms to 1 hour. The possible detection of 392-s pulsations reported by Saraswat & Apparao (1992) has never been confirmed. Corbet & Peele (2001) reanalysed the EXOSAT observations used by Saraswat & Apparao (1992) and did not find any evidence of any pulsations longer than 2 s. They argue that Saraswat & Apparao (1992) used a procedure not well suited to search for coherent periodic pulses.
The only timescales that have not been investigated in detail due to either technical constraints (low-Earth orbits) or lack of long uninterrupted observations is from 1 hr to 1 day. The long coverage of our RXTE observations allows us to investigate the higher frequency part of this unexplored interval.
We searched for periodic signals in the light curves using various standard techniques. Initially we applied an FFT to the two longest observation intervals (see Table 1). However, in order to be able to use the entire data set, techniques suitable for handling missing data (gaps) in the light curves are needed. Thus we employed PERIOD04 (Lenz & Breger 2005), the Phase Dispersion Minimisation (PDM, Stellingwerf 1978) and the CLEAN algorithm (Roberts et al. 1987). A periodic signal around 5560 s is clearly detected with all methods. The PDM and CLEAN periodograms obtained between 100 and 10 000 s for the RXTE/PCA light curve binned at 16 s intervals are shown in the top panel of Fig. 4. In the case of PDM there is a strong beating with 400 s separation, and two equally significant minima occur at s and s. In the case of CLEAN there is a clear maximum only at s.
To further study the periodic signal detected with the whole data set, we have analysed the RXTE/PCA light curves of intervals A+B and intervals C+D+E separately, corresponding to a high and low flux states of the source on an orbital timescale (Fig. 1). The results show that the periodic signal is detected in both data sets, clearly indicating that it is independent of the X-ray flux of the source. In particular, for A+B PDM and CLEAN provide signals at s and s, respectively. For C+D+E we obtain s and s, respectively. The probability that the detected period is due to random fluctuations is less than , according to the statistical properties of the PDM algorithm (Stellingwerf 1978).
We note that a strong signal is also detected around 815 00015 000 s ( d) with the CLEAN algorithm in the RXTE/PCA light curve. Although the available database is limited to just 7.0 d, it is interesting to note that a clear hint of the possible 9.6 d (or of a part of the 19.25 d) orbital period appears in the RXTE/PCA data set of 4U 2206+54. The probability that there is not such periodicity or that the real period is different to 815 000 s is less than 0.01.
The value of 5560 s is very close to RXTE’s orbital period – RXTE follows a low-Earth circular orbit at an altitude of 580 km, corresponding to an orbital period of about 90 minutes. Note that the RXTE’s orbital period is continuously changing due to perturbations by the Earth and Moon and atmospheric drag. At the time of the observations the orbital period laid in the range 5667.3–5669.1 s. In order to rule out an instrumental origin of the modulation, we analysed archived data from the INTEGRAL/ISGRI and EXOSAT/ME missions and instruments. The orbit of these two observatories is highly eccentric with a period of 72 hours and 90 hours, respectively. The time bin was 500 s for the ISGRI light curve and 30 s for the ME light curve.
The timing analysis on the INTEGRAL (20–40 keV) and EXOSAT (0.8–9 keV) light curves gives periodic signals at s and s, respectively (Fig. 4), which clearly confirms the presence of the 1.54-hr periodic signal found with the RXTE/PCA data.
Figure 5 shows the pulse profile corresponding to each satellite. The pulsed fraction is 50% for the RXTE and INTEGRAL light curves and 35% for the EXOSAT data.
HEXTE data were not used in the periodicity analysis because of the problems with cluster A (see Sect. 2) and the low S/N of the cluster B light curves. Also, note that the energy range covered by HEXTE is partially covered by ISGRI/INTEGRAL.
| MJD | Orbital | Number | rms (%) | /dof | |||
| c/s | phaseb | of PSD | (0.001-1 Hz) | ||||
| A | 54235.16–54236.11 | 29 | 0.87/0.93 | 21 | 1.870.04 | 37 | 1.3/44 |
| B | 54236.86–54238.00 | 27 | 0.06/0.03 | 26 | 1.770.04 | 34 | 1.1/44 |
| C | 54238.00–54239.06 | 12 | 0.17/0.09 | 19 | 1.550.05 | 30 | 1.9/43 |
| D | 54239.09–54241.03 | 6 | 0.33/0.17 | 24 | 1.5 | 28 | 1.3/44 |
| E | 54241.05–54242.20 | 9 | 0.50/0.25 | 15 | 1.50.1 | 23 | 1.2/44 |
| : Background subtracted 2–60 keV, PCU2 only | |||||||
| : At mid-point for d and d, respectively | |||||||

3.2 Orbital variability
To investigate the longer-term variability, the observations were divided into five intervals with roughly the same on-source time. The average intensity decreased throughout the time covered by the observations as can be seen in Fig. 1. The numbers on top of this figure are the orbital phase assuming d and twice that period d (Corbet et al. 2007). The reference time is the epoch of maximum flux as given by the ASM, MJD 53567.74 (Corbet et al. 2007). The PCA light curve shows maximum flux at phase 0, in agreement with the modulation of the folded ASM light curve (Corbet et al. 2007). There is another less significant peak at about phase 0.5, if d. If the orbital period were d, then we would expect to see the maximum flux around phase 0.125 (Corbet et al. 2007), which is not seen.
In order to investigate the evolution of the power spectral parameters of the noise components as the source moves around the orbit, we produced one power spectrum for each interval. The power spectra were obtained by dividing the 2–20 keV PCA -s binned light curve of the entire observation into 1024-s segments and an FFT obtained for each segment. The contribution by the photon counting noise was computed and subtracted from each power spectrum. The power spectra were normalized such that their integral gives the squared fractional rms variability (Belloni & Hasinger 1990; Miyamoto et al. 1991). The power spectra of the same interval were averaged to produce the final power spectrum. A logarithmic rebinning was also applied to reduce the noise at high frequencies. Figure 6 shows the power spectra for the five intervals. The results of the fitting procedure are shown in Table 2.
A single power-law component provides good fits for all intervals. The power-law index and the fractional amplitude change with X-ray intensity. The high-intensity intervals (A and B) show a steeper power spectrum and a larger amplitude of variability. The low-intensity intervals (D and E) display a flatter power law and are less variable. Interval C shows intermediate values between these two cases.
4 Spectral analysis
In this section we present the results of the energy spectral analysis. We first present the PCA+HEXTE time-average spectrum for the entire observation. Then, we search for orbital variability in the spectral parameters.
4.1 Time-averaged spectrum
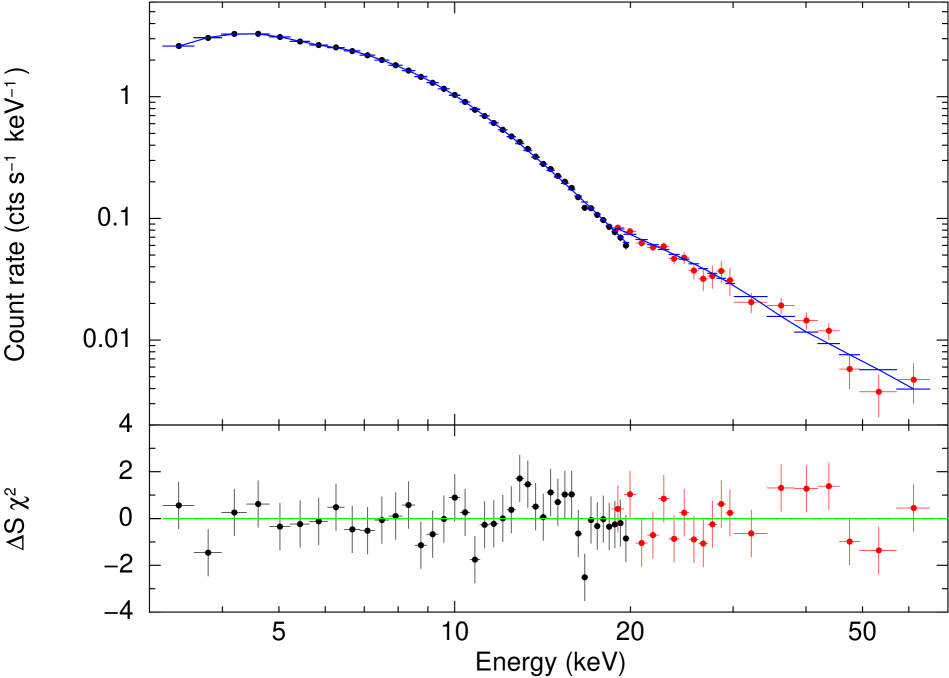
The 3-30 keV spectrum of 4U 2206+54 is well described by an absorbed, cm-2, power law with photon index 1.30.1 modified by a cutoff at 6.30.4 keV and folding energy 142 keV, in agreement with those found by Negueruela & Reig (2001). However, as shown in Torrejón et al. (2004), this model does not describe properly the spectrum when data beyond 30 keV are taken into account (=1.44 for 53 d.o.f.). The joined time-average PCA+HEXTE spectrum (Fig. 7) is, overall, well described by thermal Comptonization (comptt in xspec notation). This model requires further a blackbody emission (bb) component to account for an excess at low energies. The same is true when dynamical Comptonization (bmc) replaces thermal Comptonization. The parameters for these two composite models are presented in Table 3. is the temperature of the blackbody component that accounts for the soft excess; and are the temperatures of the seed photons, which are subsequently Comptonized by the high temperature plasma, in the thermal and dynamical Comptonization models respectively; and are the temperature and optical depth of the high temperature plasma, in the thermal Comptonization model; is an spectral index related to the efficiency of the Comptonization process (the lower the value of , the more efficient is the Comptonization); is the illumination factor, i.e., the ratio of the number of multiply scattered photons to the total number of seed photons ( implies that the spectrum is fully Comptonized). No iron line is required. If the absorption column is let free to vary, then the best-fit value is higher than in previous observations. Fixing it to a lower value increases slightly the temperature of the blackbody but it is always around 0.5 keV (for example fixing to cm-2, the pure interstellar value, gives and sets the ). Since RXTE cannot constrain the column density due to the lack of sensitiveness below 3 keV we fixed to the value reported from BeppoSAX observations, namely cm-2 (Masetti et al. 2004). Applying Eq. 1 in Torrejón et al. (2004) to the data in Table 3, we determine the radius of the soft photon source which would produce the observed luminosity111This formula gives the proper factor for a circular spot of area . Of course, a sphere would require a radius to produce the same assuming isotropic emission. to be km. This is only consistent with a hot spot on the neutron star surface.
The possible cyclotron line around 30 keV reported by various authors (Torrejón et al. 2004; Masetti et al. 2004; Blay et al. 2005) is not seen in the present data set. We did not find significant evidence for the iron emission line at 6.4 keV either. We estimate an upper limit on the equivalent width of a narrow line (FWHM=0.1 keV) around 6.4 keV of 25 eV at 90% confidence level. The average X-ray luminosity in the energy range 3–30 keV is erg s-1, assuming a distance of 2.6 kpc (Blay et al. 2006).
| bb + comptt | bb + bmc | ||
| 0.9 | 0.9 | ||
| (keV) | 0.55 | (keV) | 0.46 |
| Normbb | (4.65) | Normbb | (4.17) |
| 0.08 | 0.04 | ||
| (keV) | 1.30 | (keV) | 1.30 |
| (keV) | 35.20 | 1.33 | |
| 0.73 | 1 | ||
| Normcomptt | (6.53) | Normbmc | (1.68) |
| 2.49 | 2.52 | ||
| (d.o.f.) | 1.00 (52) | (d.o.f.) | 0.94 (53) |
| (a) Hydrogen column density in units of 1022 cm-2 (fixed) | |||
| (b) 3–60 keV unabsorbed flux in units of 10-10 erg s-1 cm-2 | |||
| Bin | orbital phase(a) | Norm | (d.o.f.) | |||||
| A | 0.87/0.93 | 1.54 | 6.34 | 13.34 | 1.29 | 0.028 | 3.33 | 0.65 (51) |
| B | 0.06/0.03 | 1.54 | 6.32 | 14.46 | 1.32 | 0.032 | 3.67 | 0.72 (51) |
| C | 0.17/0.09 | 0.63 | 6.23 | 12.03 | 1.28 | 0.012 | 1.32 | 0.72 (51) |
| D | 0.33/0.17 | 0.94 | 6.13 | 11.99 | 1.44 | 0.009 | 0.76 | 1.37 (51) |
| E | 0.50/0.25 | 0.95 | 6.24 | 12.24 | 1.44 | 0.010 | 0.82 | 0.63 (51) |
| A | 0.87/0.93 | 0.9 | 6.00 | 11.88 | 1.17 | 0.023 | 3.26 | 0.67 (52) |
| B | 0.06/0.03 | 0.9 | 5.99 | 12.83 | 1.21 | 0.026 | 3.60 | 0.77 (52) |
| C | 0.17/0.09 | 0.9 | 6.34 | 12.62 | 1.33 | 0.013 | 1.33 | 0.63 (52) |
| D | 0.33/0.17 | 0.9 | 6.12 | 11.87 | 1.43 | 0.009 | 0.76 | 0.71 (52) |
| E | 0.50/0.25 | 0.9 | 6.25 | 12.17 | 1.44 | 0.009 | 0.82 | 1.33 (52) |
| : At mid-point for d and d, respectively | ||||||||
| : Hydrogen column density in units of 1022 cm-2 | ||||||||
| : Unabsorbed flux in units of 10-10 erg s-1 cm-2 | ||||||||

4.2 Pulse-phase spectroscopy
In order to investigate how the X-ray spectrum changes as a function of the spin of the magnetized neutron star, the pulse profile corresponding to intervals A and B was divided into eight equally spaced bins and a spectrum in the energy range 3-20 keV was obtained for each bin. After subtracting the underlying persistent emission, each spectrum was satisfactorily fitted with an absorbed power law. The column density was fixed to cm-2, i.e., the value found in the time-averaged spectrum (Sect. 4.1), although the use of cm-2 did not change the results significantly. Figure 8 shows the variation of the 3-20 keV X-ray flux and the power-law photon index as a function of the pulse phase. Phase zero corresponds to MJD 54235.169. Marginal evidence for variability in the power-law photon index is found. The spectrum becomes softer as the pulse phase increases, with the photon index reaching a maximum around phase 0.9. The hardness of the spectrum does not seem to depend on the pulse flux, but the photon index appears to lag the pulse flux by about 1200 s. However, the uncertainty in the photon index values is too large to draw a firm conclusion.
4.3 Orbital spectral variability
To investigate possible orbital spectral variability, we obtained a time-averaged spectrum for each observation interval. The 3–30 keV band spectrum was fitted to an absorbed power law modified at high energies by an exponential cutoff. Given the high low-energy limit, the hydrogen column is not well constrained. Although the observations that correspond to a lower flux have lower column densities, the value of is consistent with no variability, within the errors. Thus, we also tried fits with a fixed cm-2 (lower part of Table 4). In either case, a variation in the power-law index is apparent. High-flux states show harder spectra.
5 Discussion
We have reported the analysis of the monitoring campaign of the high-mass X-ray binary 4U 2206+54 that took place in May 2007 with RXTE. The observations span over 7 days, which represent a large fraction of the 9.6-day period. The long and uninterrupted observations allow us for the first time to i) extend the search for X-ray pulsations to time scales of about one hour, ii) investigate the X-ray orbital variability and iii) give new insights into its energy emission properties. In support of the results of these observations we also analysed data from INTEGRAL/ISGRI and EXOSAT/ME.
5.1 X-ray pulsations
The proximity of 4U 2206+54 to RXTE’s Continuous Viewing Zone allowed the acquisition of long and uninterrupted observations, and the discovery of slow X-ray pulsations ( s). With the discovery of X-ray pulsations we have solved one of the questions that remained unanswered, namely, the nature of the compact companion. The vast majority of HMXBs harbour X-ray pulsars. These are believed to be young neutron stars with relatively strong magnetic fields (). Among the handful of HMXBs not displaying X-ray pulsations, three show the typical characteristics of persistent black-hole systems. Of these, two are in the LMC and only one (Cyg X-1) in the Galaxy. The nature of the other three HMXBs in which pulsations have not been discovered in spite of intensive searches is under debate, although two of them may also contain black hole companions: LS I +61 303/2E 0236.6+6101 (Casares et al. 2005a, but see Dhawan et al. 2006) and LS 5039/RX J1826.2–1450 (Casares et al. 2005b, but see Ribó et al. 2008). If confirmed it would explain the lack of pulsations in these systems. Geometric effects (very low inclination or a very small angle between the spin and rotation axises) have been invoked to explain the lack of pulsations in 4U 1700–37, which might contain a massive neutron star (Clark et al. 2002; Abubekerov 2004). The lack of pulsations was more difficult to explain in 4U 2206+54, as previous observations indicated that this source likely hosts a canonical neutron star accreting from the wind of a main-sequence early-type star (Torrejón et al. 2004; Masetti et al. 2004; Blay et al. 2005, 2006; Ribó et al. 2006).
With the period detected here, 4U 2206+54 is the third (if the nature of IGR J16358–4726 as a HMXB is finally confirmed) slowest HMXB pulsar, after 2S 0114+650 and IGR J16358–4726, and the first with a main-sequence companion. 2S 0114+650 is a 2.78-h pulsar (Finley et al. 1994) accreting matter from a supergiant B1 companion (Reig et al. 1996), while IGR J16358–4726 has been classified as a sgB[e] (Chaty et al. 2008, but see Nespoli et al. 2008) with a 1.6-hr rotating neutron star (Patel et al. 2004).222The slowest X-ray pulsar is 4U 1954+319 with hr (Mattana et al. 2006; Corbet et al. 2008). However, this is a symbiotic X-ray binary with a neutron star component accreting from a low-mass M-type giant (Masetti et al. 2006b).
Numerical calculations suggest that there is no significant angular momentum transfer onto the neutron star from the wind of supergiant systems (Ruffert 1999). Even a lower-velocity wind like the one believed to be present in 4U 2206+54 (Ribó et al. 2006) seems to be insufficient to exert a spin-up torque onto the neutron star. Since the transfer of angular momentum during the accretion phase is so inefficient, a spin period of 5500 s must have been attained in a previous evolutionary phase. The neutron star’s spin evolution in a close binary system (Davies et al. 1979; Davies & Pringle 1981; Dai et al. 2006) is divided into three phases, of which the accretion phase is the more recent one. The neutron star is born as a millisecond pulsar (pulsar phase) and spin down ocurs by magnetic dipole radiation until s. Then the neutron star enters the propeller phase, in which the neutron star spins down because accretion is centrifugally inhibited. This phase continues until the spin period reaches the so-called equilibrium period given by (Li & van den Heuvel 1999, but see Davies & Pringle 1981)
where G is the neutron star’s dipolar magnetic field strength, g s-1 is the mass accretion rate, cm is the radius of the neutron star, and is the mass of the neutron star. Adopting the canonical values and (Blay et al. 2005) and for erg s-1, the 4U 2206+54 equilibrium period results s, far lower than the observed period. We conclude then that the current spin period of 4U 2206+54 cannot be explained in evolutionary terms. A way out is provided by Li & van den Heuvel (1999), who explain the long spin period of 2S 0114+65 assuming that the neutron star was born as a magnetar, that is, with G. Indeed, the propeller effect can spin down the neutron star to s keeping the same values as above but taking two orders of magnitude higher.
5.2 Temporal variability
The range in X-ray luminosity (3–30 keV) implied from the observations is 0.6–3.1 erg s-1, assuming a distance to the source of 2.6 kpc (Blay et al. 2006). That is, 4U 2206+54 displays an amplitude of variability in X-ray flux of about 5. This amplitude is larger than the factor of 2 reported by Ribó et al. (2006) from ASM data, i.e., for X-rays in the 1.3–12 keV band, but consistent with the observations by Corbet & Peele (2001, see their Fig. 4). Note that the results from the ASM are highly dependent on the minimum flux, which for the ASM is uncertain. In the simplified Bondi-Hoyle accretion model a maximum to minimum orbital X-ray flux ratio of 5 can be explained assuming that the orbital variability is due to changes in the mass accretion rate. In this scenario, an eccentricity of is needed, somehow higher than that suggested by Ribó et al. (2006).
In addition to the X-ray flux, the power and energy spectral parameters also display variability on time scales of days. If the orbital period of 9.6 days is assumed to be correct, then it seems natural to attribute this variability to the motion of the source through the orbit. Note however, that our results are based on less than one orbit. The power spectra of 4U 2206+54 are well described by a single power law, whose index and rms amplitude decrease as the count rate decreases (Table 2). There is no sign of a break at low frequencies (flat-topped noise) in the frequency range covered by the power spectra. Red noise dominates the power spectrum down to frequencies as low as 1 mHz. The decrease in the amplitude of the X-ray variability (rms) with decreasing X-ray flux seems to indicate a large scale change in the structure of the wind. One possible explanation is that the wind was highly inhomogeneous during intervals A, B and C, during periastron passage, as usually observed in systems with supergiant companions, and became smoother further out, in intervals C and D. Assuming a mass of 18 for the O9.5V primary and the canonical neutron star mass of 1.4 for the accretor, the change in the wind structure must have occured in between intervals C and D, which in terms of radial distance corresponds to 5.7 for d and 6.95 for d. The detection of X-ray emission in intervals D and E in 4U 2206+54 contrasts with what is observed in classical supergiant systems for which the X-ray emission is hardly detected when the compact object is located beyond 3 (Negueruela et al. 2008; Blay et al. 2008).
The 3–30 keV spectrum of 4U 2206+54 can be described with a power law with and a high-energy cutoff with keV (see Sect. 4.1). The power-law index increases as the X-ray flux decreases (Table 4). The high-flux intervals (A and B) show a harder spectrum than the low-flux states (C, D and E). This behaviour is the opposite to that found in other X-ray sources. The explanation could be, again, in the low X-ray brightness of this source. Within the framework of bulk motion Comptonization, that is, assuming that Comptonization occurs in the accretion flow near the neutron star surface (accretion column), the surface of the neutron star acts as source of feedback against the infalling material: when the accretion increases, so does the X-ray flux. The ram pressure exerted by the X-ray source tends to hamper accretion and therefore complicates the Comptonization process. In the very bright X-ray sources, the feedback decreases the efficiency of Comptonization and produces a high-soft low-hard behaviour. In 4U 2206+54 however, with its main sequence donor, the X-ray source is never pushed to the limit where the X-rays can hamper the accretion process. With no feedback from the surface of the neutron star, the source becomes harder when accreting material becomes available, presumably at the periastron passage.
One of the controversial results of 4U 2206+54 in the X-ray band is the shape of the hardness-intensity diagram. Negueruela & Reig (2001) found a correlation between the X-ray colours and the X-ray intensity, in that the X-ray spectrum becomes harder as the flux increases. Figure 3 confirms these results. This figure shows the hardness-intensity diagram for three different ratios. In all three cases the change in intensity is approximately the same, namely, a factor of 10. In contrast, Masetti et al. (2004) did not find any variability of the hardness ratio with intensity in a BeppoSAX observation on 1998 November. Masetti et al. (2004) suggested that the hardness-intensity dependence might become evident at higher luminosities, as the X-ray luminosity during the Negueruela & Reig (2001) observations was about one order of magnitude higher than that of Masetti et al. (2004). To investigate this possibility we obtained hardness-intensity diagrams for interval B and D, that is, when the X-ray flux was maximum and minimum, respectively. We define the hardness ratios as 7–10 keV/4–7 keV and 10–15 keV/4–7 keV. Fitting and as a function of 4–30 keV intensity to a constant does not give acceptable fits for interval B. The fits to interval D are acceptable (in the sense ). However, the reason for this acceptable fit is because the error bars are larger. As an example, a linear fit () to the -intensity diagram of interval D reduces the from 419 (259 dof) to 290 (258 dof). An F-distribution test gives a chance improvement of only 0.18%. That is, the addition of a linear component is significant above a 3- level. In fact, irrespective of the X-ray flux, as the intensity increases by a factor 10, the hardness ratios and increase by 25%. In summary, the hardness-intensity dependence becomes more evident at higher source luminosities (as Masetti et al. (2004) had suggested). However, this effect is most likely due to low statistics rather than the disappearance of the correlation.

5.3 Soft component
When a broader energy range is considered, the high-energy cutoff power-law model does not give acceptable fits and a soft excess at energies below 2 keV shows up in the residuals. More physical models involve Comptonization. Either thermal or bulk-motion Comptonization produce good fits to the X-ray energy continuum in the 3–80 keV band. In either case a blackbody component with keV is required to account for the low-energy photons.
The presence of a blackbody component supports the suggestion by Hickox et al. (2004) that soft excess is common (probably ubiquitous) in X-ray pulsars. For high luminosity ( erg s-1) pulsars, the soft component stems from reprocessing of hard X-rays from the neutron star in the inner edge of an accretion disc. In less luminous systems, other mechanisms, such as emission from diffuse gas or from the neutron star surface, can be at work. To get a rough estimate of the size of the soft radiation emission site, we compute the radius of the circular blackbody spot that would produce the observed soft luminosity, according to data in Table 3. We get a radius of km. This value is too small to come from the entire surface of the neutron star, a hot corona, or an accretion disc. The lack of a disc in 4U 2206+54 was discussed in Torrejón et al. (2004). This size is of the same order as that deduced previously from the temperature of the seed soft photons km. Then we tried to tie the temperature of both components during the fits. The resulting statistics were significantly worse. It seems, therefore, that the spectrum comes from two sites, with the same characteristic size but different temperature. They could reflect a gradient in temperature from the hot spot (of radius in the base of the accretion column) and the surface surrounding the spot (just outside the column) and into the relatively cold surface.
When the soft excess is modelled with a blackbody component, the blackbody spectral parameters (temperature and emission radius) strongly depend on the source luminosity, which in turn, depends on the accretion mechanism. In Fig. 9, we plot the temperature and radius of the emitting region allegedly causing the soft excess. High-luminosity systems display lower temperatures and larger radii (open squares). In high-luminosity pulsars, such as SMC X-1, Cen X-3 and LMC X-4, accretion occurs via Roche lobe overflow and an accretion disc is formed. In these systems keV and =100 km, typically (see e.g. Table 5 in Hickox et al. 2004), and the soft excess is believed to be due to reprocessing of hard X-rays by optically thick accreting material. In contrast, low-luminosity systems (filled circles), such as X Per (Coburn et al. 2001), A 0535+26 (Mukherjee & Paul 2005) and RX J0146.9+6121 (La Palombara & Mereghetti 2006) have keV and km. In these systems the neutron star captures material from the high-density wind from the circumstellar disc of the Be companion. The origin of the soft excess would be (part of) the neutron star surface. Note also that the high-luminosity pulsars mentioned above contain supergiant companions, while the low-luminosity systems harbour main-sequence stars. In between these extreme cases one finds the wind-fed supergiant systems (filled triangles), such as Vela X-1, with keV and km (Hickox et al. 2004) and 2S 0114+650, with keV and km (Masetti et al. 2006a). In these systems the thermal component responsible for the soft excess is likely to be a cloud of diffuse plasma around the neutron star (Hickox et al. 2004).
The star-like symbols in Fig. 9 represent three different observations of 4U 2206+54 (Masetti et al. 2004; Torrejón et al. 2004, and present work). 4U 2206+54 appears close to the Be/X-ray binaries, as expected if the soft excess arises from a hot spot on the neutron star surface. It is not clear how such a hot spot can be formed in 4U 2206+54 as accretion is also driven through a stellar wind (Ribó et al. 2006). Perhaps the much slower (and presumable denser) wind in 4U 2206+54 might make the accretion configuration be more similar to that of persistent Be/X-ray binaries.
The open circle corresponds to the peculiar Be/X-ray binary SAX J2103.5+4545 (Inam et al. 2004). This source is similar to 4U 2206+54 in that the spin and orbital periods are typical of supergiant X-ray binaries, but the primary component of the binary is a main-sequence star. In both systems the orbits have . The X-ray variability is, however, rather different. SAX J2103.5+4545 presents X-ray bright states that last for a few months and extended (few years) X-ray faint states. During the bright states an accretion disc is formed around the neutron star (Baykal et al. 2002) and a decretion circumstellar disc is formed around the Be star (Reig et al. 2004). These discs are probably short lived and appear during the high X-ray emission states only. Reig et al. (2005) found that SAX J2103.5+4545 was emitting X-rays even after the complete loss of the circumstellar disc. In this state, Reig et al. (2005) argue that the X-rays are the result of wind-fed accretion, that is, as in 4U 2206+54.
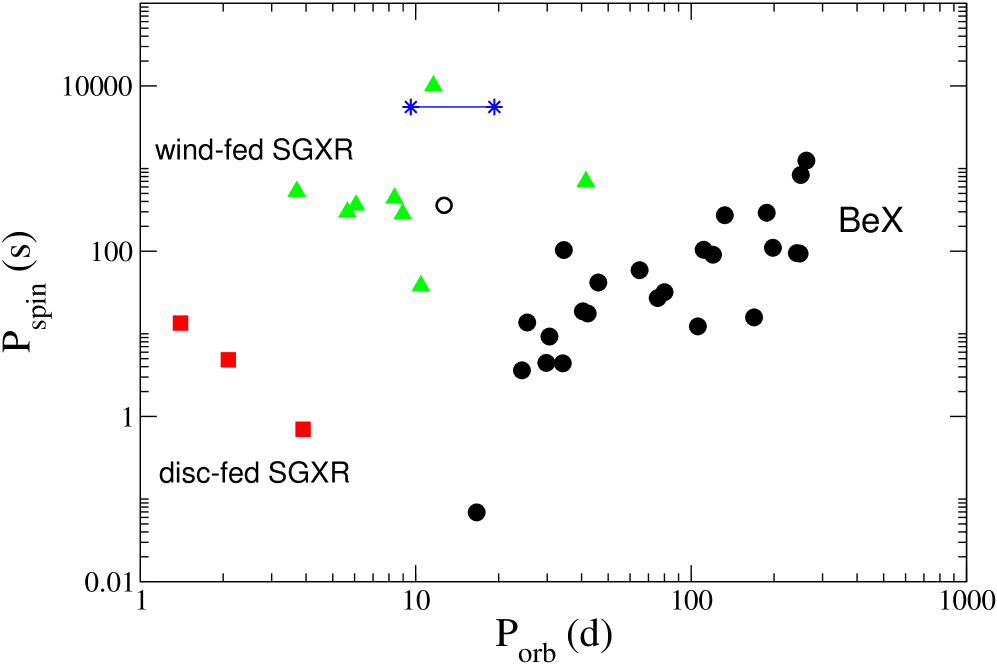
The position of these two sources in the - diagram (Fig. 10) reinforces their similarity. They fall in the wind-fed supergiant region. Since this diagram reflects the type of mass-loss/accretion mechanism (Corbet 1986), it is not surprising to find 4U 2206+54 and SAX J2103.5+4545 in this region. What makes them peculiar is that they both contain a main-sequence donor.
The blackbody temperature and radius (scaled to a distance of 6.5 kpc; Reig et al. 2004) of SAX J2103.5+454 shown in Fig. 9 (open circle) were obtained during a bright state (Inam et al. 2004), which may explain the isolated position in the plot. Note that the value of the radius and blackbody temperature are consistent with those of the low-luminosity Be/X-ray binaries (filled circles). The difference appears in the X-ray luminosity. The higher luminosity in SAX J2103.5+454 can be explained if an accretion disc was present during the observations. The detection of a quasi-periodic oscillation at 0.044 Hz (Inam et al. 2004) and the correlation between spin-up/down with X-ray flux (Baykal et al. 2007) indeed supports the presence of an accretion disc.
6 Conclusion
We have finally unveiled the nature of the compact companion in the high-mass X-ray binary 4U 2206+54. The RXTE light curve of 4U 2206+54 appears to be modulated with a period of 1.54 hours that we interpret as the spin period of the neutron star. Evidence for this modulation is also found in INTEGRAL and EXOSAT data. Thus we rule out that the periodicity is due to the RXTE orbit. 4U 2206+54 becomes the slowest rotating neutron star in a high-mass X-ray pulsar with a main-sequence companion. The X-ray flux and the spectral index of the power-law components that fit energy and power spectra exhibit variability on time scales of days. The amplitude of variability of the X-ray flux changed by a factor of 5 on time scales of days. The power-law index is larger (i.e. steeper spectrum) during low-flux states in the energy spectra and during high-flux states in the power spectra. We attribute this variability to changes in the mass accretion rate as the neutron star orbits the O-type companion in a moderately eccentric orbit. The time span covered by the observations is shorter than any of the two suggested orbital periods, hence further monitoring campaigns covering a larger fraction of the orbit are needed to pin down the correct orbital period. However, the fact that the maximum of the PCA light curve occurs at phase zero, i.e., in coincidence with the ASM maximum when folded onto the 9.6-day period and the detection of a strong signal at 815000 s in the RXTE periodogram would favour the shorter period. The detection of a soft component in the energy spectrum has been interpreted as emission from the polar caps. The plot of the blackbody emitting radius and temperature as a function of X-ray luminosity constitutes a useful tool to distinguish the type of accretion mechanism at work in the X-ray binaries that show a soft excess.
Acknowledgements.
This research was supported by the European Union Marie Curie grant MTKD-CT-2006-039965. This research is supported by the DGI of the Spanish Ministerio de Educación y Ciencia under grants AYA2005-00095 and AYA2007-68034-C03-01 and FEDER funds. JMT acknowledges the support of the Spanish Ministerio de Educación y Ciencia under grant PR2007-0176. This research has made use of data obtained through the INTEGRAL Science Data Center (ISDC), Versoix, Switzerland.References
- Abubekerov (2004) Abubekerov, M. K. 2004, Astron. Rep., 48, 649
- Baykal et al. (2002) Baykal, A., Stark, M.J. & Swank, J.H. 2002, ApJ, 569, 903
- Baykal et al. (2007) Baykal, A., Inam, S.,Ç., Stark, M.J., et al. 2007, MNRAS, 374, 1108
- Belloni & Hasinger (1990) Belloni, T., & Hasinger, G. 1990, 230, 103
- Blay et al. (2005) Blay, P., Ribó, M., Negueruela, I., et al. 2005, A&A, 438, 963
- Blay et al. (2006) Blay, P., Negueruela, I., Reig, P., et al. 2006, A&A, 446, 1095
- Blay et al. (2008) Blay, P., Mart nez-N ez, S., Negueruela, I. et al. 2008, A&A, 489, 669
- Casares et al. (2005a) Casares, J., Ribas, I., Paredes, J. M., Martí, J., & Allende Prieto, C. 2005a, MNRAS, 360, 1105
- Casares et al. (2005b) Casares, J., Ribó, M., Ribas, I., et al. 2005b, MNRAS, 364, 899
- Chaty et al. (2008) Chaty, S., Rahoui, F., Foellmi, C., et al. 2008, A&A, 484, 783
- Clark et al. (2002) Clark, J. S., Goodwin, S. P., Crowther, P. A., et al. 2002, A&A, 392, 909
- Coburn et al. (2001) Coburn, W., Heindl, W. A., Gruber, D. E., et al. 2001, ApJ, 552, 738
- Corbet (1986) Corbet, R.H.D. 1986, MNRAS, 220, 1047
- Corbet & Peele (2001) Corbet, R.H.D., & Peele, A.G. 2001, ApJ, 562, 936
- Corbet et al. (2007) Corbet, R.H.D., Markwardt, C.B., & Tueller, J. 2007, ApJ, 655, 458
- Corbet et al. (2008) Corbet, R.H.D., Sokoloski, J.L., Mukai, K. et al. 2008, ApJ, 675, 1424
- Courvoisier et al. (2003) Courvoisier, T. J.-L., Walter, R., Beckmann, V., et al. 2003, A&A, 411, L53
- Dai et al. (2006) Dai, H.-L. Liu, X.-W., & Li, X.-D. 2006, ApJ, 653, 1410
- Davies et al. (1979) Davies, R. E., Fabian, A. C., & Pringle, J. E. 1979, MNRAS, 186, 779
- Davies & Pringle (1981) Davies, R. E., & Pringle, J. E. 1981, MNRAS, 196, 209
- Dhawan et al. (2006) Dhawan, V., Mioduszewski, A., & Rupen, M., 2006, in Proceedings of the VI Microquasar Workshop: Microquasars and Beyond. September 18-22, 2006, Como, Italy., p.52
- Finley et al. (1994) Finley, J.P., Taylor, M., & Belloni, T. 1994, ApJ, 429, 356
- Gros et al. (2003) Gros, A., Goldwurm, A., Cadolle-Bel, M. et al. 2003, A&A, 411, L179
- Hickox et al. (2004) Hickox, R.C., Narayan, R., & Kallman, T.R. 2004, ApJ, 614, 881
- Inam et al. (2004) Inam, S.Ç, Baykal, A., Swank, J. & Stark, M.J. 2004, ApJ, 616, 463
- Jahoda et al. (1996) Jahoda K., Swank J.H., Stark M.J., Strohmayer T., Zhang W., Morgan E.H., 1996 EUV, X-ray and Gamma-ray Instrumentation for Space Astronomy VII, O.H.W. Siegmund & M.A. Gummin eds., SPIE 2808, 59, 1996.
- La Palombara & Mereghetti (2006) La Palombara, N., & Mereghetti, S. 2006, A&A, 455, 283
- Lenz & Breger (2005) Lenz, P. & Breger, M. 2005, CoAst, 146, 53
- Levine et al. (1996) Levine, A.M., Bradt, H., Cui, W., et al. 1996, ApJ, 469, L33
- Li & van den Heuvel (1999) Li, X.-D., & van den Heuvel, E.P.J. 1999, ApJ, 513, L45
- Masetti et al. (2004) Masetti, N., Dal Fiume, D., Amati, L., et al. 2004, A&A, 423, 311
- Masetti et al. (2006a) Masetti, N., Orlandini, M., Dal Fiume, D. et al. 2006a, A&A, 445, 653
- Masetti et al. (2006b) Masetti, N., Bassani, L., Bazzano, A. et al. 2006b, A&A, 453, 295
- Mattana et al. (2006) Mattana, F., Götz, D., Falanga, M. et al. 2006, A&A, 460, 1
- Miyamoto et al. (1991) Miyamoto, S., Kimura, K., Kitamoto, S., Dotani, T., & Ebisawa, K. 1991, ApJ, 383, 784
- Mukherjee & Paul (2005) Mukherjee, U., & Paul, B. 2005, A&A, 431, 667
- Negueruela & Reig (2001) Negueruela, I., & Reig, P. 2001, A&A, 371, 1056
- Negueruela et al. (2008) Negueruela, I., Torrejón, J.M., & Reig, P., Ribó, M. & Smith, D.M. 2008, in AIP Conf. Proc., Vol. 1010, p. 252 (arXiv:0801.3863).
- Nespoli et al. (2008) Nespoli, E., Fabregat, J., & Mennickent, R.E. 2008, ATel 1450
- Patel et al. (2004) Patel, S.K., Kouveliotou, C., Tennant, A. et al. 2004, ApJ, 602, L45
- Reig et al. (1996) Reig, P., Chakrabarty, D., Coe, M.J., et al. 1996, A&A, 311, 879
- Reig et al. (2004) Reig, P., Negueruela, I., Fabregat, J., et al. 2004, A&A, 421, 673
- Reig et al. (2005) Reig, P., Negueruela, I., Papamastorakis, G., Manousakis, A., Kougentakis, T. 2005, A&A, 440, 637
- Ribó et al. (2006) Ribó, M., Negueruela, I., Blay, P., Torrejón, J. M., & Reig, P. 2006, A&A, 449, 687
- Ribó et al. (2008) Ribó, M., Paredes, J. M., Moldón, J., Martí, J., & Massi, M. 2008, A&A, 481, 17
- Roberts et al. (1987) Roberts, D.H., Lehár, J., & Dreher, J.W. 1987, AJ, 93, 968
- Rothschild et al. (1998) Rothschild, R.E., Blanco, P.R., Gruber, D.E., et al. 1998, ApJ, 496, 538
- Ruffert (1999) Ruffert, M. 1999, A&A, 346, 861
- Saraswat & Apparao (1992) Saraswat, P., & Apparao, K.M.V. 1992, ApJ, 401, 678
- Steiner et al. (1984) Steiner, J. E., Ferrara, A., Garcia, M., et al. 1984, ApJ, 280, 688
- Stellingwerf (1978) Stellingwerf, R.F. 1978, ApJ, 224, 953
- Torrejón et al. (2004) Torrejón, J.M., Kreykenbohm, I., Orr, A., Titarchuk, L., & Negueruela, I. 2004, A&A, 423, 301
- Turner et al. (1981) Turner, M.J.L., Smith, A., Zimmermann, H.U. 1981, SSRv, 30, 513
- Ubertini et al. (2003) Ubertini, P., Lebrun, F., Di Cocco, G. et al. 2003, A&A, 411, L131