Evidence for the Missing Baryons in the Angular Correlation of the Diffuse X-ray Background
Abstract
The amount of detected baryons in the local Universe is at least a factor of two smaller than measured at high redshift. It is believed that a significant fraction of the baryons in the current Universe is “hiding” in a hot filamentary structure filling the intergalactic space, the Warm-Hot Intergalactic Medium (). We found evidence of the missing baryons in the by detecting their signature on the angular correlation of diffuse X-ray emission with the XMM-Newton satellite. Our result indicates that % of the total diffuse X-ray emission in the energy range 0.4-0.6 keV is due to intergalactic filaments. The statistical significance of our detection is several sigmas ( ). The error bar in the X-ray flux is dominated, instead, by cosmic variation and model uncertainties.
1 Introduction
Several methods have been used to measure the quantity of baryons in the Universe. Measurements at high redshift all point to about 4% of the matter-energy density of the Universe to be in the form of baryons, while the rest consists of dark matter and dark energy Rauch et al. (1997); Weinberg et al. (1997); Burles & Tytler (1998); Kirkman et al. (2003); Bennett et al. (2003). In contrast, the amount of baryons measured in the local Universe in the form of stars, galaxies, groups, and clusters is less than 2% Fukugita et al. (1998).
Hydrodynamic simulations tracking the evolution of the Universe suggest that much of the “missing” material in the local Universe lies in a hot filamentary gas filling the intergalactic space, the Warm-Hot Intergalactic Medium (). Theoretical estimates indicate that the filaments, have typical density 20 to 1000 times the average baryon density of the universe and temperature greater than K Cen & Ostriker (1999); Borgani (2004); Cen & Ostriker (2006). At these temperatures and densities the baryons are in the form of highly ionized plasma, making them invisible to all but low energy X-ray and UV observations. Recent UV observations Danforth et al. (2006) confirm the presence of “warm” gas in the intergalactic medium that should account for half of the missing baryons. However, the “hot” core of the filaments can only be detected in the soft X-ray band, mostly through excitation lines of highly ionized heavy elements, such as OVII, OVIII, FeXVII, CVI, and NVII with energy between 0.2 and 0.7 keV.
Different approaches have been proposed to detect and study the missing baryons in X-rays. Absorption features can be spotted along the line of sight of distant bright sources. Evidence of the filament existence comes from an absorption measurement made in the direction of the blazar Markarian 421 in a period of maximum brightness Nicastro et al. (2005); Nicastro et al. 2005b , however such data are still considered controversial Kaastra et al. (2006); Williams et al. (2006); Rasmussen et al (2007). Unfortunately, with the capability of current X-ray satellites, Markarian 421 is practically the only source sufficiently bright to be used as beacon for absorption measurements.
Another option is to identify red-shifted X-ray emission lines emitted by the filaments Ursino & Galeazzi (2006), but the emission is very weak and must be detected on top of a larger background from galactic emission and unresolved point sources. Dedicated missions are on the drawing board for the study of the WHIM (e.g., den Herder et al. - 2007), but, if approved, they are still several years away. With the capability of current missions, searching for individual filaments in emission is impractical, except in a few specific directions where filaments are expected. Clusters of galaxies form in the higher density regions (or nodes) of the filamentary structure and are connected by lower density filaments identified with the . Following the cluster network could therefore point to the location of the filaments. The complexity of the network and the distance between clusters makes this approach very difficult, except in few cases where clusters are sufficiently close together. Recently, an observation between the the clusters Abell 222 and Abell 223 has found evidence of excess emission attributed to a filament connecting them Werner et al. (2008).
A different way to detect the in emission is to use a statistical approach. The plasma filaments are expected to have a characteristic angular structure that can be identified and studied using the angular autocorrelation function Ursino & Galeazzi (2006); Croft et al. (2001). Hydrodynamic simulations have been used to predict the angular distribution of soft X-rays emitted by the filaments. The results show that the filaments should have typical angular scales of a few arcminutes or smaller, leaving a clear signature in the angular distribution of their X-ray emission Ursino & Galeazzi (2006). The difficulty in detecting such signature lies in the fact that the filament emission only represents a fraction of the total diffuse X-ray emission, which is dominated by unresolved point sources and diffuse galactic emission, such as Local Bubble and Galactic Halo Galeazzi et al. (2007); Mushotzky et al. (2000). Data from the ROSAT All-Sky Survey () and ROSAT pointed observations have been used to calculate the angular autocorrelation function on scales greater than 2 arcmin, but the results were dominated by emission from unresolved point sources Soltan et al. (1999); Kuntz et al. (2001). The angular autocorrelation function has also been used to quantify the possible detection of a filament using the ROSAT detector Scharf (2000).
The XMM-Newton satellite, launched in 1999, is currently the best platform to investigate the angular distribution of X-rays emitted by the missing baryons. The CCD detectors aboard XMM-Newton ( and ) have a field of view of about 30’ and an angular resolution of about 14 arcsec, covering the range of angular scales of interest. Moreover, the angular resolution of the detectors allows good source identification, strongly reducing the effect of unresolved point sources. The detectors also maintain a reasonable response down to about 0.2 keV, covering the energy range of interest.
2 Data Reduction and Analysis
For our investigation we combined several observations available in the XMM-Newton public archive, including two “proprietary” observations designed for this investigation. We used data from 11 observations, corresponding to 6 different targets. The observation characteristics are summarized in Table 1. The choice of the targets was based on several considerations. To limit the effect of absorption due to the neutral hydrogen and contamination from galactic emission we used targets at least above the galactic plane and with a neutral hydrogen column density smaller than atoms cm-2. The only exception is our proprietary observation in the direction of the neutral hydrogen cloud , which, in conjunction with the linked observation of a very low neutral hydrogen density region nearby, the Eridanus Hole, has been used as “control” observation. We also limited the investigation to targets with at least 80,000 s of observing time and sufficiently distant from any bright point source.
To characterize the angular correlation of the diffuse X-ray background we used the angular autocorrelation function () which, in the following form, has also been used for the characterization of the diffuse X-ray emission Soltan et al. (1999):
| (1) |
where is the intensity in the direction , is the product of intensities with angular separation , and denotes the expectation values of the corresponding quantities. A practical recipe to calculate the on a single image, using a weighting of the intensity based on exposure time, is Ursino & Galeazzi (2006):
| (2) |
where the sum is over the pairs of pixels separated by , is the count rate in those pixels, is the exposure time for those pixels, used as statistical weight, and denotes the average count rate.
Even when no bright objects are present in an X-ray field, the image contains the contribution from the Diffuse X-ray background and the detector intrinsic background. Moreover, in the soft X-ray band (below 1 keV) the Diffuse X-ray Background does not have a unique source, but is the overposition of contributions from 5 different sources, which are, in order of distance from the Earth (e.g., Galeazzi et al. - 2007):
-
•
Solar Wind Charge Exchange. When the highly ionized solar wind interacts with neutral gas in our atmosphere and in the interplanetary medium, an electron may jump from the neutral to the ion. The electron then cascades to the lower energy level of the ion, emitting soft X-rays in the process.
-
•
Local Bubble. It is believed that the sun lies in a cavity of the interstellar medium extending about 100 pc in all directions, filled with 1,000,000 K plasma. The plasma is highly ionized, emitting radiation in the soft X-ray band.
-
•
Galactic halo. Our galaxy is surrounded by a “halo” of high temperature plasma, probably due to intergalactic gas falling into the gravitational well of the Milky Way. The temperature of such gas is believed to be higher than that of the Local Bubble, emitting in the soft X-ray band at slightly higher energy.
-
•
Intergalactic gas. The focus of this investigation.
-
•
Unresolved point sources. A significant contribution to the diffuse X-ray background comes from point sources (mainly s) that are too faint to be individually resolved by the X-ray telescope.
When calculating the of a blank field in the sky, the result is therefore the combination of all mentioned contribution, according to the expression:
| (3) |
where and represent the total flux and the fluxes of each individual component, is the total , and are the of each individual component. Solar Wind Charge Exchange, Local Bubble, and Galactic Halo have no correlation in the angular scale investigated and , however their flux will contribute to . The equation can therefore be rewritten as:
| (4) |
where the index indicates detector background, point sources, and the .
3 Contamination from Other Sources
We discuss here the steps taken to properly assess and remove all sources of possible contamination and their effect on our result.
3.1 Unresolved point sources.
Unresolved point sources, including active galactic nuclei (), blazars, galaxies, galaxy clusters and groups, and stars are expected to have a characteristic angular signature in the same angular range of filaments, possibly shadowing the signature of the missing baryons. The total contribution of point sources to the diffuse X-ray emission has been well characterized in the energy band of interest for our investigation Mushotzky et al. (2000); Giacconi et al. (2001); McCammon et al. (2002); Gandhi (2006). Using the angular resolution of XMM-Newton and the long exposure time of the observations, we have bee able to identify and remove the brightest sources, corresponding to % of the total point source flux. The source identification is done using XMM-Science Analysis Software point source detection algorithm that iteratively identifies point sources above threshold using images both in the 0.5-2 keV and 0.4-0.6 keV energy ranges.
The removal of the unresolved point sources contribution is the most critical part of the analysis. The total flux from point sources has been estimated by many authors. For our work, we used a conservative approach based on data from McCammon et al. (2002). The McCammon et al. (2002) paper reports a high spectral resolution investigation of the diffuse X-ray background. The high spectral resolution allows an easy identification of emission lines at redshift zero, and we used the flux outside these lines as an upper limit to the point source emission. For the evaluation of the shape of the , we assumed instead that the shape does not change between resolved and unresolved point sources. While by definition unresolved point sources are weaker than the identified ones, potentially belonging to a different population, it has been shown that the contribution of weak sources to the is equal or smaller than that of bright sources Giacconi et al. (2001). We also used a combined XMM-Newton - Chandra list of identified point sources in the Hubble Deep Field N target. Using the Chandra catalogue improves by a factor of 30 the threshold of identified point sources (from ergs s-1 cm-2 to ergs s-1 cm-2) and does not reduce the value of the measured AcF. A control “experiment” using the value of the in a different energy range fully confirms the validity of our procedure and is discussed in the results section.
3.2 Instrumental background
The instrumental background is expected to produce a uniform “counts” image; however, when we divide the uniform ”counts” image by the non uniform exposure map to extract a “flux” image, we artificially generate an angular correlation due to the detector background. In our analysis the background flux is measured using spectral information, while its is calculated by using a flat image divided by the exposure map. The procedure we used to evaluate the instrumental background in XMM-Newton data has been described in details and tested in Galeazzi et al. (2007).
3.3 Absorption from the neutral hydrogen
The neutral hydrogen column density may not be uniform across each individual field of view, potentially introducing an artificial angular correlation due to its X-ray absorption. We used 100 data to generate neutral hydrogen maps of the fields used in this investigation and to evaluate the signal due to the neutral hydrogen distribution. We verified that the effect is negligible.
3.4 Control observations
We used our proprietary observations of MBM20 and the Eridanus hole to verify that all spurious “local” effects, such as Local Bubble non-uniformity and instrumental contributions, have been properly identified and removed and the correlation signal that we see is due to the extragalactic emission. The average neutral hydrogen column density of MBM20 is cm-2, absorbing approximately 75% of the non local X-ray flux in the energy of interest (including from the missing baryons), and cm-2 in the Eridanus hole observation, absorbing only about 8% of the non local X-ray flux Galeazzi et al. (2007). The two targets are very close to each other (about apart) and therefore should not be affected by any significant spatial variation in the magnitude of the (“Cosmic Variance”).
4 Results
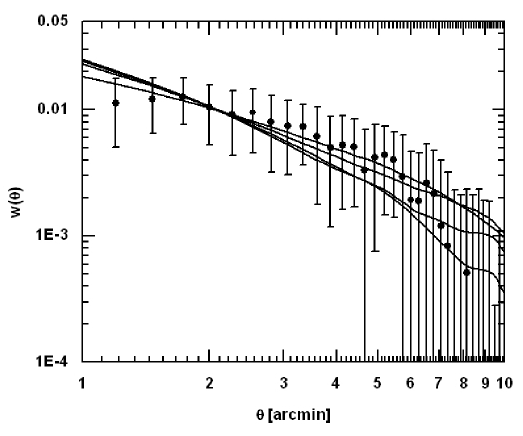
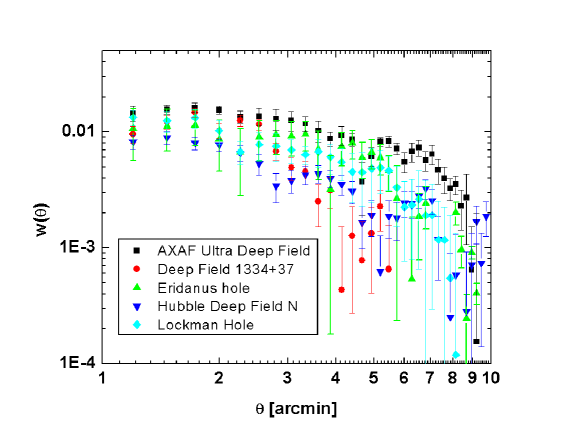
To maximize the signal from the filaments compared to other sources, we focused on a narrow energy band between 0.4 and 0.6 keV, where the OVII and OVIII emission from filaments at redshift up to about 0.5 are concentrated. Figure 1 shows the average of all the observations excluding MBM20. The contributions due to unresolved point sources, instrumental background, and neutral hydrogen absorption have already been removed. Each individual observation shows a strong non-zero correlation for angles below about 6 arcmin, each with a significance of several sigmas ( for every field, - See Fig. 2 and Table 2). The error bars in Fig. 1 are a combination of the statistical errors from each target (Fig. 2) and a statistical error due to Cosmic variance, i.e., variation between targets, as predicted by simulations. The latter is calculated simply as the standard deviation in the values from the different targets. The error bars are dominated by cosmic variance, and do not represent the statistical limit of the measurement.
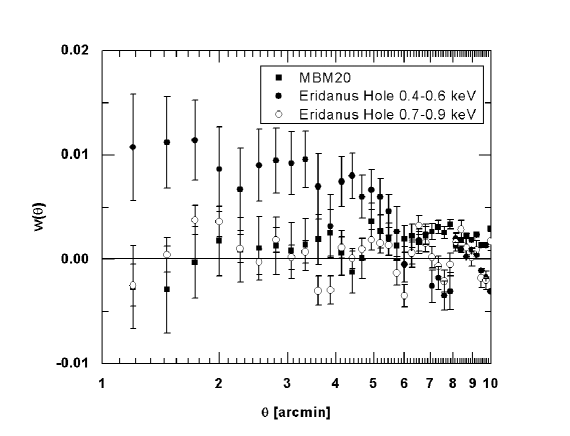
Figure 3 shows the calculated AcF for the control target MBM20. In this case the AcF is compatible with zero (, ). The Eridanus hole in the same energy range, in contrast, is similar to the average low neutral hydrogen density and significantly different from zero for all angles below 6 arcmin (, ). The result confirms the effectiveness of our procedure at removing all “local” sources of contamination. To verify the validity of our procedure at removing the contribution from point sources and confirm our result we repeated the same procedure used to calculate the for the Eridanus Hole field in the energy range 0.7-0.9 keV. The new energy range is very close to the original one and the contribution from point sources is expected to be very similar. However, the new range is just above the energy of most lines that are emitted by the intergalactic filaments and no significant contribution from the is expected. The Eridanus Hole from the new energy band is also shown in Fig. 3. The result is compatible with zero (, ) and is incompatible with the AcF from the same target for the energy band 0.4-0.6 keV (, ). This result clearly supports the effectiveness of our procedure and the validity of the claimed detection in the lower energy band.
We also compared the experimental result with the expected signal derived from our simulations of the filament emission (Fig. 1). After subtracting the contribution from detector background and point sources Eq. 4 can be written as:
| (5) |
where includes, in this case, the flux from all the components of the diffuse X-ray background except point sources that have already been removed. To evaluate the X-ray flux from the (), we used the total X-ray flux in the range 0.4-0.6 keV minus the flux from point sources as an estimate of , the measured from Fig. 1 for , and the results from our simulations of the X-ray emission from the (e.g., Ursino & Galeazzi - 2006, Ursino et al. - 2008 in preparation, see Fig. 1) for . The errors from experimental data and simulations, and the spread in the simulations due to the different models have been combined to estimate the final error. We found that the fraction of X-rays due to the missing baryons in the 0.4-0.6 keV band is % of the total diffuse X-ray emission (including point sources) in the same band. This is in agreement with theoretical predictions and simulations Ursino & Galeazzi (2006); Croft et al. (2001); Phillips et al. (2001).
5 Conclusions
We studied the angular distribution of the diffuse X-ray emission from 6 targets available in the XMM-Newton public archive. After removing all knows sources of contamination we found a clear signal that we attribute to emission from the Warm-Hot Intergalactic Medium. A comparison with simulations indicate that, in the energy range 0.4-0.6 keV, the WHIM emission correspond to % of the total diffuse X-ray emission. The statistical significance of our detection is several sigmas ( ). The error bar in the X-ray flux is dominated, instead, by cosmic variation and model uncertainties.
References
- Bennett et al. (2003) Bennett, C. L. et al. 2003, ApJS, 148, 1
- Borgani (2004) Borgani, S. et al. 2004, MNRAS, 348, 1078
- Burles & Tytler (1998) Burles, S., & Tytler, D. 1998, ApJ, 499, 699
- Cen & Ostriker (1999) Cen, R., Ostriker, J. P. 1999, ApJ, 514, 1
- Cen & Ostriker (2006) Cen, R., Ostriker, J. P., 2006, ApJ, 650, 560
- Croft et al. (2001) Croft, R. A. C., et al. 2001, ApJ, 557, 67
- Danforth et al. (2006) Danforth, C. W., et al., 2006, ApJ, 640, 716
- den Herder et al. (2007) den Herder, J. W., et al., 2007, Proc. SPIE, 6688, 668805
- Fukugita et al. (1998) Fukugita, M., Hogan, C. J., & Peebles, P. J. E. 1998, ApJ, 503, 518
- Galeazzi et al. (2007) Galeazzi, M., Gupta, A.,Covey, K., & Ursino, E.,et al 2007, ApJ, 658, 1081
- Gandhi (2006) Gandhi, P., 2006, A&A, 457, 393
- Giacconi et al. (2001) Giacconi, R., et al. 2001, ApJ, 551, 624
- Kaastra et al. (2006) Kaastra, J. S., et al., 2006, ApJ, 652, 189
- Kirkman et al. (2003) Kirkman, D., et al. 2003, ApJS, 149, 1
- Kuntz et al. (2001) Kuntz, K. D. et al. 2001, ApJ, 548, L119
- McCammon et al. (2002) McCammon, D., et al. 2002, ApJ, 576, 188
- Mushotzky et al. (2000) Mushotzky, R.F.,Cowie, L.L., Barger, A.J.,& Arnaud, K.A., et al. 2000, Nature, 404, 459
- Nicastro et al. (2005) Nicastro, F., et al.,2005, Nature, 433, 495
- (19) Nicastro, F., et al., 2005b, ApJ, 629, 700
- Phillips et al. (2001) Phillips, L. A., Ostriker, J. P., & Cen, R., 2001, ApJ, 554, L9
- Rasmussen et al (2007) Rasmussen, A. P., et al., 2007, ApJ, 656, 129
- Rauch et al. (1997) Rauch, M., et al. 1997, ApJ, 489, 1
- Scharf (2000) Scharf, C., et al. 2000, ApJ, 528, L73
- Soltan et al. (1999) Soltan, A. M., et al., 1999, A&A, 349, 354
- Ursino & Galeazzi (2006) Ursino, E., & Galeazzi, M., 2006, ApJ, 652, 1085
- Weinberg et al. (1997) Weinberg, D. H., Miralda-Escudé, J., Hernquist, L., & Katz, N. 1997, ApJ, 490, 564
- Werner et al. (2008) Werner, N., et al., 2008, A&A, 482, L29.
- Williams et al. (2006) Williams, R. J., et al., 2006, ApJ, 642, L95
| Target | l | b | NH( ) | Exposure (s) |
|---|---|---|---|---|
| Lockman Hole | 149 16 48.1 | 53 08 45.9 | 0.7 | 628,945 |
| Hubble Deep Field N | 125 53 31.3 | 54 48 52.4 | 1.4 | 131,751 |
| Deep Field 1334+37 | 85 37 22.5 | 75 55 16.4 | 0.8 | 165,989 |
| Eridanus Hole | 213 25 17.9 | -39 04 25.6 | 0.86 | 50,230 |
| AXAF Ultra deep F | 223 34 36 | -54 26 33.3 | 1.0 | 431,618 |
| MBM20 | 211 23 53.2 | 36 32 41.8 | 15.9 | 31,419 |
| Target | Degrees of Freedom | |
|---|---|---|
| Lockman Hole | 283 | 19 |
| Hubble Deep Field N | 1152 | 19 |
| Deep Field 1334+37 | 540 | 19 |
| Eridanus Hole | 514 | 19 |
| AXAF Ultra deep F | 136 | 19 |