MRC B0319454: Probing the large-scale structure with a giant radio galaxy
Abstract
We present an investigation of the relationships between the radio properties of a giant radio galaxy MRC B0319-454 and the surrounding galaxy distribution with the aim of examining the influence of intergalactic gas and gravity associated with the large-scale structure on the evolution in the radio morphology. Our new radio continuum observations of the radio source, with high surface brightness sensitivity, images the asymmetries in the megaparsec-scale radio structure in total intensity and polarization. We compare these with the 3-D galaxy distribution derived from galaxy redshift surveys. Galaxy density gradients are observed along and perpendicular to the radio axis: the large-scale structure is consistent with a model wherein the galaxies trace the ambient intergalactic gas and the evolution of the radio structures are ram-pressure limited by this associated gas. Additionally, we have modeled the off-axis evolution of the south-west radio lobe as deflection of a buoyant jet backflow by a transverse gravitational field: the model is plausible if entrainment is small. The case study presented here is a demonstration that giant radio galaxies may be useful probes of the warm-hot intergalactic medium believed to be associated with moderately over dense galaxy distributions.
keywords:
galaxies: active – galaxies: individual (MRC B0319454) – galaxies: jets – intergalactic medium – radio continuum: galaxies1 Introduction
In a powerful radio galaxy, reaccelerated jet material inflates the synchrotron lobes after passage through the termination shocks at the jet ends (Scheuer, 1974; Begelman et al., 1984). The synchrotron lobes interact with the surrounding thermal gas and their morphologies are a result of this interaction. In cluster environments, where XMM-Newton and Chandra have been able to detect and image the relatively dense intra-cluster medium (ICM) in X-rays, the total intensity radio and X-ray contours follow each other and X-ray holes are observed at the locations of the radio lobes (e.g. Boehringer et al., 1993; McNamara et al., 2000; Nulsen et al., 2002; Bîrzan et al., 2004). These holes are evidence that the expanding radio lobes interact with, and displace the X-ray emitting gas. Lobe interaction with intra-cluster gas is also apparent in the bending of radio plumes in wide-angle and narrow-angle tailed radio sources (e.g. Bliton et al., 1998; Hardcastle et al., 2005; Douglass et al., 2008). The morphologies of these sources suggest that the radio tails are deflected behind the moving host galaxy, due to the ram-pressure exerted by the ICM.
Giant radio galaxies, which have linear sizes of Mpc, tend to reside outside of rich clusters (Jamrozy et al., 2004). Their giant lobes, which extend well beyond the interstellar media (ISM) and coronal halos of their host galaxies, represent the interaction between the light synchrotron lobe plasma and the heavier intergalactic medium (IGM). If galaxies are a reliable tracer of the IGM gas, then we expect the distribution of gas around a giant radio galaxy to depend on the position of the host galaxy relative to large-scale structure in the IGM. Since the evolution of the radio lobes depends on their interaction with this ambient gas, large scale structure (and the associated gas) is also expected to determine the lobe dynamics in giant radio sources. For example, if the parent optical galaxy resides at a boundary between an over-density and a void, then there may be a gradient in the gas density surrounding the radio source. If this gradient is aligned with the radio jet axis, then we would expect an asymmetry to arise in the lobe lengths, due to differing ram-pressure limitations in the ambient gas on the two sides. If, on the other hand, the gradient in the gas density is transverse to the jet axis, then we would expect the light synchrotron lobes to evolve transverse to the jet axis and in the direction of decreasing ambient density and pressure due to buoyancy.
The diffuse gas in the environs of giant radio galaxies, outside of rich clusters, most likely pertains to the warm-hot phase of the IGM, whose existence at low-redshifts has been predicted by large-scale cosmological hydrodynamical simulations of galaxy formation (Cen & Ostriker, 1999, 2006; Davé et al., 2001). In the simulations, the warm-hot gas follows the filamentary galaxy distribution on large scales and represents unvirialized over-densities in the range 10-30. Little is known about this warm-hot gas since its thermal emission is not detectable by present day X-ray telescopes. However, the shape taken by the lobes of a giant radio galaxy is a visible manifestation of their interaction with the surrounding gas. These galaxies, therefore, make ideal probes of the unseen ambient medium, which may be the warm-hot intergalactic medium (WHIM).
Recently, the 1.8 Mpc lobes of the giant radio galaxy MSH 0522 were used to constrain the properties of its ambient thermal gas (Subrahmanyan et al., 2008). The lobes in this galaxy appear to be relicts and there is an observed asymmetry, which appears to be related to an anisotropy in the local galaxy distribution. A comparison of the properties of the radio lobes and those of the ambient gas, which were derived from the surrounding galaxy distribution, indicated that the lobes were highly overpressured despite their relict appearance. Alternatively, the density-temperature product for the ambient IGM might be an order of magnitude larger than that predicted by structure formation models indicating significant feedback in the IGM.
In this paper, we present a similar study of another giant radio galaxy MRC B0319454 (also referred to previously as MSH 0343 and PMN J03214510) and its environment. The 2.5 Mpc radio source is located within a galaxy filament of the Horologium-Reticulum super-cluster (Fleenor et al., 2005) at a redshift of . Its 26′size on the sky, make the measurement of the surrounding galaxy distribution possible with multi-object fibre instruments such as AAOmega on the Anglo-Australian Telescope. MRC B0319454, therefore, provides a further opportunity to study the morphology of a giant radio galaxy and its relationship to the surrounding galaxy distribution. Such studies are a first step in using giant radio galaxies as probes of the unseen intergalactic gas associated with large-scale galaxy structures.
The giant radio source MRC B0319454 was previously observed at 843-MHz with the Molonglo Observatory Synthesis Telescope (MOST), and with the Australia Telescope Compact Array (ATCA) at 20, 13 and 6 cm (Jones, 1989; Saripalli et al., 1994). In the latter work, Saripalli et al. presented a detailed study of the morphology of the giant radio galaxy pointing out a number of features that make the radio source unusual: a unique configuration of five compact hot spots in one of the lobes, a prominent jet and counter-jet detected out to exceptional distances, and lobes that are asymmetrically shaped and positioned about the core. Considering the likely expansion velocity of the source, it was argued that light travel-time effects were not responsible for the asymmetry in the lobe separations from the core. Based on an examination of the projected galaxy distribution around the host, Saripalli et al. attributed this feature to corresponding asymmetries in the ambient intergalactic medium.
Given the Mpc size and pronounced asymmetries in the radio morphology, MRC B0319454 is an excellent example of a radio galaxy where the morphology is shaped by the IGM. In this paper, we examine the interaction between the lobes and the ambient IGM using our new radio observations made with the specific purpose of imaging the radio lobes fully. Our new improved radio images of MRC B0319454 have been made using an observing mode designed to have high surface brightness sensitivity and in full polarization. We use these in conjunction with redshift measurements of the surrounding galaxy distribution, in an attempt to model the interaction between the giant lobes with their IGM environment. Our radio observations include polarization measurements for the first time.
The paper is organized as follows: In Sect. 2 we present our new radio continuum images of MRC B0319454. In Section 3, we describe the galaxy redshift data; in the sections that follow an attempt is made towards understanding the lobe-IGM interaction assuming that the galaxy distribution traces the gas distribution on large scales. Throughout we adopt a flat cosmology with parameters , and a Hubble constant km s-1 Mpc-1. The host elliptical galaxy, ESO 248-G10 (also cataloged as AM 0319452), has an R-band absolute magnitude (Saripalli et al., 1994). Previously, the redshift of the host was estimated to be (Jones, 1989); our new data, presented herein, give an estimate of . At this redshift, 1″= 1.2 kpc.
2 Radio continuum imaging
New radio continuum observations of MRC B0319454 were made with the ATCA during the period 2003 September to 2004 April. These were aimed at accurately imaging the extended total intensity and polarization structures in the 26′ source in the 20 and 13 cm bands. Earth-rotation synthesis with full UV coverage were made in 5 separate array configurations that emphasized low spatial frequencies: 1.5D and 1.5A 1.5-km arrays, a 750B 750-m array, a EW352 352-m array, and a compact EW214 214-m array. The relatively compact configurations were for improving sensitivity to the low surface brightness structures, while the relatively longer 1.5-km arrays were to enable imaging with sub-arcminute resolution. Visibilities were measured simultaneously in two bands, 128-MHz wide, centered at 1378 and 2368 MHz. The continuum bands were covered in 13 independent channels. A journal of the observations is in Table 1. The ATCA antennas have primary beam full width half maximum (FWHM) of about 35′ and 21′ respectively in the 20 and 13 cm bands. Therefore, to accurately image the extended emission in this 26′source we adopted the approach of mosaic observing and covered the double radio source with 8 separate pointings in a grid. A grid spacing of about 10′, which is approximately equal to the sky plane Nyquist sampling requirement for observing in the 13 cm band, was adopted for the pointings.
Data at both frequencies were reduced using standard procedures in the MIRIAD package. The flux-density scale was set using observations of the primary calibrator, PKS B1934638, whose flux density was adopted to be 14.9 and 11.6 Jy respectively, at 1378 and 2368 MHz. Antenna complex gains were initially calibrated using data recorded during the frequent observations of the nearby secondary calibrator PKS B0332403. The brightnest component in the double radio source at the observing frequencies is the SW hot spot. The visibility data corresponding to the single pointing centered near this bright hot spot was initially imaged and these visibilities were iteratively self-calibrated; subsequently these self-calibration gain corrections were applied to all the pointing data. At 1378 MHz several rounds of phase-only self calibration were applied, followed by one round of amplitude and phase self-calibration. At 2368 MHz only one round of phase-only self-calibration was applied, further rounds did not noticeably alter the image. Images of all individual pointings at 1378 and 2368 MHz were deconvolved using the Clark clean algorithm. The deconvolved images were smoothed to a common resolution and then combined in a linear mosaic process using the MIRIAD routine LINMOS. The primary beam attenuation over the entire mosaic image was corrected during the computation of the linear mosaic.
The final image output by LINMOS was made as a weighted merge of individual pointing images, which had been individually deconvolved; therefore, the resulting mosaic image is not a true mosaic but what is usually referred to as a ‘cut-and-paste’ mosaic. A true joint mosaicing algorithm could potentially image extended structures on scales that are larger than the primary beam of individual antennas and comparable to the mosaic area. However, such joint-mosaicing is dynamic range limited owing to uncertainties in the primary beam at low levels well off the axis: this limitation is relevant while imaging large fields containing bright emission peaks, as is the case here for MRC B0319454 since the source has a bright hot spot. We have not adopted a true joint mosaicing approach for this reason. Nevertheless, we note that the largest angular scales expected to be reliably reproduced by the cut-and-paste mosaic are adequate because the angular scales of the largest emission structures are expected to be less than the primary beam FWHM.
2.1 1378 MHz radio continuum
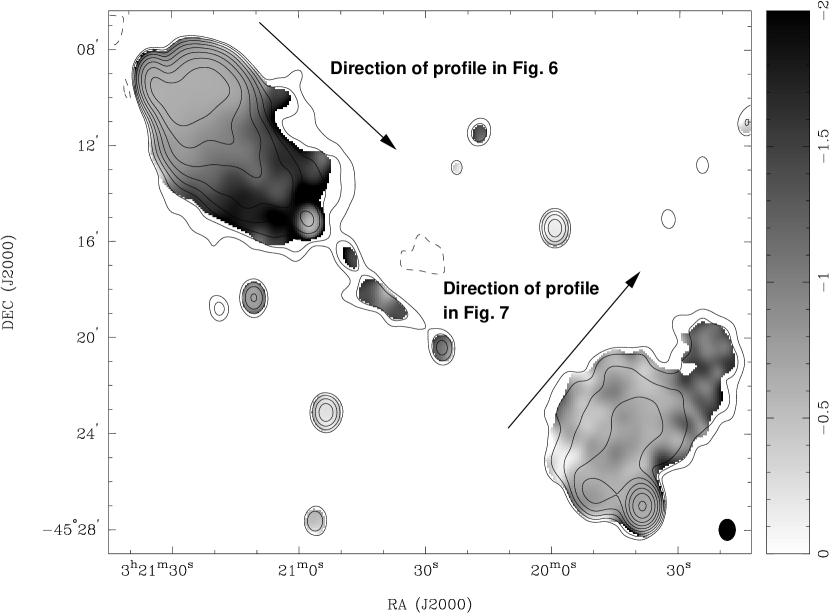
The mosaic image of MRC B0319454 at 1378 MHz is shown in Fig. 1. The image was made with a beam of FWHM at a position angle of 0∘. The rms noise in the image in the vicinity of the radio galaxy is 0.25 mJy beam-1. The image dynamic range, defined as the ratio of the peak brightness over the entire image to the rms noise, exceeds a 1000:1. The total intensity image of the giant radio source shows an edge-brightened double radio source with two large radio lobes that are located to the north-east (NE) and south-west (SW) of the radio core (whose location is marked in Fig. 1). Extended emission is also detected associated with a partial jet that extends from the core in the direction of the bright SW hot spot. The jet, as in previous MOST and ATCA images is traced only over a distance of 7′ from the core, which is about one-third of the distance between the core and SW hot spot. A weak radio source, which is associated with a spiral galaxy (Jones, 1989), is located (in projection) on the radio axis at the end of the observable SW jet. This object has a redshift of and its location on the sky along the path of the SW jet and towards the end of its visible length is likely a chance coincidence: the galaxy is probably a few tens of Mpc beyond the radio source.
Two broad peaks of enhanced radio emission are located adjacent one another and on either side of the radio axis at the end of the NE lobe. The ridge-like peak on the eastern boundary is elongated parallel to the radio axis, extends further from the core relative to the neighbouring peak located on the western boundary, and is also slightly brighter than the second peak. It may be noted here that higher resolution images of this lobe (Saripalli et al., 1994) resolve the ridge along the eastern boundary into a chain of hot spots, and suggest that the NE jet currently terminates at a recessed hot spot located in-between the two broad peaks seen in Fig. 1. The post-hot spot lobe material in this NE lobe appears to be distributed along the radio axis. The radio core component, coincident with the host galaxy, appears to be enveloped by this lobe plasma, at least in projection. Our new ATCA mosaic image at 1378 MHz, with higher sensitivity to extended emission compared to previous images, reveals low surface-brightness and extended lobe material in the vicinity of the radio core. The boundary of lobe plasma in parts of the NE lobe close to the core is not sharp: the wider spacing in the logarithmic radio contours along the NW and SE boundaries indicate a relaxed state for this lobe material. Additionally, the distribution of this cocoon plasma close to the core is not symmetric about the radio axis: the lobe is more extended on the NW side.
The SW radio lobe is markedly different in its radio structure compared to the NE lobe. The SW lobe is dominated by a bright hot spot, which protrudes from the end of a low surface brightness lobe. There is a large emission gap between the SW lobe and the core. A secondary peak of enhanced emission, also noted in previous MOST and ATCA images, is observed on the eastern boundary of this SW lobe and recessed from the bright hot spot; this may be the site of a past hot spot or the site where the current jet bends before terminating at the bright hot spot.
The expansion and movement of the post-hot spot plasma in this SW lobe is extremely asymmetric about the source axis: the flow appears directed to the NW and perpendicular to the radio axis. Our new 1378-MHz ATCA mosaic image clearly reveals an extension to the low surface brightness cocoon material, perpendicular to the radio axis and in the NW direction. The boundary of the SW lobe appears to be relatively sharply bounded along the SE. Towards the NW, although the boundaries of the extended emission appear to be defined, the lobe surface brightness fades away more gradually into the plume-like extension.
The angular size corresponds to a projected linear size of 1.9 Mpc. We measure the total flux density at 1378 MHz to be 3.86 Jy for the giant radio galaxy, which is in close agreement with the 1472-MHz flux density measurement in Saripalli et al. (1994). The implied radio power is W Hz-1. Considering the absolute R-band magnitude of the host galaxy, (Saripalli et al., 1994), MRC B0319454 is placed slightly below the FR I/FR II dividing line and in a region populated by FR I objects in the distribution in Ledlow & Owen (1996). However, it is relatively common for giant sources, with FR II morphologies, to have radio powers near the FR I/FR II transition (Ishwara-Chandra & Saikia, 1999). Also, MRC B0319454 is a high excitation radio galaxy — an optical spectrum of the host galaxy shows strong narrow emission lines (Bryant & Hunstead, 2000). The host galaxies of FR-II radio sources tend to have high excitation lines in their optical spectra (Hardcastle et al., 2007); in this respect the emission line properties of MRC B0319454 are consistent with its morphological classification as an FR-II radio galaxy.
2.2 2368 MHz radio continuum
Our new 2368 MHz ATCA mosaic image of MRC B0319454 is shown in Fig. 2. The image was made with a beam FWHM of at a position angle of 0∘. The rms noise on the image, in the vicinity of the giant radio galaxy, is 0.15 mJy beam-1 and the image dynamic range exceeds 1000:1. We measure the total flux density at 2368 MHz to be 2.46 Jy. This is notably higher than the corresponding flux density measurement of 2.04 Jy in Saripalli et al. (1994) and implying that the earlier 13-cm band ATCA image may have missed a significant fraction of the radio emission.
We find good agreement between the previous and new ATCA images made in the 13-cm band. Notably, both show the same multiple hot spot complex at the end of the NE lobe. Our lower resolution image reveals 4 peaks at the lobe end (see the inset in Fig. 2). The brightest and most compact of these is located at the very tip of the lobe, and in projection, is seen to protrude from the lobe end. Additionally, as would be expected from the increased total flux density in the new images, our 13-cm band image presented here recovers some of the extended low-surface-brightness lobe emission in the vicinity of the radio core, which was not detected in the previous 13-cm ATCA image.
The extended structure of the giant radio galaxy as observed in the 13-cm band image compares well with that in the 20-cm band image; however, the lowest surface brightness features seen in the 20-cm band image are barely imaged at 13 cm. For example, a slight flare in the lowest contour along the NW edge of the NE lobe is observed in our 13-cm band image: the asymmetry in the NE lobe in the vicinity of the core is not as prominent in the 13-cm band compared to the 20-cm band. The 13-cm band image also hints at the extension of low-surface-brightness material in the SW lobe towards NW: once again, although this faint material is reliably detected in the 20-cm band image, it is relatively fainter at 13-cm.
2.3 Polarization and rotation measure
Polarization images at 1378 and 2368 MHz were constructed from CLEANed Stokes I, Q, and U images made with a beam of FWHM at a P.A of 0∘. The polarization position angle images at the two frequencies were used to compute the distribution of rotation measure (RM) over the giant radio source. Since the difference in the orientations of the polarization vectors at 1378 and 2368 MHz is observed to be small, we have assumed that our RM estimates do not suffer from ambiguities. The computed magnitudes of RM are small over the entire source: mean RM is 0 rad m-2 and the 1- scatter is less than 7 rad m-2. It may also be noted here that our low RM values are consistent with those expected for this line of sight through the Galaxy in the analysis of Simard-Normandin & Kronberg (1980). Additionally, within the errors, we do not observe any significant gradients in the RM distribution across the source.
The distribution in the 1378 MHz polarized intensity is shown in Fig. 3. Overlaid are vectors showing the observed orientations of the projected electric field (-field) with bar lengths proportional to the fractional polarization. The small scatter in RM over the source implies that the intrinsic position angles of the electric field are within about 10∘ of the observed angles. The polarized intensity image shows that there are two regions of relatively intense polarized emission at the end of the NE lobe, which coincide with the broad peaks in total intensity. The fractional polarization in these regions is about at our resolution. A narrow channel of low polarized intensity and low fractional polarization runs between the two regions. Along this channel the polarization vectors sharply change in position angle; therefore, the channel is likely a result of beam depolarization (Haverkorn et al., 2000). Another channel of low polarization is observed along the radio axis in the region mid-way between the radio core and the end of the NE lobe. To each side of this channel there are two rails of polarized emission where the fractional polarization is about . The projected magnetic field lines, which are perpendicular to the displayed -vectors, follow the total intensity contours over most of the NE lobe excepting the central parts. The magnetic field is circumferentially oriented along all of the boundaries at the far end of the NE lobe, as well as along the edges of the lobe close to the core component, where enhancement in the fractional polarization is also observed.
The distribution of polarized emission over the SW lobe is very similar to the total intensity radio structure. There is a bright peak in polarized emission at the location of the bright hot spot and there are weaker peaks in polarized intensity recessed from the hot spot. Over the extended low surface brightness regions of the SW lobe, the distribution of polarized emission is fairly uniform and the fractional polarization is about . The fractional polarization is enhanced at the total intensity hot spot as well as at the lobe boundaries. The fractional polarization values are particularly high, and in the range 30-, along the eastern and SW edges. We have collapsed our image in fractional polarization of the low-surface-brightness SW lobe—excluding the hot spot—along a direction perpendicular to the source axis. The resulting profile (Fig. 4), shows that the fractional polarization is enhanced at the SE end, has a shallow minimum in the central regions of the lobe, then increases towards the NW. However, there is a second dip in the fractional polarization at the base of the extension observed in this lobe towards NW and within the extension the fractional polarization values increase again to about 30% at the end.
We have computed the average depolarization ratio (DR; a ratio of the fractional polarization at 1378 MHz to that at 2368 MHz) over different regions of the giant source. The ratio is about 1.0 at the bright ends of the NE and SW lobes. In the NE lobe, the depolarization ratio is about 0.9 in the central regions of the lobe away from the hot spots and decreases to 0.75 in the vicinity of the radio core. In the SW lobe, the depolarization ratio is and fairly constant over the low surface brightness regions, with the exception of the NW extension where the mean depolarization ratio is around 0.6.
2.4 Spectral index
We have collated radio flux density measurements for the giant radio source from the literature and these are tabulated in Table 2. The value at 408 MHz was computed from the 408-MHz all sky survey of Haslam et al. (1982); the quoted error reflects the uncertainty in the foreground subtraction. The total spectrum for the entire source is a power law with spectral index over the range 408 MHz – 4850 MHz (the spectral index is defined using the relation ). The total spectra for the NE and SW lobes appear straight over the frequency range 843–4850 MHz (where separate flux density estimates are available for the two lobes) with for the SW and for the NE lobe. We note that the 843-MHz flux density for the SW lobe (Jones, 1989) is similar to the 1378 MHz value derived from our image: it is likely that the MOST measurement is missing flux density. At lower frequencies (80 - 160 MHz), we only have measurements of the flux density in the NE lobe. These are below the extrapolation of the high frequency power-law spectrum. The measurements indicate that the NE lobe has a flattening of the spectral index below 408 MHz; however, it is possible that the low frequency MSH values are erroneous: Mills et al. (1960) note that the 80-MHz measurement is affected by sidelobes.
We have computed the spectral index distribution over the giant radio source between 1378 and 2368 MHz using images with beams of FWHM at P.A of 0∘. The resulting image is shown in Fig. 5; the image has been blanked where the pixel values in the individual images are less than 4 times the rms noise.
The distribution in spectral index shows a steepening of the spectral index along the axis and towards the core in the case of the NE lobe, and in a direction transverse to the source axis and towards NW in the case of the SW lobe. In both cases the steepening is along the axes of the lobes. If we assume that older parts of the lobes have steeper spectra, as a consequence of spectral aging, then the observed spectral gradients suggest a backflow in the NE lobe from the hotspots towards the core, and a transverse flow off axis in the case of the SW lobe. We have made profiles of these observed spectral index gradients by collapsing the spectral index distribution image of the NE lobe perpendicular to the source axis, and that of the SW lobe along the source axis. The profile along the NE lobe (Fig. 6) shows that the spectral index smoothly steepens along the length of the lobe from the bright end towards the core. The profile in the SW lobe (Fig. 7) shows an abrupt change in spectral index between the bulk of the SW lobe and the extension towards NW: a step in the spectral index is observed between these two features. The mean spectral index preceding the step is , in the extension the mean value is .
3 The host galaxy and its environment
The host galaxy, ESO 248-G10, is a luminous giant elliptical galaxy with a warped central dust lane (Saripalli et al., 1994). Images of the parent galaxy at optical and near-infrared wavelengths are consistent with a model in which the host elliptical is triaxial with the radio axis along the minor axis (Bryant & Hunstead, 2000). Based on the orientation of the dust-lane, Bryant et al. argue that the radio jet axis makes an angle of 65∘ to the line of sight: the jet to the NE is pointed away from us where as the SW jet is towards us.
In the following sections, we present our 2dF spectroscopy of objects in the neighbourhood of the host and use these, along with archival 6dF data, to infer the distribution of galaxies and large-scale structure in the environment of the giant radio source.
3.1 2∘ field multi-fibre spectroscopy
We obtained optical spectra of objects in the vicinity of MRC B0319454 using the AAOmega instrument on the Anglo-Australian Telescope (AAT), and its predecessor, the Two degree Field (2dF) instrument. The 2dF facility is a multi-object spectrograph, located at the prime focus of the AAT, capable of measuring simultaneous spectra within a 2∘-diameter field in a single observation (Lewis et al., 2002). The AAOmega instrument, which is the successor to 2dF, is a dual-beam (blue and red arm) bench-mounted spectrograph that uses the 2dF fibre positioner at the prime focus. It provides greater throughput, stability and resolution than the decomissioned 2dF spectrographs.
Our targets for the multi-fibre spectroscopy were galaxies with bJ magnitudes in the range of 15.0–19.5 selected from the SuperCOSMOS catalogue within a 2-degree field around the host galaxy. The selection was restricted to those objects identified to be galaxies (and not stars) in the catalogue. A total of 1033 candidate galaxies were identified in the chosen magnitude range. However, approximately 200 objects in the resulting target list were previously observed in a 2dF survey of the Horologium-Reticulum supercluster, which fortuitously covered a space-volume including MRC B0319454 (Klamer et al., 2004). We retained about 20 of these objects in our target catalogue as a consistency check, and omitted reobserving the others.
Two separate field configurations were prepared for the robotic fibre positioner using the CONFIGURE routine that is part of the 2dF user software. For this allocation exercise, we gave priority to objects with bJ magnitudes close to that of the host galaxy. Specifically, objects with were assigned the highest priority of 9. Decreasing priorities were given to objects in progressively fainter magnitude ranges: (priority 8), (priority 7), and (priority 6). The CONFIGURE routine was also used to allocate approximately 20 fibres to blank sky and 4 guide fibres to stars. Locations of these objects were confirmed by examining SuperCOSMOS digitized sky survey images.
One of our two 2dF field allocations was observed on the AAT during service time on 2003 November 26. Three exposures of 30 min each were obtained on the first field, using the 300B grating centred at 5800A. Observations covered a wavelength range of 3600–8000Å with a spectral resolution of 9Å FWHM. Unfortunately, our second allocation could not be observed on the same night, although it had been scheduled, due to a field rotation problem on the second field plate. The second 2dF field configuration was observed with AAOmega on 2006 January 20 as part of the AAOmega Science Verification program. Four separate 20 min exposures were taken with the 580V and 385R volume-phase holographic gratings in the blue and red arms respectively. These yielded spectra spanning a broader wavelength range of 3700–8800Å with a resolution of in separate (but overlapping) blue and red halves.
2dF data were calibrated using the standard pipeline reduction package 2dFDR; a new upgraded version of 2dFDR, for use with AAOmega, was used for the 2006 January observation. Optical redshifts were determined for each object using the RUNZ software. Fits to templates containing typical spectral features were visualized: in some cases, the result of automated fitting was clearly incorrect, usually because of residual sky lines, and in such cases we forced the fit to emission line or absorption features that we considered to be real. Approximately of observed objects in our list were assigned a reliable galaxy redshift; were deemed to be stars and the remaining objects were considered to have unreliable redshift estimates.
We have supplemented our measured redshifts with those from the 6dF Galaxy Redshift (6dFGS) survey (Jones et al., 2004, 2005) and redshifts from the previous 2dF observation of the Horologium-Reticulum super-cluster, giving a total of 664 galaxy redshifts, 92 stellar redshifts, and 85 unreliable redshifts. The remaining 193 objects of the original target list of 1033 objects were not allocated to a fibre in either of the 2dF, AAOmega or 6dF observations. Our completeness, over the 2∘ field is for .
3.2 The galaxy distribution in the vicinity of the radio source
The redshift distribution of the galaxies with reliable redshifts over the range - 0.10 is shown in Fig. 8. The host galaxy, which has a measured redshift of , lies in a relatively small concentration of galaxies that are distributed in the range 0.060–0.066 in redshift space. A much larger clustering of galaxies is observed at higher redshifts and in the range - 0.084. The sky distribution of galaxies in the two concentrations is shown in Fig. 9. The contours in the plot show the location of the radio galaxy and the open circles denote the positions of known galaxy clusters within the field: these are S0345, A3111, A3112 and APMCC 369 and their redshifts are , 0.078, 0.075 and 0.075 respectively (Fleenor et al., 2006). Filled circles mark the locations of galaxies that are within of the host redshift (all the galaxies in the redshift space concentration containing the host); small crosses mark the sky positions of galaxies in the larger concentration in the higher redshift range. In both redshift ranges there appears to be a deficit of galaxies to the NE side of the radio source.
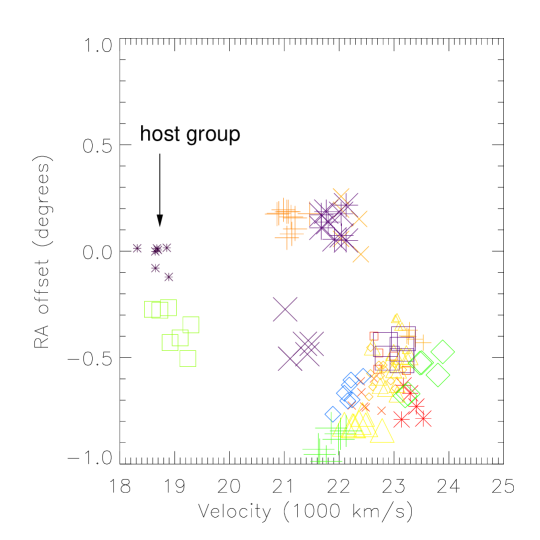
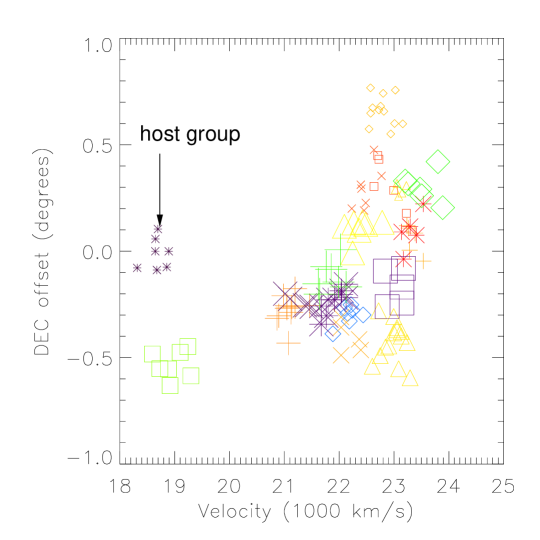
In order to identify galaxy concentrations, including any that might be associated with the host, ESO 248-G10, we applied the Huchra & Geller (1982) friends-of-friends group finding algorithm to our galaxy redshift dataset. In this technique, association is determined by the projected spatial and velocity separations between individual galaxies. In particular, a galaxy is a friend of another galaxy if it is within a limiting projected distance of that galaxy, and if the magnitude of the velocity difference between the two galaxies is less than . Large values of and result in most of the galaxies included into large associations comprising multiple groups strung out in velocity space. Very small values result in the identification of tight groups and sub-groups with most galaxies excluded from the associations. We explored a range of parameters, systematically reducing the parameter space from Mpc and km s-1 until the identified groups appeared as compact separate features in plots of R.A. versus declination, R.A. versus velocity, and declination versus velocity. The chosen values, Mpc and km s-1, resulted in the identification of the galaxy concentrations shown in Fig. 10. For clarity, isolated galaxies and groups with less than 5 members are not plotted in this figure. The host of the radio source is in a concentration with seven identified members. Two of the members appear close together in SuperCOSMOS optical images of the field, and there is a third galaxy, of unknown redshift, also located within 10 arcseconds of one of these on the R-band image. A second concentration, also consisting of seven identified members in our redshift database, is located about to the SW of the concentration around the host and at a similar redshift. All other concentrations identified by our friends-of-friends algorithm are offset from these two in velocity space by km s-1. It is interesting to note that all the identified galaxy concentrations are located towards the SW side of the 2∘ field, only isolated galaxies occupy the sky region to the NE.
The host galaxy, with apparent magnitude , appears to lie close to the centre of the associated concentration on the sky. The host galaxy is the brightest member of this concentration, the second brightest galaxy has a magnitude and the other members are fainter than . The concentration is distributed over a projected linear extent of about 1 Mpc on the sky, indicating that this might be a loose group. We measure a velocity dispersion of 196 km s-1 for the galaxies identified with this concentration and also note that the host lies close to the centre of the distribution in velocity space. The concentration to the SW is distributed over a larger sky area and has a larger velocity dispersion, km s-1, and has a mean velocity that is 290 km s-1 higher than that of the concentration around the host. We have examined the ROSAT All Sky Survey archival data at the location of the 2∘ field and do not find any X-ray emission associated with the host grouping or with the neighbouring grouping to the SW. However, there is low surface brightness extended emission coincident with the position of the distant Abell cluster S0345.
We have computed the 3-D spatial distribution of galaxy number density in the vicinity of the giant radio galaxy. In this anaylsis we included all galaxies within a box of dimensions 6 Mpc 6 Mpc 25 Mpc, which included the two concentrations of galaxies in the redshift range 0.060–0.066. Galaxies within in R.A. and declination and with redshift offsets within of the host galaxy were included in the box. We neglected peculiar velocities and assigned distances along the line of sight based on galaxy redshifts. In order to compute the galaxy over-density, we smoothed the data using a top-hat function with smoothing radius 1.25 Mpc. At this smoothing scale, the mean number density of galaxies is 0.3 and the rms number density is 2.2. Figure 11 shows the fractional over-densities () in a sky plane at the redshift of the host. The fractional over-density at the location of the host is 12.4. The peak fractional over-density within the cube is 15.8 and is at an offset position, with respect to the host galaxy, of 1.7 in R.A., 2.5 in declination and 3.8 Mpc along the line of sight: this position is within the location of the galaxy concentration to the SW. Fractional over-density values in the sky plane containing the peak is also shown as a separate panel in Fig. 11. All pixel locations with exceeding 6 within the cube are either associated with the host group or with the SW group.
The jets in MRC B0319454 make an angle of 65∘ to the line of sight with the NE jet pointed away from us. We have examined the fractional over-density values in the box, with smoothing radius 1.25 Mpc, along the inferred axis of the giant radio source. is fairly constant over the region of the NE lobe, and the value of somewhat exceeds 10. The SW lobe is located outside the extent of the concentration with which the host galaxy is associated, and obviously lies in a region of significantly lower galaxy number density: the galaxy overdensity within the cube decreases along the path length of the SW jet and has values as low as in the vicinity of the SW hot spot. If the galaxies are a tracer of gas, the local galaxy distribution constitutes evidence for an asymmetry in the gas density on the two sides of the host; additionally, the distribution is evidence for a density gradient in the ambient medium of the radio galaxy, between the radio core and the SW hot spot.
We have also computed the gravitational field in the vicinity of the radio galaxy following the method described by Subrahmanyan et al. (2008). Again, peculiar galaxy velocities have been ignored in this computation and distances to galaxies along the line of sight are based on redshift values only. First, we estimated the total mass in the cube as the product of the box volume, , and mean matter density in the Universe, . Assuming that the galaxies trace this matter, an average mass, was assigned to each galaxy, where is the total number of galaxies in the cube. This resulted in a mass of associated with each galaxy. The acceleration vector at any location within the cube was then computed by summing the contribution from each point mass. Nearby galaxies were excluded from the sum, so that the computed gravitational field is that due to surrounding large-scale galaxy structures, and not individual objects. Galaxies outside of the cube were also ignored. The resultant acceleration vector at the location of the host has components: m s-2, m s-2, and m s-2. The magnitude of this acceleration vector is m s-2 and the component on the sky plane is directed NW at a P.A of 68∘. Assuming the age of the Universe to be Gyr, the acceleration corresponds to a velocity of km s-1. Within the extent of the group, the magnitude of the gravitational acceleration increases with distance from the host and takes on values about a factor of two greater than that at the location of the host galaxy; outside the group the acceleration declines with distance from the group. Within a radius of about 1 Mpc of the host galaxy, the acceleration appears to be dominated by the mass associated with the group of which the host is a member. At the location of the SW lobe the vector components are much smaller: m s-2, m s-2, and m s-2; this corresponds to a velocity of km s-1 and is roughly directed towards the concentration associated with the host galaxy. At the location of the SW hot spot and lobe, the gravity is not dominated by the second galaxy concentration to the SW.
3.3 The large-scale structure in the neighbourhood of the radio source
We have used archival data from the 6dFGS to infer the distribution of galaxies in the vicinity of MRC B0319454 on larger scales. We computed the 3-D spatial distribution of galaxy number density using 6dF galaxies within a cube of side 85 Mpc centred at the host. A total of 860 galaxies within in R.A. and declination and within of the redshift of the host galaxy were included in this analysis. In order to compute the galaxy over-density, we have smoothed the data using a top-hat function with radius 6 Mpc. At this smoothing scale, the mean number density of galaxies in the cube is 1.2 and the rms is 1.5. Figure 12 shows the fractional over-densities () in the sky plane at the redshift of the host galaxy. At the location of the host, the fractional over-density is 3.9 with this smoothing scale. This plot shows that the host appears to be embedded within a large-scale galaxy filament that is oriented in a NNE - SSW direction. The filament extends more than 60 Mpc in our plot and has a projected width of approximately 15 Mpc, which is the width between points with fractional overdensity of two at this smoothing scale. Fractional over-density values in front of and behind the host galaxy reveal that the filament has an apparent depth of only 8 Mpc along the line of sight. However, the real physical size, in redshift space, is likely to be larger than this because of the Kaiser effect in this filament that has a low fractional overdensity: there may be an apparent compression in the distribution of measured velocities due to the infall, in comoving space, of galaxies towards the filament centre along the line of sight (Kaiser, 1987). In addition, the filament is observed to bend away from us in the northern parts of the cube and, conversely, bend and extend towards us in the southern parts. Within the galaxy filament, the fractional over-density takes on values up to about 9 with this smoothing scale. The host galaxy is offset from the centre of the filament, in redshift space, by approximately 1.5 Mpc towards us. The total extent of the radio source—about 1.9/sin(65∘) Mpc = 2.1 Mpc—is much smaller than the width of this large-scale filament of galaxies, and the entire radio source, including the galaxy concentration associated with the host galaxy, are embedded within and located in the central parts of the filament. As projected on the sky, the radio jets are roughly in a direction parallel to the large-scale filament; however, the inclination of the radio axis to the line of sight makes the SW lobe somewhat more distant from the axis of the large-scale filament.
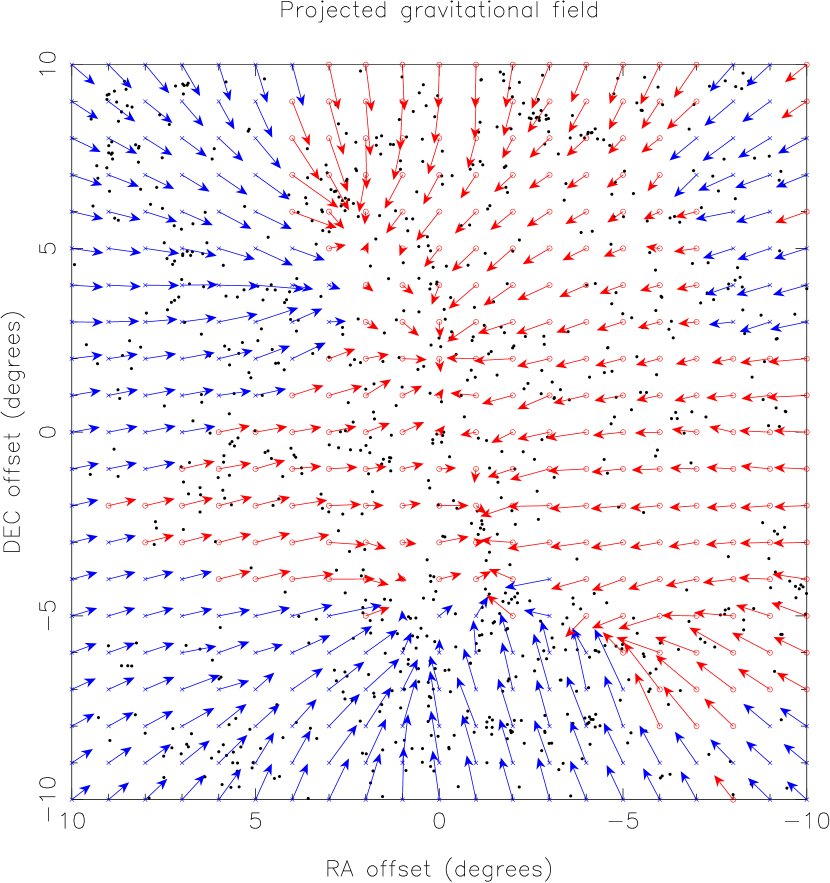
Using an identical technique to that described in the previous section, we have computed the gravitational field resulting from the large-scale structure using the 6dF survey galaxies in the 85 Mpc side cube. The average mass assigned to each galaxy in this cube was . In this analysis galaxies within 4.0 Mpc (almost 1 degree) of the location at which any acceleration vector was computed were ignored. Therefore, the resulting acceleration vector field is that due to the large-scale structure and not influenced by local galaxies or concentrations. The resulting gravitational field, computed on the sky plane at the redshift of the host galaxy, is displayed in Fig. 13; the vector lengths represent the component on the sky plane. The vector components at the location of the host are m s-2, m s-2, and m s-2. The magnitude of the acceleration is m s-2, most of which is directed along the line of sight away from us, as would be expected from the inference made above that the host galaxy lies in front of the axis of the filament. The corresponding velocity is km s-1 and on the sky plane the acceleration is directed towards P.A. of . The relatively small acceleration vector at the location of the radio source is consistent with the finding that the host galaxy is located embedded within the filament and not in the peripheral regions.
4 Evolutionary history of the giant radio galaxy MRC B0319454
The NE lobe in MRC B0319454 is aligned along the radio axis, whereas the SW lobe appears to be extended in a direction perpendicular to the source axis. The contrasting shapes and orientations taken by the two lobes are indicative of two very different flow histories. The total intensity structure in the NE lobe is suggestive of a model in which the jet axis remains fairly steady over most of its length, but has significant jitter at the end. The broad peak at the northern end of the lobe was probably the site of past hot spots, and the chain of hot spots along the other eastern rim, which protrude past the end of the lobe, the sites of current hot spots. Strong and directed backflow is indicated along the source axis and towards the core, which continues beyond the core. The backflowing cocoon material appears to bend away from the source axis and towards NW, filling and inflating a relatively relaxed and asymmetric bridge in the vicinity of the core.
The gradual steepening of the spectral index distribution along the length of the NE lobe suggests there are significant age gradients along the lobe axis: the radio spectrum is steeper in the vicinity of the radio core where the aged electron population has had more time to lose energy via synchrotron emission. If the depolarization (see Sect. 2.3) is a result of entrainment, which is higher in aged cocoon material, then the DR distribution supports this view.
The radio structure in the SW lobe is suggestive of a different flow history. There is a large emission gap between the SW lobe and the radio core, and it appears that the movement of post-shocked plasma is to the NW and not along the source axis. Alternative models in which the plume-like feature to the NW trace the path of past jet termination points due to, for example, jet precession, or models invoking movement of the host galaxy with respect to the ambient IGM in which the jet material is deposited are unlikely because they would be expected to manifest as symmetric or inversion symmetric lobe distortions on the two sides.
Enhancements in fractional polarization as well as an orientation of the B-field parallel to boundaries may be interpretated as arising from a compression of a magetized plasma, with a tangled field, at locations where the flow terminates on ram-pressure interaction with ambient thermal plasma. The B-field orientation is transverse to the source axis in the bright SW hot spot, as might be expected from the interaction between the jets and ambient gas at the termination shock. The magnetic field lines generally follow the total intensity contours along the boundaries of the SW lobe indicating that the lobes are not relaxed but are compressed at the boundaries where the expansion is ram pressure limited. Away from the hot spot and in the central regions of the SW lobe the B-field is oriented along NW-SE indicative of a flow of the post hot spot material towards NW. The enhanced fractional polarization and circumferential B-field in the regions of the SW lobe just before the extension towards NW, manifesting in the intermediate peak in the slice profile in Fig. 4, suggest that the flow is discontinuous across the SW lobe and that the extension towards NW might have a separate origin.
A model that might be considered is one in which the post hot spot material inflates a lobe at the location of the hot spot, which subsequently bends by to be directed along the line of sight, and then bends once again into the plane of the sky and towards NW to form the extension. In this picture, we would be observing new plasma that has freshly been accelerated at the hot spot, and old plasma, which resides behind or in front of the new plasma, that in projection on the sky, appear to form one continuous structure oriented NW. An argument against such a model is that the total intensity image does not show an enhancement prior to the extension towards NW. Also, it is difficult to explain why the lobe should suddenly bend in this way. One possibility, is that the backflow is deflected by the thermal gaseous halo associated with the galaxy group of which the host is a member, in the same way that backflows are deflected by large angles when they encounter galaxy halos (Kraft et al., 2005).
The total radio spectrum for the SW lobe is straight over the frequency range 1378-4850 MHz. It flattens at 843 MHz, but as noted earlier, this is probably because this observation missed some of the flux density. Values of the two point spectral index, , over the SW lobe take on values over the bulk of the emission and steepen to in the lobe extension to the NW. We assume that the observed spectral index of over the relatively higher surface brightness parts of the SW lobe represents the injection spectrum, and infer that there is no break, over the frequency range 843-4850 MHz, in the spectrum of the radiating electrons that populate the head and bulk of the SW lobe. Therefore, any steepening in the spectrum, as a result of radiative aging of the electron population, must occur at frequencies MHz. The SW lobe has a minimum energy magnetic field strength nT. The equivalent magnetic field strength of the cosmic microwave background at the redshift of the source is nT; therefore, particle aging is dominated by inverse Compton losses due to the microwave background radiation and not synchrotron radiation. This is typically so for giant radio sources, which have large expanded lobes and low equipartition magnetic fields (Ishwara-Chandra & Saikia, 1999).
Breaks in the emission spectrum due to both synchrotron and inverse-Compton losses are expected to occur at a frequency
| (1) |
where t (in Myr) is the spectral age or time since acceleration. We estimate a spectral age yr for the bulk of the SW lobe. The steeper two-point spectral index, with , in the extension to the SW lobe suggests an aged plasma. A plausible model for this extension is that if the injection spectrum had an emission spectral index , the population might have aged over a time exceeding yr while experiencing continuous injection of reaccelerated electrons—resulting in a spectral break at frequencies MHz—then undergoing passive aging over a period of at most yr.
5 Processes driving the lobe evolution
There are a number of physical models that can relate the observed extended emission structure of the radio source and the ambient environment. The environmental influence may be in the form of the gravitational field of the large-scale distribution of matter, and the gas associated with the large-scale structure. We assume here that the galaxies trace the mass as well as the gas. In the following sub-sections, we consider some models that could potentially be relevant to the evolution of the radio structure. We examine their relevance to this case study, in an attempt to shed light on the physical processes leading to the formation of the asymmetries in MRC B0319454.
5.1 Buoyant backflows
The morphology of the SW lobe is plume-like, directed NW and moving away from the radio axis. We model this lobe as a backflow from the hot spot that is initially directed towards the core, but is deflected off the source axis and towards the NW because of buoyancy. The buoyant forces are a result of a gravitational field whose direction is transverse to the source axis. We have shown previously that the gravitational field on local scales is largely directed towards the host galaxy group and not NW-SE as we envisage here. Nevertheless, the direction of the gravitational acceleration could plausibly be transverse to the jet axis if the separation (in line of sight distance) between the host and SW groups is closer than that inferred by attributing redshifts to distances. As noted in Sect. 3.2, the velocity separation between the two galaxy concentrations is 290 km s-1. However, peculiar motions could contribute significantly to this velocity difference, placing them closer in real space than one might infer from the redshifts alone. In this case, the gravitational field in the vicinity of the SW lobe would be dominated by both the host and SW galaxy groups, and we would expect the gravitational acceleration vector to be directed between these two mass concentrations, and roughly SE-NW.
In the analysis below we assume that hydrostatic equilibrium defines the pressure and density distributions; heating and sweeping up of the ambient gas by the expanding radio lobe is neglected. A possible in-fall of the radio source and local environment towards the centre of the large-scale filament is also ignored since peculiar velocities are unknown. We use the following notation: and are the mass densities of the jet backflow and external medium respectively, and are the pressures in the lobe backflow and external medium respectively, is the velocity of the backflow, is the radius of curvature in the backflow, and is the gravitational field which causes an hydrostatic pressure gradient in the ambient gas. We define a coordinate system such that the flow is in the --plane, with the propagation of the jet hot spot along the -axis, as visualized in Fig. 14. The velocity of the hot spot, , and velocity of the backflow, , are both in the frame of the host galaxy.
Following Worrall et al. (1995) (and Schatzmann (1978) in more detail), the dynamics of a buoyant jet backflow in such a medium are descirbed by Euler’s equation
| (2) |
where the gravitational field, the external density and pressure of the hydrostatic are related by:
| (3) |
We assume that at each location along the backflowing lobe, the lobe plasma is in pressure equilibrium with the external gas. Hence, the momentum equations for the backflow become:
| (4) |
It therefore follows that the velocity, , of the backflow and the radius of curvature, , are related by
| (5) |
We therefore have:
| (6) |
for .
Let us now consider the various parameters, which enter into equation (6), namely the velocity of the backflow, the density of the external medium, and the density of the lobe material. We have already estimated in the vicinity of the radio source (see Sect. 3.2); based on the projected geometry of the SW lobe, we estimate the backflowing SW lobe plasma to have a radius of curvature of approximately 250 kpc.
Recent estimates of the backflow velocity in giant radio galaxies have indicated 0.03 - 0.04 (e.g. Lara et al., 2000; Jamrozy et al., 2005). These estimates are based on spectral aging techniques and rely on the argument, based on source morphologies, that the mean backflow velocity is equal to the mean head advance velocity (i.e. ). In Sect. 4, we estimated that the time elapsed since the particles in the SW lobe extension were last accelerated is yr. These particles are separated from the current location of the jet termination by a projected distance of 630 kpc. Therefore, we estimate a separation velocity (the lobe velocity with respect to the hot spot) of . If we also assume equal advance and backflow velocities, then ; the upper limit is similar to the values derived for other giant radio sources.
We estimate the external gas density using our knowledge of the 3-D galaxy distribution. Our analysis suggests that the source MRC B0319454 does not reside in an extremely over-dense environment (e.g., a galaxy cluster); instead, we have shown that the host galaxy is a member of a loose group that is embedded within a large-scale galaxy filament. The large-scale structure represents only moderate over-densities. Therefore, in terms of the mean baryon density, , we expect that in the galaxy filament environment of the SW lobe.
In order to estimate the density of the lobe material in MRC B0319454, we consider two possibilities: (1) that the lobe consists purely of waste jet material, and (2) that in addition to the waste jet material, the lobe is contaminated by thermal IGM, which has been entrained into the cocoon during the evolution of the radio source. In estimating the density of the non-thermal waste jet material, we assume an electron-proton plasma with a power-law distribution in energy and index . The lower and upper Lorentz factor cutoffs to this distribution are and respectively. In this case the internal mass density of the lobe plasma is related to the energy density, , in the synchrotron emitting particles by
| (7) |
where we have assumed that . We compute this expression, in conjunction with minimum energy assumptions, using minimum Lorentz factors of and , since values within this range have been inferred for jets and lobes previously (see e.g. Blundell et al., 2006; Worrall & Birkinshaw, 2006). For the particle energy density calculation, we adopt a maximum Lorentz factor of . For example, , gives J m-3 and kg m-3, while , results in J m-3 and kg m-3. The implied lobe densities, expressed as a fraction of the external gas density, , are in the range .
For comparison, an electron-positron jet with the same values would result in lobe densities that are a factor lower than those above and a density ratio in the range . For each plasma type, we note that the lobe densities and corresponding -values are lower limits since they do not account for possible entrainment of the relatively dense IGM.
Any entrainment of IGM gas into the cocoon of the radio galaxy would pollute the lobe cavity and increase its density. This quantity, however, would remain less than that in the IGM so that . The actual amount of entrainment might depend on the source history, the power of the jets and the environment in which the source is situated. We have examined the polarization properties over the bulk of the SW lobe, in an attempt to shed light on their thermal content, but find that these do not provide any useful limits on . Rather, the measured polarization indicates that the Faraday depth over the source is radian. This implies a thermal electron density of m-3 for the SW lobe, which has an estimated depth of 430 kpc and a minimum energy magnetic field 0.1 nT. If we allow for the presence of protons, the implied mass density is kg m-3. At the upper limit, this implies for the considered range of values, and therefore, is a poor constraint.
The inner sources in restarting or double-double radio galaxies are a useful probe of the plasma in which they are enveloped. Kaiser et al. (2000) examined a sample of double-double restarting radio sources (with sizes Mpc and in a IGM environment) and found to be consistent with the observed properties of the inner doubles. More recently, Safouris et al. (2008) showed that entrainment has significantly increased the densities in the outer lobes of the giant double-double radio galaxy PKS B1545321. They find a similar non-thermal density in the lobes to what we have inferred for MRC B0319454; however, they also find that the total lobe densities are much greater, and at least a few percent of the IGM density, because of contaminating thermal gas. We therefore consider that could be as high as 0.01 if MRC B0319454 has entrained IGM gas during its evolution. In such a case, it is interesting to note that if the jets are electron-positron in composition, then the lobe density would be completely dominated by the entrained gas.
For buoyancy to account for the movement of the SW lobe that has a density , the gravitational acceleration is required to be
| (8) |
for our adopted values of and . Thus for a lobe with , it is necessary that m s-2. For a lobe with no entrainment and , the required acceleration is m s-2.
In Fig. 15 we have plotted the value of the gravitational field that is necessary to deflect the lobe backflow for a range of values (solid lines). Estimates of the magnitude of the gravitational field in the vicinity of the SW radio lobe based on the local and large-scale galaxy distributions are displayed with dotted lines. We also plot as a function of external gas density, the field that is required to buoyantly move the lobe if there has been no entrainment and (dashed line) or 103 (dot-dashed line). In this latter calculation, we have expressed the external density as a fraction of the mean baryon density of the Universe, , which is the baryon density parameter times the critical density .
Figure 15 shows that if the amount of entrained thermal gas in the cocoon is negligible, and therefore the cocoon is relatively light (), the gravitational field required to deflect the lobe via buoyancy encompasses the range of what we estimate at the SW lobe ( - m s-2), due to the surrounding mass distribution. From the above analysis, we conclude that the off-axis evolution in the SW lobe may result from buoyancy forces in the backflow, if there is minimal entrainment. Alternatively, this may also occur if the entrained gas is confined to a narrow boundary layer along the edge of the lobe. The external densities implied by the buoyancy model are in good agreement with those expected in the galaxy filament environment of the giant radio source. They represent moderate over-densities in the gas distribution and are therefore within those expected for the warm-hot phase of the IGM (e.g. Bregman, 2007). The external pressures signified by the model also hint at an ambient gas with warm-hot temperatures. Pressure equilibrium between the lowest surface brightness regions of the SW lobe and the external gas implies an IGM pressure of N m-2 in the vicinity of the flow. For the considered range of external densities, this equates to an IGM temperature in the range K. At the lower end (corresponding to higher external densities), the gas temperature is well matched to that of the WHIM (i.e. K). Therefore, a buoyant movement of the lobe plasma would support our initial hypothesis that the lobes of MRC B0319454 are interacting with the warm-hot gas phase of the IGM.
The above interpretation is an appealing one since it signifies evidence of an interaction between the radio source and WHIM. Nevertheless, we consider below further mechanisms which may drive the off-axis movement of the SW lobe plasma.
5.2 Buoyant bubbles
We next consider a variant of the above model, where the SW lobe extension is treated as a bubble rather than a back flow. The synchrotron bubble is embedded within a thermal gaseous medium and rises against the gravity vector. In this case, the dynamics are determined by the balance between the buoyant and drag forces which act upon the bubble in the IGM (e.g. Gull & Northover, 1973; Brüggen & Kaiser, 2001). Equating these forces implies a terminal velocity for the bubble of
| (9) |
where is the volume of the rising bubble, is the area of its cross-section, and is the drag coefficient. We approximate the displaced SW lobe as a sphere with kpc and take (Churazov et al., 2001). Adopting a gravitational field m s-2, as estimated at the location of the host galaxy in the large-scale galaxy filament, we calculate a terminal velocity km s-1 for the lobe. At this speed, it would take more than yr for the lobe plasma to move the observed 200 kpc distance off-axis. This time-scale is grossly longer than the estimated spectral ages ( yr) for different components of the source —including the extension at the NW end of the SW lobe —and signifies that buoyant forces are unlikely to be responsible for the movement of the lobe if it is a relict bubble. More generally, this analysis suggests that buoyant forces acting on bubbles of synchrotron lobe plasma in the IGM are unimportant unless the bubbles have significantly larger radii and are in gravitational fields that are at least an order in magnitude or more greater than what we have estimated for MRC B0319454; such gravitational fields are unlikely outside rich clusters of galaxies.
5.3 Density gradients in the IGM
The most striking feature in the morphology of the giant radio source MRC B0319454 is the side-to-side asymmetry in the lobe extents from the core. The NE lobe extends over a deprojected distance of 640 kpc from the core, while the end of SW lobe is at a much greater distance of 1430 kpc. Light-travel time effects are one possible mechanism for causing such asymmetries; however, as noted in Saripalli et al. (1994), these effects would be small for the range of velocities that the ends of the lobes might take. A better explanation relates to corresponding asymmetries in the IGM. In this section, we examine the ambient gas distribution for such asymmetries. Again, it is assumed that the galaxies trace the matter.
The galaxy distribution within the host galaxy group suggests that there might be a gas density gradient about the host. Specifically, the host galaxy appears to lie at the center of the group. The most luminous members of the group are located to the north of the host, with the exception of the second brightest member, which resides west of the host. Since low luminosity X-ray groups show evidence for irregular distributions in the X-ray emitting intra-group gas, with the emission preferentially biased to the luminous galaxies in the group (Mulchaey, 2000), we might expect there to be less thermal gas south of the radio core in this group.
Based on the asymmetry in the lobe extents from the core, we infer that the ends of the SW and NE lobes have advanced with a velocity ratio of 2:1. Assuming that the advance of the leading lobe edge is ram pressure limited by the density of the external gas, we expect that the external density is 4 times larger on the NE side of the core compared to that on the SW side. In Sect. 3.2, we noted that there was evidence in the surrounding galaxy distribution for a density gradient in the IGM along the radio jet axis of the source (see also Fig. 11). At a smoothing scale of 1.25 Mpc, the fractional over-density in the galaxy counts is about 10 in the region of the NE lobe and decreases along the axis of the southern jet to approximately 2 in the vicinity of the SW hot spot. Assuming that the galaxies trace the gas, this gradient in the fractional density contrast, together with the derived mean galaxy number density of 0.3, is consistent with the side-to-side length asymmetry in this source. Again, this suggests that the length asymmetry in MRC B0319454 results from density gradients in the IGM environment of the source. Also, the consistency between the derived ratio of galaxy densities on each side of the core with the asymmetry in the lobe extents from the core, supports our hypothesis that the galaxies are a reliable tracer of the gas on large scales.
Given that density gradients in the IGM can account for the side-to-side length asymmetry in MRC B0319454, it is worth considering if these are also responsible for the observed asymmetry in the lobe shapes on the two sides of the core. We have shown previously that the NE lobe appears to be embedded within the loose group of galaxies of which the host is a member. The fractional over-density is relatively high () in the region of the NE lobe. Further examination of the fractional over-density in the vicinity of the radio source, at a smoothing scale of 1.25 Mpc, shows no evidence for density gradients within the region of the group occupied by the NE lobe. Slice profiles along the length of the NE lobe, along the line of sight through the NE lobe, and transverse to the axis of the NE lobe, show that the fractional overdensities are a constant and a little over 10 in each of these directions. The fractional over-density values do decline at the periphery of the group. However, the NE lobe appears to be located close to the centre of the galaxy density distribution associated with the group. The uniform density in the region occupied by the NE lobe is consistent with the axially symmetric backflow of the hot spot plasma along the radio axis in this lobe. The accompanying high fractional over-density values in the region of the galaxy group, along with the radio morphology of the source, suggest that the relatively denser intra-group medium confines the NE lobe and stalls any expansion losses. This has resulted in a relatively bright and luminous NE lobe.
A similar analysis of the fractional over-density values in the region of the SW lobe suggests a different scenario. As mentioned already, there is a decline in the fractional over-density along the jet axis from the radio core to the lobe end. In addition, we find that there is a gradient in the over-density along a line of sight through the SW lobe: the fractional over-density is about a factor of 2 larger behind the lobe compared to that in front, and at the location of the lobe. Also, as might be expected from the radio morphology, there exists a gradient in the over-density that is transverse to the radio jet axis and oriented SE to NW. Fractional over-density values along this direction show that there is more galaxy density on the SE side of the source compared to the NW side. This gradient may be viewed as arising from the combined effects of the host group and neighbouring galaxy concentration. The numbers we derive suggest that the external densities are a factor of 2 or more higher on the SE side of the lobe relative to the NW side.
Such a density gradient may have caused the asymmetric expansion of the SW lobe plasma in this direction. The plasma on the NW side of the radio jet axis extends about three times further from the jet axis, than the plasma on the SE side. The plasma may be expanding on the two sides with a velocity ratio of 3:1. If this side-ways expansion is ram pressure limited, then we expect the external density on the SE side of the axis to be a factor 9 larger than that on the NW side. Our analysis of the fractional density contrast indicates that the gas densities on the two sides of the SW lobe are in the ratio 2:1 when examined with a smoothing scale 1.25 Mpc; but these could be larger on smaller smoothing scales. Although the density gradient is in the direction expected for this model, the local galaxy number density ( at this smoothing scale) is insufficient to make a useful estimate of density variations on the 0.5 Mpc length scale, which is necessary to examine whether the magnitude of the density gradient is sufficient to account for the transverse expansion.
In particular, the decreased ambient density to the NW of the SW lobe, may have caused the synchrotron plasma to break confinement along this edge. In this case, the low surface brightness extension and its relatively steep spectral index distribution, could be attributed to expansion losses, provided that the electron energy spectrum is curved, or has a high frequency break that has shifted to the observing range.
Finally, we note that the extent of the NE lobe from the core is similar to the extent of the detected SW jet from the core. The gas associated with the group may be distributed to equal extents about the host (although as noted earlier, we expect more gas to the north based on the locations of the most luminous galaxies). The gaseous envelope, which likely confines the NE lobe, might also be responsible for the confinement and detectability of the SW jet in this region.
To summarize, the qualitative correspondance between the density distribution and the radio source morphology is suggestive of a physical origin for the structure and asymmetries in the interaction between the radio jet plasma and ambient gas inhomogenieties: a likely mechanism is ram pressure limitation of the lobe advance and expansion by the gas density. In this picture, the asymmetries are caused by the locations and orientations of the radio lobes with respect to the gaseous media associated with the host galaxy group and the neighbouring galaxy concentration south of the host.
6 Conclusions
We have presented new high sensitivity radio images of the powerful radio galaxy MRC B0319454 together with observations of the surrounding large-scale structure. Using these we have sought to understand the influence of the ambient gas and gravity on the evolution of the jets and post hot spot plasma in this remarkable source. Our observations are qualitatively consistent with a model wherein the galaxies trace inhomogeneities in the intergalactic gas, and these in turn determine the evolution of the giant radio source. In this respect, our study has reached similar conclusions to those of Subrahmanyan et al. (2008), who also showed that asymmetries in the morphology of the giant relict source, MSH J05052835, may be governed by inhomogeneities in the ambient intergalactic gas distribution, whose distribution follows the large scale structure in galaxies. In particular, both studies have found a foreshortening of the lobes in the direction of greater galaxy density, and off-axis distortions in the direction of decreasing galaxy density.
In MRC B0319454, over-densities in the galaxy distribution are found north of the radio core. These are related to the loose galaxy group of which the host is a member. The advance of the NE jet and expansion of the corresponding lobe are ram-pressure limited by the intra-group medium of this galaxy concentration. Furthermore, there is less gas density to the south of the radio core, explaining the rapid advance of the SW jet and increased expansion losses in the post hot spot flow. A density gradient, perpendicular to the jet axis in the SW lobe, may also influence the asymmetric lobe expansion to the NW.
We further hypothesize that the SW backflow may be moving away from the source axis and NW due to buoyancy. We find that buoyant forces (due to a gravitational field transverse to the radio source axis) can deflect the backflow of the SW jet plasma, provided there has been minimal entrainment of ambient gas into the lobe. This leads to a model in which the medium external to the SW radio lobe has the same properties as those inferred for the WHIM component of the IGM.
Future deep imaging of the gas associated with the large-scale structure would help to further our interpretation. This work demonstrates the usefulness of giant radio galaxies as probes of the IGM through the relationship between source morphology and the ambient large-scale structure distribution.
7 Acknowledgments
The Australia Telescope Compact Array is part of the Australia Telescope, which is funded by the Commonwealth of Australia for operation as a National Facility managed by CSIRO. This research has made use of the NASA/IPAC Extragalactic Database, which is operated by the Jet Propulsion Laboratory, California Institute of Technology, under contract with the National Aeronautics and Space Administration. We thank the Anglo-Australian Observatory for data obtained with the 2dF during service time and the AAOmega instrument during the Science Verification program. We acknowledge the use of the RUNZ code written by Will J. Sutherland. We are grateful to Professor R. Ekers for useful discussions and comments on this manuscript. We thank the anonymous referee for helpful comments and suggestions.
References
- Begelman et al. (1984) Begelman M. C., Blandford R. D., Rees M. J., 1984, Reviews of Modern Physics, 56, 255
- Bîrzan et al. (2004) Bîrzan L., Rafferty D. A., McNamara B. R., Wise M. W., Nulsen P. E. J., 2004, ApJ, 607, 800
- Bliton et al. (1998) Bliton M., Rizza E., Burns J. O., Owen F. N., Ledlow M. J., 1998, MNRAS, 301, 609
- Blundell et al. (2006) Blundell K. M., Fabian A. C., Crawford C. S., Erlund M. C., Celotti A., 2006, ApJ, 644, L13
- Boehringer et al. (1993) Boehringer H., Voges W., Fabian A. C., Edge A. C., Neumann D. M., 1993, MNRAS, 264, L25
- Bregman (2007) Bregman J. N., 2007, ARA&A, 45, 221
- Brüggen & Kaiser (2001) Brüggen M., Kaiser C. R., 2001, MNRAS, 325, 676
- Bryant & Hunstead (2000) Bryant J. J., Hunstead R. W., 2000, ApJ, 545, 216
- Cen & Ostriker (1999) Cen R., Ostriker J. P., 1999, ApJ, 514, 1
- Cen & Ostriker (2006) Cen R., Ostriker J. P., 2006, ApJ, 650, 560
- Churazov et al. (2001) Churazov E., Brüggen M., Kaiser C. R., Böhringer H., Forman W., 2001, ApJ, 554, 261
- Davé et al. (2001) Davé R., Cen R., Ostriker J. P., Bryan G. L., Hernquist L., Katz N., Weinberg D. H., Norman M. L., O’Shea B., 2001, ApJ, 552, 473
- Douglass et al. (2008) Douglass E. M., Blanton E. L., Clarke T. E., Sarazin C. L., Wise M., 2008, ApJ, 673, 763
- Fleenor et al. (2005) Fleenor M. C., Rose J. A., Christiansen W. A., Hunstead R. W., Johnston-Hollitt M., Drinkwater M. J., Saunders W., 2005, AJ, 130, 957
- Fleenor et al. (2006) Fleenor M. C., Rose J. A., Christiansen W. A., Johnston-Hollitt M., Hunstead R. W., Drinkwater M. J., Saunders W., 2006, AJ, 131, 1280
- Gull & Northover (1973) Gull S. F., Northover K. J. E., 1973, Nature, 244, 80
- Hardcastle et al. (2007) Hardcastle M. J., Evans D. A., Croston J. H., 2007, MNRAS, 376, 1849
- Hardcastle et al. (2005) Hardcastle M. J., Sakelliou I., Worrall D. M., 2005, MNRAS, 359, 1007
- Haslam et al. (1982) Haslam C. G. T., Salter C. J., Stoffel H., Wilson W. E., 1982, A&AS, 47, 1
- Haverkorn et al. (2000) Haverkorn M., Katgert P., de Bruyn A. G., 2000, A&A, 356, L13
- Huchra & Geller (1982) Huchra J. P., Geller M. J., 1982, ApJ, 257, 423
- Ishwara-Chandra & Saikia (1999) Ishwara-Chandra C. H., Saikia D. J., 1999, MNRAS, 309, 100
- Jamrozy et al. (2004) Jamrozy M., Klein U., Machalski J., Mack K.-H., 2004, in Mújica R., Maiolino R., eds, Multiwavelength AGN Surveys Large-Scale Radio Structure in the Universe: Giant Radio Galaxies. p. 431
- Jamrozy et al. (2005) Jamrozy M., Machalski J., Mack K.-H., Klein U., 2005, A&A, 433, 467
- Jones et al. (2004) Jones D. H., Saunders W., Colless M., Read M. A., Parker Q. A., Watson F. G., Campbell L. A., Burkey D., Mauch T., The 6dFGS team 2004, MNRAS, 355, 747
- Jones et al. (2005) Jones D. H., Saunders W., Read M., Colless M., 2005, Publications of the Astronomical Society of Australia, 22, 277
- Jones (1989) Jones P. A., 1989, Proceedings of the Astronomical Society of Australia, 8, 81
- Kaiser et al. (2000) Kaiser C. R., Schoenmakers A. P., Röttgering H. J. A., 2000, MNRAS, 315, 381
- Kaiser (1987) Kaiser N., 1987, MNRAS, 227, 1
- Klamer et al. (2004) Klamer I., Subrahmanyan R., Hunstead R. W., 2004, MNRAS, 351, 101
- Kraft et al. (2005) Kraft R. P., Hardcastle M. J., Worrall D. M., Murray S. S., 2005, ApJ, 622, 149
- Lara et al. (2000) Lara L., Mack K.-H., Lacy M., Klein U., Cotton W. D., Feretti L., Giovannini G., Murgia M., 2000, A&A, 356, 63
- Ledlow & Owen (1996) Ledlow M. J., Owen F. N., 1996, AJ, 112, 9
- Lewis et al. (2002) Lewis I. J., Cannon R. D., Taylor K., Glazebrook K., Bailey J. A., Baldry I. K., Barton J. R., Bridges T. J., Dalton G. B. e., 2002, MNRAS, 333, 279
- McNamara et al. (2000) McNamara B. R., Wise M., Nulsen P. E. J., David L. P., Sarazin C. L., Bautz M., Markevitch M., Vikhlinin A., Forman W. R., Jones C., Harris D. E., 2000, ApJ, 534, L135
- Mills et al. (1960) Mills B. Y., Slee O. B., Hill E. R., 1960, Australian Journal of Physics, 13, 676
- Mulchaey (2000) Mulchaey J. S., 2000, ARA&A, 38, 289
- Nulsen et al. (2002) Nulsen P. E. J., David L. P., McNamara B. R., Jones C., Forman W. R., Wise M., 2002, ApJ, 568, 163
- Safouris et al. (2008) Safouris V., Subrahmanyan R., Bicknell G. V., Saripalli L., 2008, MNRAS, 385, 2117
- Saripalli et al. (1994) Saripalli L., Subrahmanyan R., Hunstead R. W., 1994, MNRAS, 269, 37
- Schatzmann (1978) Schatzmann M., 1978, Zeitschrift Angewandte Mathematik und Physik, 29, 608
- Scheuer (1974) Scheuer P. A. G., 1974, MNRAS, 166, 513
- Simard-Normandin & Kronberg (1980) Simard-Normandin M., Kronberg P. P., 1980, ApJ, 242, 74
- Slee (1995) Slee O. B., 1995, Australian Journal of Physics, 48, 143
- Subrahmanyan et al. (2008) Subrahmanyan R., Saripalli L., Safouris V., Hunstead R. W., 2008, ApJ, 677, 63
- Worrall & Birkinshaw (2006) Worrall D. M., Birkinshaw M., 2006, in Alloin D., ed., Physics of Active Galactic Nuclei at all Scales Vol. 693 of Lecture Notes in Physics, Berlin Springer Verlag, Multiwavelength Evidence of the Physical Processes in Radio Jets. p. 39
- Worrall et al. (1995) Worrall D. M., Birkinshaw M., Cameron R. A., 1995, ApJ, 449, 93
- Wright et al. (1994) Wright A. E., Griffith M. R., Burke B. F., Ekers R. D., 1994, ApJS, 91, 111
| Array | Frequencies | Date | Duration |
|---|---|---|---|
| (MHz) | (hr) | ||
| EW367 | 1378/2368 | 2003 Sep 02 | 12 |
| 750B | 1378/2368 | 2003 Sep 18 | 12 |
| EW352 | 1378/2368 | 2003 Oct 02 | 12 |
| 1.5D | 1378/2368 | 2003 Nov 16 | 12 |
| 1.5A | 1378/2368 | 2004 Apr 02 | 12 |
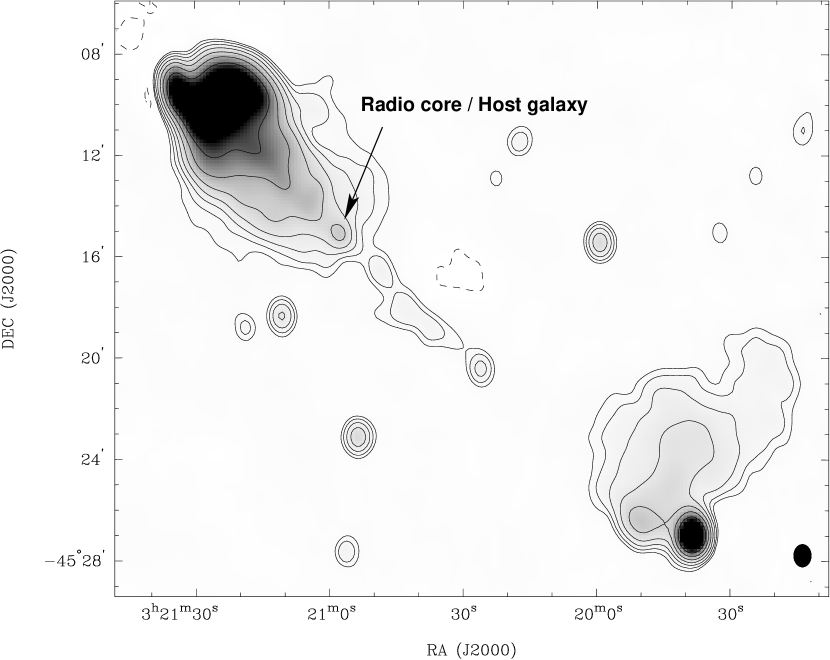
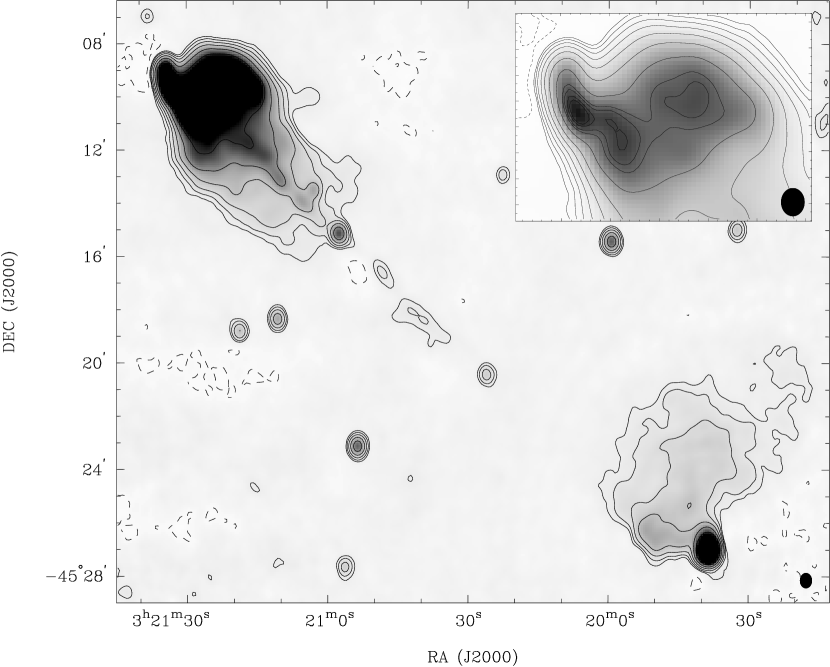
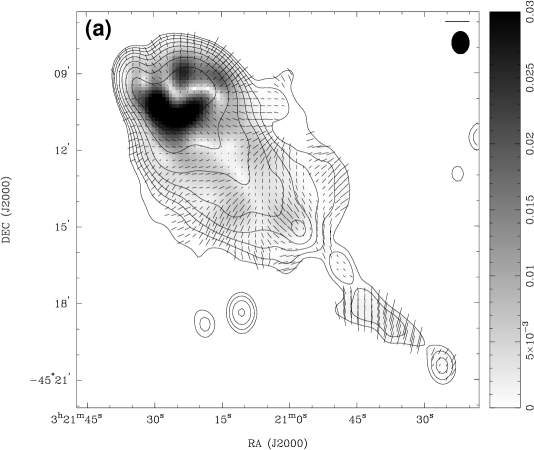
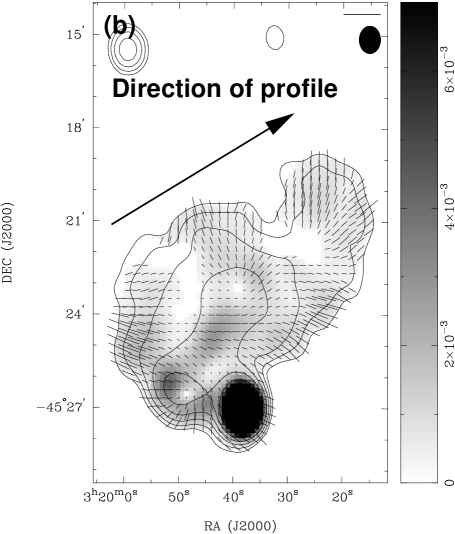
| Frequency (MHz) | Survey/ | N lobe | S lobe | Total | Reference |
|---|---|---|---|---|---|
| (MHz) | Telescope | (Jy) | (Jy) | (Jy) | |
| 80 | Culgoora | 22 | Slee (1995) | ||
| 85.5 | MSH | 19 | Mills et al. (1960) | ||
| 160 | Culgoora | 11.6 | Slee (1995) | ||
| 408 | 408 MHz | Haslam et al. (1982) | |||
| all-sky survey | |||||
| 843 | MOST | 4.64 | 0.71 | Saripalli et al. (1994) | |
| 1378 | ATCA | 3.16 | 0.70 | This paper | |
| 2368 | ATCA | 1.99 | 0.47 | This paper | |
| 4850 | PMN | 1.04 | 0.27 | 0.06 | Wright et al. (1994) |