Are red 2MASS QSOs young?
Abstract
We use photometric data from the Spitzer mission to explore the mid- and far-infrared properties of 10 red QSOs (, mag) selected by combining the 2MASS in the near-infrared with the SDSS at optical wavelengths. Optical and/or near-infrared spectra are available for 8/10 sources. Modeling the Spectral Energy Distribution (SED) from UV to far-infrared shows that moderate dust reddening () can explain the red optical and near-IR colours of the sources in the sample. There is also evidence that red QSOs have luminosity ratio higher than PG QSOs (97 per cent significance). This can be interpreted as a higher level of star-formation in these systems (measured by the luminosity) for a given AGN power (approximated by the luminosity). This is consistent with a picture where red QSOs represent an early phase of AGN evolution, when the supermassive black hole is enshrouded in dust and gas clouds, which will eventually be blown out (possibly by AGN driven outflows) and the system will appear as typical optically luminous QSO. There is also tentative evidence significant at the 96% level that red 2MASS QSOs are more often associated with radio emission than optically selected SDSS QSOs. This may indicate outflows, also consistent with the young AGN interpretation. We also estimate the space density of red QSOs relative to optically selected SDSS QSOs, taking into account the effect of dust extinction and the intrinsic luminosity of the sources. We estimate that the fraction of red QSOs in the overall population increases from 3% at mag to 12% at mag. This suggests that reddened QSOs become more important at the bright end of the Luminosity Function. If red QSOs are transition objects on the way to becoming typical optically luminous QSOs, the low fractions above suggest that these systems spent less than 12% of their lifetime at the “reddened” stage.
keywords:
Surveys – galaxies: active – galaxies: quasars: general – infrared: general1 Introduction
In the last few years an increasing body of evidence points to an intimate link between the formation of galaxies and the growth of the supermassive black holes (SBH) at their centres. For example, the accretion history of the Universe (Barger et al. 2005; Hasinger et al. 2005) looks strikingly similar to the evolution of the cosmic star-formation rate (e.g. Hopkins, 2004; Hopkins & Beacom, 2006). Additionally, most nearby spheroids contain a SBH (SBH; e.g. Magorrian et al., 1998), with a mass that scales with the stellar velocity dispersion of the host galaxy bulge (e.g Ferrarese & Merritt, 2000; Gebhardt et al., 2000), suggesting similar formation epochs and/or mechanisms.
Recent cosmological simulations account for the observations above by assuming that both the galaxy and the SBH form during galaxy interactions and mergers (e.g Kauffmann & Haehnelt, 2000, 2002; Di Matteo et al., 2003; Menci et al., 2004; Cattaneo et al., 2006). Such violent events are very efficient in driving gas to the nuclear regions, where it forms stars or it is consumed by the SBH. Because the nuclear regions of the interacting system are dusty, both processes above most likely take place within a cocoon of dust and gas clouds. Energetic considerations underline the significance of the energy released by the AGN in the process above, which can regulate the gas inflows (e.g Silk & Rees, 1998; Fabian, 1999; King, 2003). Simulations of major mergers indeed show that the feedback from the AGN can be particularly violent close to the final merging, leading to the blow out of the dust and gas clouds and the termination of both the star-formation and eventually the AGN activity (e.g. Di Matteo et al., 2005; Springel et al., 2005; Hopkins et al., 2006).
The key prediction of the picture above is that there should be an association between SBH accretion, starbursts and mergers. Although there are examples of such systems (e.g. Genzel et al., 1998; Cid Fernandes et al., 2001; Franceschini et al., 2003; Georgakakis et al., 2004; Alexander et al., 2005), they appear to be the exception rather than the rule. X-ray surveys, arguably the most efficient method for finding AGN, have shown that the majority of X-ray sources are hosted by red evolved galaxies (Nandra et al., 2007), with prominent bulges and little morphological evidence for ongoing interactions (Grogin et al., 2003; Pierce et al., 2007). This may suggest that X-ray wavelengths, because of their high sensitivity to AGN, select a large number of systems after the peak of their activity (i.e. final merging) and during the decline stage of the SBH accretion. In order to understand the interplay between SBH and galaxy formation one should study the properties of AGN hosts (e.g. star-formation rate, optical morphology) close to the peak of the activity, when the system appears as luminous QSO. Such studies however, are hampered by the enormous brightness of the QSO nuclei relative to the host galaxy. Nevertheless progress has been made in the last few years. Mid-Infrared spectroscopy with Spitzer reveals PAH features, i.e. evidence for star-formation, in about 30% of optically selected luminous QSOs (Schweitzer et al., 2006; Netzer et al., 2007). HST high resolution imaging and ground based observations with adaptive optics find that a fraction of the QSO population is hosted by either elliptical galaxies with fine structure indicative of past interactions (80%; Bennert et al., 2008), or galaxies with obvious signs of disturbance (30%; Guyon et al., 2006). The evidence above suggests that at least some QSOs are formed in major mergers accompanied by starburst events.
An important development in studies of the interplay between AGN and galaxies has been the identification of QSOs with optical and/or near-infrared (near-IR) colours much redder than those of typical UV/optically selected QSOs. Cutri et al. (2001) and Wilkes et al. (2002) for example, have found a previously undetected population of broad line AGN among sources with mag in the Two Micron All Sky Survey (2MASS). White et al. (2003) studied an -band magnitude limited ( mag) sample of radio sources and showed that the QSOs in that sample have redder colours, on average, than those selected at bluer optical filters. Glikman et al. (2004, 2007) demonstrated that selecting radio (1.4 GHz) sources in the region of the colour space and mag yields a 50 per cent success rate of discovering QSOs that are substantially redder than those found in optical surveys. Similar results were obtained more recently by Urrutia et al. (2008a) using a slightly modified colour wedge for selecting radio sources ( and mag). The optical/near-IR continua of the red QSO population identified in the studies above are consistent with moderate amounts of dust reddening ( White et al., 2003; Glikman et al., 2007; Urrutia et al., 2008a). An intrinsically flat UV/optical spectrum (e.g. Richards et al., 2003) or synchrotron emission with a high turnover frequency (Whiting et al., 2001) can also explain the red colours without invoking dust. It is unlikely however, that these alternative scenarios apply to the entire population of red QSOs. It is therefore proposed that this new population of dust reddened QSOs represent systems shortly before or during the blow out stage of AGN evolution, when the central source is still cocooned in dust and gas clouds. If true, reddened QSOs are intermediate between dusty starbursts and UV/optically luminous QSOs. Clues on the evolutionary stage of these systems can be obtained by studying the properties of their host galaxies. Deep optical imaging for example, has shown that the morphology of the red QSO hosts are in most cases disturbed, suggesting a higher fraction of ongoing interactions compared to typical UV/optically luminous QSOs (Hutchings et al., 2003, 2006; Urrutia et al., 2008b), consistent with the young AGN picture.
Another property of red QSOs that has not yet been addressed and is particularly relevant to their evolutionary stage is the level of star-formation rate in the host galaxy. In this paper we address this issue using Spitzer to constrain and to model the mid- and far-IR SEDs of a sample of red QSOs identified in the Two Micron All Sky Survey (2MASS). Under reasonable assumptions, the shape of the IR SED is a powerful diagnostic of the physical processes (star-formation vs AGN activity) responsible for heating the dust in extragalactic sources (e.g. Rowan-Robinson et al., 2008).
The fraction of red QSOs in the overall population is also an important parameter. In the scenario where these systems represent a stage of the AGN phenomenon, their fraction provides clues on the timescale of this stage. Currently, there is large uncertainty in the fraction of red QSOs missing from optically selected samples, with values ranging from 15 to over 50 per cent (e.g. Wilkes et al., 2002; Richards et al., 2003; White et al., 2003; Glikman et al., 2004, 2007). The uncertainty is associated with the selection of the appropriate comparison sample of optically selected QSOs and with difficulties in accounting for dust extinction in the selection of reddened QSOs. In this paper we address these issues by using the 1/Vmax formalism to estimate the maximum volume that a source is detectable, given the survey limits and taking into account the effect of dust extinction and the intrinsic luminosity of the source. For comparison we use the Sloan Digital Sky Survey (SDSS) optically selected QSO sample of Schneider et al. (2005) , which is large and with well defined selection criteria. Throughout the paper we adopt , and .
2 Sample selection
Candidates for dust enshrouded active galaxies were selected in the All Sky Data Release of the 2MASS Point Source Catalog (PSC) by cross-correlating the positions of the 2MASS sources with the 3rd data release (DR3) of the SDSS.
First, 2MASS-PSC sources with mag and mag were selected. The magnitude limit is close to the 99 per cent completeness limit of the 2MASS-PSC ( mag; Cutri et al., 2005), while the colour cut is to avoid Galactic stars (e.g. Francis et al., 2004). We exclude sources for which the -band photometric quality flag (PH_QUAL parameter) has values “X” and “U”, which signify bad photometry and an upper limit in the -band magnitude respectively (Cutri et al., 2005).
The resulting 2MASS-PSC source list was cross-correlated with the SDSS using a matching radius of 3 arcsec, which is much larger than the sub-arcsec positional accuracy of the SDSS and the 2MASS surveys. For the SDSS magnitude limit of mag we expect about 2 per cent spurious alignment rate within this search radius. The SDSS -band AB magnitudes were converted to Vega -band magnitudes using the colour transformations of Fukugita et al. (1996). This is to select candidates for dust enshrouded active systems using the colour cut mag, i.e. similar to that of Extremely Red Objects (EROs; Elston, Rieke & Rieke 1988). Pozzetti & Mannucci (2000) have used the vs colour diagram to discriminate between early-type and dusty EROs. This is shown in Figure 1. We focus on the dusty subregion of this figure. A total of 10 sources of our SDSS/2MASS sample lie in the dusty part of the colour-colour space of Figure 1. These are presented in Table 1 and form the main sample of this paper. The offsets between the 2MASS and the SDSS source positions are 0.4 arcsec for all 10 selected sources and therefore the probability of spurious identifications is small, per cent, for the SDSS magnitude limit of mag. We note that the colour selection criteria adopted here are similar to those used by (Wilkes et al., 2002, , mag) and (Glikman et al., 2004, , mag) to select 2MASS red AGN.
| ID | ||||||||||
|---|---|---|---|---|---|---|---|---|---|---|
| 2MASS_02 | 20h56m29.76s | -06d50m55.4s | ||||||||
| 2MASS_03 | 20h48m37.25s | -00d24m37.3s | ||||||||
| 2MASS_04 | 17h04m21.16s | +24d33m40.9s | ||||||||
| 2MASS_05 | 15h33m34.18s | +07d35m05.7s | ||||||||
| 2MASS_06 | 13h40m39.68s | +05d14m19.9s | ||||||||
| 2MASS_07 | 13h21m22.89s | +45d02m24.8s | ||||||||
| 2MASS_08 | 12h52m12.93s | +07d15m04.7s | ||||||||
| 2MASS_10 | 08h25m2.06s | +47d16m52.0s | ||||||||
| 2MASS_11 | 01h34m35.67s | -09d31m03.0s | ||||||||
| 2MASS_12 | 00h36m59.82s | -01d13m32.4s |
| ID | redshift | ||||||||
|---|---|---|---|---|---|---|---|---|---|
| 2MASS_02 | 5.6 | 0.635 | |||||||
| 2MASS_03 | 3.6 | 0.433 | |||||||
| 2MASS_04 | 0.422 | ||||||||
| 2MASS_05 | |||||||||
| 2MASS_06 | 8.9 | 0.264 | |||||||
| 2MASS_07 | |||||||||
| 2MASS_08 | 2.160 | ||||||||
| 2MASS_10 | 63.2 | 0.804 | |||||||
| 2MASS_11 | 919.7 | 2.210 | |||||||
| 2MASS_12 | 0.8 | 0.291 |

3 Observations
In addition to the available optical (SDSS; ) and near-IR (2MASS; ) broad band data, which are presented in Table 1, we have also carried out mid- and far-IR photometry with Spitzer as well as optical and near-IR spectroscopy to determine redshifts. These observations are described below.
3.1 Mid- and far-Infrared photometry
The Spitzer mid- and far-infrared photometric observations were performed during Cycle-2 as part of the General Observer program with identification number 30607 (PI Georgakakis). The mid- and far-IR flux densities of the target sources are presented in Table 2.
The data were taken with the IRAC (Infrared Array Camera) between July 9 and December 28 2006. Each observation consists of 5 separate integrations of 2 s each organised in a random Gaussian dither pattern. The median separation between successive offsets is 0.9 arcmin. The observations were run through the S14.4.0 version of the Spitzer Science Center pipeline described in IRAC data handbook. The basic calibration data (BCD) products are processed for dark current, bias offset, linearisation, flat-fielding, cosmic ray detection and the flux calibration. The individual frames of a given source were then registered and co-added into the final mosaiced image. The uncertainty in the calibration factor applied to the final mosaics is about 10 per cent. Following the IRAC data handbook flux densities are estimated by using apertures of 6 arcsec radius and then applying aperture correction factors to account for the extended Spitzer point spread function (PSF) in different wavebands. These are estimated 1.06 for IRAC 3.6, bands and 1.10 for the 5.8 and bands. Colour corrections are expected to be small as the mid-IR spectra of the sources in the sample approximate a power-law with . We therefore choose not to apply colour corrections.
The 24, 70, and data were taken with MIPS (Multiband Imaging Photometer for Spitzer) between July 14 2006 and September 15 2007. The observations used the MIPS small-field photometry mode with an exposure time of 3 s for individual frames. The 24 and data were obtained in one cycle, while the observations were carried out in 3 cycles. The total on-source exposure times were 48, 38 and 25 s at 24, 70, and respectively. The MIPS images were created from raw data frames using the MIPS Data Analysis Tools (MIPS DAT; Gordon et al., 2005) version 3.10 along with additional processing steps. The processing steps for the 70 and data are similar, but the steps for the 24 data are significantly different from these other two bands. The 24 data processing is described first followed by descriptions of the 70 and data processing.
The individual 24 m frames were first processed through a droop correction (removing an excess signal in each pixel that is proportional to the signal in the entire array) and were corrected for non-linearity in the ramps. The dark current was then subtracted. Next, scan-mirror-position dependent flats were applied to the data, latent images were removed, and scan-mirror-position independent flats were applied to the data. Following this, the zodiacal light was measured by fitting planes to the background regions in each frame, and these planes were then subtracted from the data. Next, a robust statistical analysis was applied to cospatial pixels from different frames in which statistical outliers (e.g. pixels affected by cosmic rays) were masked out. After this, final mosaics were made with pixel sizes of , residual backgrounds in the images were subtracted, and the data were calibrated into astronomical units. The calibration factor for the 24 data is given by Engelbracht et al. (2007) as MJy sr-1 [MIPS instrumental unit]-1. A 10.5 arcsec radius aperture is used for the photometry. The correction factor that accounts for PSF losses is estimated to be 1.22. The mid-IR spectra of the sample sources is close to a power-law. For this SED type the colour correction at the 24 band is small (3 per cent) and we choose not to apply it.
In the 70 and data processing, the first step was to fit ramps to the reads to derive slopes, during which readout jumps and cosmic ray hits were also removed and an electronic nonlinearity correction was applied. Next, the stim flash frames taken by the instrument were used as responsivity corrections. The dark current was subtracted from the data, an illumination correction was applied, and short term variations in the the signal (often referred to as drift) were removed. Next, a robust statistical analysis was applied to cospatial pixels from different frames in which statistical outliers (e.g. pixels affected by cosmic rays) were masked out. Once this was done, final mosaics were made using square pixels of 4.5 arcsec for the data and 9 arcsec for the 160 m data. The residual backgrounds were measured and subtracted from the images. Finally, flux calibration factors were applied to the data. The calibration factors given by Gordon et al. (2007) are MJy sr-1 [MIPS instrumental unit]-1, and the calibration factor is given by Stansberry et al. (2007) as MJy sr-1 [MIPS instrumental unit]-1. For the photometry we use apertures with radii 4.5 and 9 arcsec at 70 and respectively. In this case, the correction factors that account for PSF losses are 1.30 and 1.87 respectively. Colour corrections for the MIPS 70 and bands are typically smaller than the calibration uncertainties and are therefore not applied to the data. In the case of non-detection we assign an upper limit to the flux density which corresponds to 5 times the standard deviation of the background.
3.2 Spectroscopy
Optical spectroscopy for the target sources was carried out at the Kitt Peak National Observatory (KPNO) 4-m telescope and the 4.2m William Herschel Telescope (WHT).
The KPNO observations used the Ritchey-Chretien spectrograph in single-slit mode with the BL 181 grism blazed at 7500. This setup provides a resolution of about 7Å in the wavelength range . An exposure time of 20min was adopted. These observations were carried out in March 10 2006.
The WHT spectroscopy used the ISIS (Intermediate dispersion Spectrograph and Imaging System) double armed spectrograph during service time in June 17 and July 8 2007. The observations were made using the 5300Å dichroic and the R300B and R158R gratings in the blue and red arms of the spectrograph respectively. The spectral resolution was about 7Å for the red arm and 4Å for the blue arm spectrum. The total on-source integration time was 20 min split into two 10 min exposures.
The data were reduced following standard methods as implemented in the noao package of iraf. After subtraction of the bias, the data were flat-fielded using observations of internal calibration lamps. Cosmic ray events were removed using the Laplacian Cosmic Ray Identification package (lacosmic; van Dokkum, 2001). The one dimensional spectra were extracted and wavelength calibrated using observations of CuNe and CuAr arc lamps. For the flux calibration observations of the spectrophotometric standard stars BD 282411 and BD 332642 were used. Because of the apparent faintness of our targets at wavelengths shorter than 5000Å the WHT/ISIS blue arm spectra did not show any signal and are therefore not presented in this paper.
Near-infrared spectroscopy of SDSS/2MASS EROs was obtained in queue mode on the UK Infrared Telescope (UKIRT). The observations used the UKIRT Imaging SpecTrometer (UIST) in long slit mode with a mixture of the IJ and HK grisms, the exact selection depending on the expected redshift of the object based on photometric redshift estimation. The observations were carried out in clear conditions on 18, 22, 23 June, 2007. Integration times were 1.5 hours for the HK grism and 45 minutes for the IJ grism. The data were reduced using the automated ORACDR system which performed flat fielding, wavelength calibration based on arc spectra, subtracted the chopped images and coadded separate sub-exposures. Flux calibration was carried out using the BS5019 and BS8 spectrophotometric standards. No correction for slit losses were applied so the flux calibration is correct in a relative sense. The spectra were then analyzed using a combination of IRAF and IDL routines to determine redshifts and to extract relevant emission line parameters.
Spectroscopic redshifts are available for 8/10 2MASS sources, 7 from our own observations and 1 from the literature. The lack of spectroscopic redshift determinations for 2 sources in the sample is because of low S/N optical spectra. The optical and near-IR spectra of the sources with successful redshift determinations are shown in Figure 2. The redshifts are presented in Table 2 and estimates of the FWHM (Full Width Half Maximum) of emission lines are discussed in the Appendix and are listed in Table 3 .


4 Spectral Energy Distributions
The observed optical to mid-IR Spectral Energy Distribution (SED) of the sample sources are modeled following the methods fully described in Rowan-Robinson et al. (2005, 2008). In brief the -band to photometric data are fit using a library of 8 templates described by Babbedge et al. (2004), 6 galaxies (E, Sab, Sbc, Scd, Sdm and sb) and 2 AGN. At longer wavelengths () any dust may significantly contribute or even dominate the observed emission. Before fitting models to these wavelengths the stellar contribution is subtracted from the photometric data by extrapolating the best-fit galaxy template from the previous step. The residuals are then fit with a mixture of four templates: cirrus (Efstathiou & Rowan-Robinson, 2003), AGN dust tori (Rowan-Robinson, 1995; Efstathiou & Rowan-Robinson, 1995), M 82 and Arp 220 starbursts (Efstathiou et al., 2000). The modeling above provides both information on the dominant emission mechanism in the optical and the infrared (AGN vs star-formation) and an estimate of the total infrared luminosity, , of our sample sources in the wavelength range . As discussed by Rowan-Robinson et al. (2005) is expected to be accurate within a factor of two. In this exercise the redshift is fixed to the spectroscopically determined value, if available (8/10 sources). For the two sources in the sample without spectroscopic redshifts we also estimate photometric redshifts, although we caution that these are likely to be uncertain because of their extreme optical/near-IR colours. From the spectroscopic sample we estimate that the fraction of catastrophic redshifts, defined as those with , is 38 per cent (3/8). The rms value of the quantity , after excluding catastrophic failures, is 0.07 and provides an estimate of the accuracy of the photometric redshifts.
Figure 3 overplots the best-fit models to the observed SEDs of the red 2MASS sources. The derived parameters are presented in Table 3. In summary, the mid-IR SED of all sources is dominated by hot dust, which is fit by an AGN torus component. An additional starburst template is required to fit the far-IR data of some sources in Table 3. The optical part of the SED is fit with a reddened QSO template adopting the SMC extinction curve of Richards et al. (2003). The derived optical extinctions are in the range ().

| ID | IR template | FWHM | |||||
|---|---|---|---|---|---|---|---|
| () | (mag) | (mag) | (W/Hz) | (km/s) | |||
| 2MASS_02 | 13.11 | torus | 0.15 | 2.3 | -29.49 | 24.94 | 2000 () |
| 2MASS_03 | 12.57 | torus | 0.40 | 1.9 | -28.48 | 24.36 | 1500 () |
| 12.37 | M 82 | ||||||
| 2MASS_04 | 12.27 | torus | -0.20 | 3.2 | -27.56 | – | – |
| 12.37 | M 82 | ||||||
| 2MASS_05 | 14.17 | torus | -0.20 | 1.3 | -32.15 | – | – |
| 13.87 | M 82 | ||||||
| 2MASS_06 | 12.12 | torus | 0.25 | 2.3 | -27.34 | 24.25 | 1500 () |
| 11.72 | M 82 | ||||||
| 2MASS_07 | 13.86 | torus | -0.80 | 1.5 | -31.98 | – | – |
| 2MASS_08 | 13.75 | torus | 0.00 | 1.2 | -30.64 | – | 4700 () |
| 13.95 | M 82 | ||||||
| 2MASS_10 | 13.14 | torus | 0.40 | 2.3 | -29.83 | 26.24 | – |
| 2MASS_11 | 13.65 | torus | -1.10 | 2.3 | -31.69 | 28.43 | – |
| 12.85 | M 82 | ||||||
| 2MASS_12 | 12.13 | torus | 0.40 | 3.0 | -27.36 | 23.32 | 1600 () |
| 12.33 | M 82 |
5 Nature of the 2MASS selected sample
The nature of the red 2MASS sources is explored by combining information from the optical/near-IR spectroscopy and the broadband UV–to–far-IR photometry. There is strong evidence that all sources in the sample are powered by accretion on a central supermassive black hole. Firstly, for seven out of the eight sources for which optical and/or near-IR spectra are available, either from our own observations or from the literature, broad Balmer or Paschen emission lines are found with widths km/s. For more details on the spectroscopic properties of individual objects see the Appendix section. Additionally, the red 2MASS sources are luminous in the mid-IR and their SEDs at these wavelengths are fit by the hot dust AGN tori models of Rowan-Robinson (1995) and Efstathiou & Rowan-Robinson (1995). The total IR luminosity () of this component is estimated in the range (), i.e. exceeding the limit for either ULIRGs (Ultra-Luminous Infrared Galaxies) or HyLIRGs (Hyper-Luminous Infrared Galaxies). Adopting an AGN bolometric correction factor of (e.g Risaliti & Elvis, 2004), the luminosity interval above exceeds the limit , which is often used to differentiate luminous QSOs from Seyfert galaxies. Therefore, in the following we refer to the sample of sources in Table 1 as 2MASS or red QSOs.
The red optical/near-IR colours of the 2MASS QSOs in Table 1 can be attributed to either an intrinsically red optical continuum (e.g. Richards et al., 2003), synchrotron emission with a turnover frequency in the UV/optical part of the spectrum (e.g. Whiting et al., 2001) or dust reddening. Each of these possibilities is discussed below.
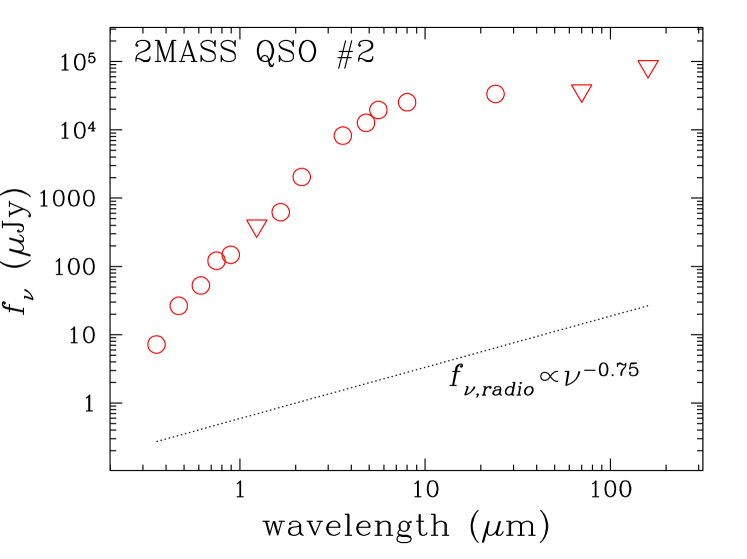
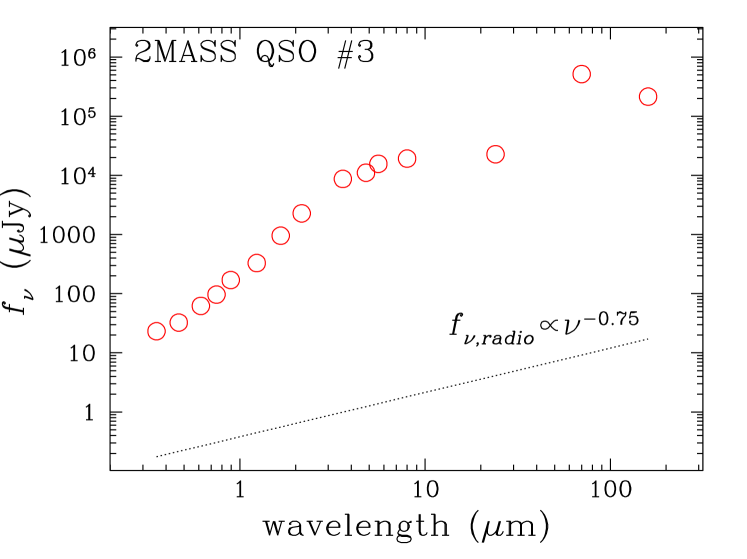
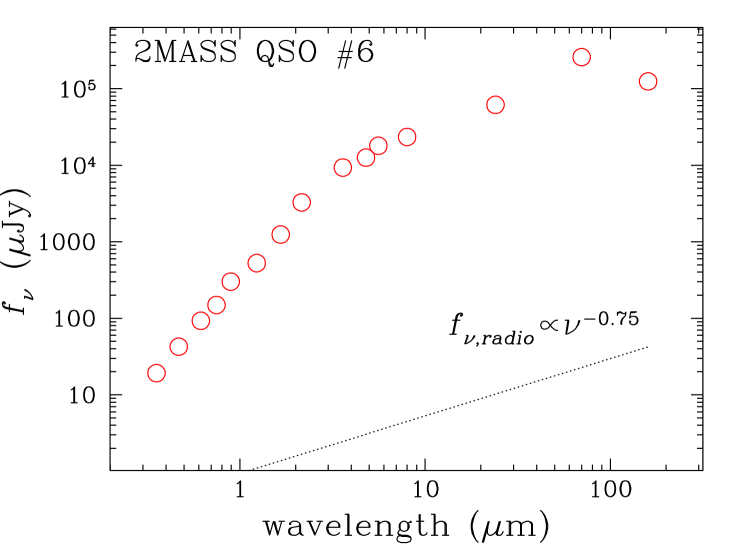
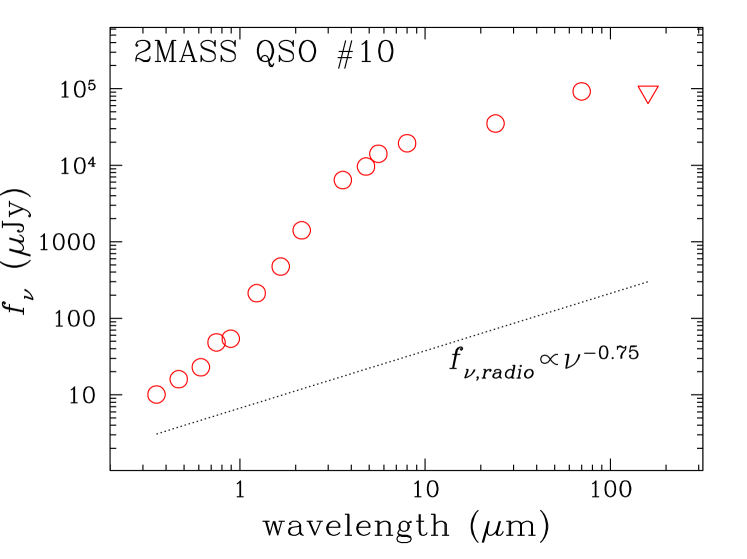
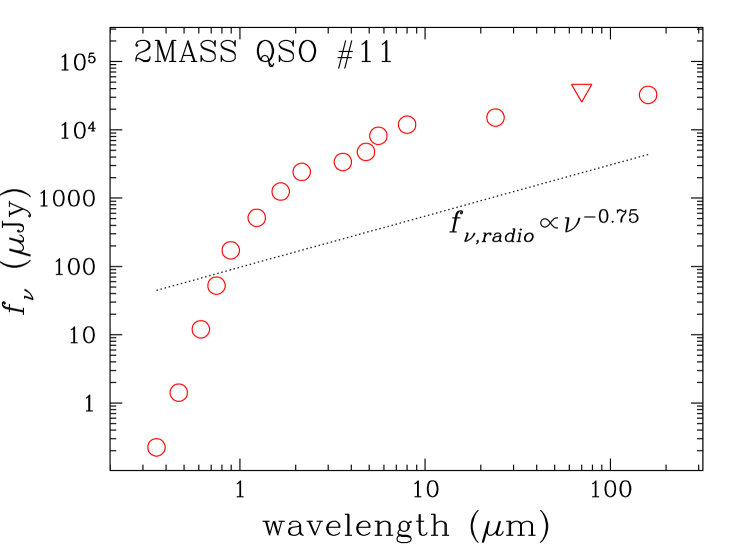
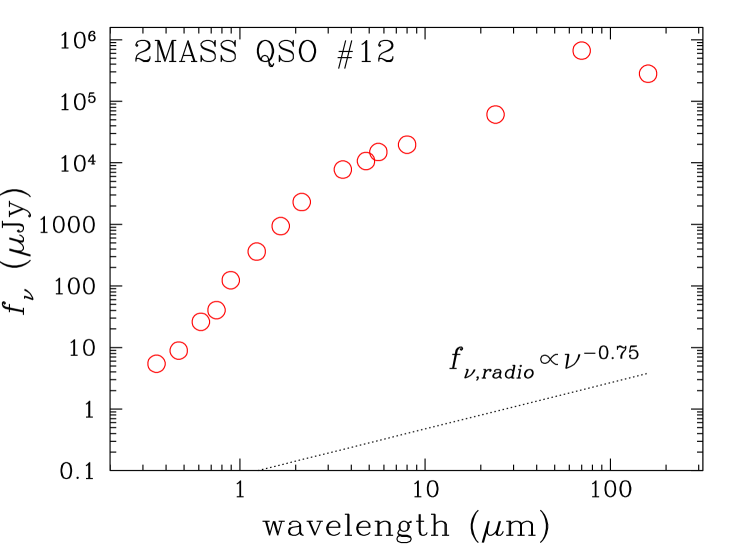
Radio selected QSOs from the Parkes half-Jansky flat-spectrum sample (Drinkwater et al., 1997) have a large spread in the optical/near-IR colours, with the reddest objects having (Francis et al., 2000). Whiting et al. (2001) proposed that synchrotron emission with a turnover frequency in the range can explain the red colours of a sizeable fraction of this population (about 40 per cent). This is relevant to this study as many 2MASS QSOs (6/10; see Table 1) are detected in the NVSS (Condon et al., 1998, limit mJy) or the FIRST (Becker et al., 1995, limit mJy) radio (1.4 GHz) surveys with luminosities in the range . Therefore, a contribution by synchrotron emission in the optical/near-IR wavebands is a possibility. Figure 4 explores this scenario by extrapolating the observed 1.4 GHz flux density to the UV assuming a standard synchrotron spectrum of the form (e.g. Condon, 1992). This figure shows that the observed radio emission is too faint to explain the observed red colours of most radio detected 2MASS QSOs, in agreement with previous studies (e.g. Glikman et al., 2007). A possible exception is source 2MASS_11. This lensed source was first identified by Gregg et al. (2002) because of its unusually red colour. The radio flux density of this system is sufficiently bright () that can potentially affect the optical colours as suggested by Whiting et al. (2001).
Richards et al. (2003) showed the observed optical colours of QSOs are a strong function of redshift and proposed the use of relative colours (e.g. ; difference between the observed and the median colour of QSOs at the same redshift) to discriminate between intrinsically red and dusty systems. These authors showed that the distribution of SDSS optically selected QSOs can be approximated by a Gaussian, suggesting a range of intrinsic optical continuum slopes, and a red tail, which is dominated by dust reddened systems. All the 2MASS QSOs presented in this paper have , which places them in the red tail of the SDSS optically selected QSO distribution (e.g. see Figure 6 of Richards et al., 2003) and in the region of the parameter space where sources with dust reddening are expected to be found. Richards et al. (2003) shows that such red colours are most likely because of dust rather than a steep optical power-law spectrum.
Dust reddening indeed provides good fits to the UV–to–near-IR SEDs of the 2MASS QSOs, if the SMC extinction curve is adopted (Richards et al., 2003). This type of extinction is strongly supported by the shapes of the observed UV/optical SEDs, which are smooth and do not show the characteristic bump at rest-frame of the Galactic extinction curve (Gordon et al., 2003). The derived optical extinctions for the 2MASS QSOs are in the range (see Table 3), much higher than optically selected QSO samples, which are typically sensitive to systems with or for SMC type extinction (e.g. Richards et al., 2003).
An independent estimate of the reddening can be obtained using the Balmer or Paschen line decrements. For the former we assume Case-B recombination (Storey & Hummer, 1995), while for the latter we use empirically determined ratios, as Case B recombination is not a good approximation for the Paschen lines of QSOs (e.g Glikman et al., 2007; Soifer et al., 2004). This excercise is possible for 4 out of 10 2MASS QSOs (see Appendix). These values typically do not agree with the reddening derived from SED fitting. A similar trend using a larger sample has been reported by Glikman et al. (2007). This implies that the dust distribution is complex and therefore the line emission and the continuum are absorbed by different material.
The ratio of the total infrared luminosity in the dust torus () to the reddening corrected optical () QSO luminosity, , has been interpreted as a measure of the dust covering factor in AGN (Rowan-Robinson et al. 2008). For optically selected QSOs in the SWIRE survey the distribution of the ) is well fitted by a Gaussian with mean –0.10 and standard deviation 0.26 (Rowan-Robinson et al. 2008). We find that 6/8 2MASS QSOs with spectrocopic redshifts (see Table 3), have , suggesting covering fractions larger than the typical SWIRE optically selected QSO. In this comparison we have excluded the two 2MASS QSOs without spectroscopic redshifts to avoid uncertainties in the determination of their rest-frame properties because of errors in the photometric redshift estimates.
In addition to the AGN activity, a number of sources in the sample also show evidence for star-formation. There are objects (see Table 3) with excess emission in the far-IR over the extrapolation of the dust torus models of Rowan-Robinson (1995) and Efstathiou & Rowan-Robinson (1995). In our modeling of the observed SEDs this excess is fit with cool dust associated with starbursts. The total IR luminosity of this component is large, in the range suggesting high star-formation rates, . Additionally, there are sources in the sample with excess emission in the bluer SDSS optical bands, and/or , over the expectation of the reddened QSO template (2MASS_3, 2MASS_10, 2MASS_12). This excess can be fit by an additional starburst component that dominates over the reddened QSO emission in the UV part of the spectrum. We cannot exclude however, the possibility of scattered radiation from the AGN itself as the origin of this excess. It is interesting nevertheless, that 2MASS_3, one of the objects that shows the UV excess, has narrow emission lines in addition to the broad wings of the . The flux ratios of the narrow emission line components place this source in the region of Transition Objects in the diagnostic diagram of Kewley et al. (2001), suggesting some level of star-formation.
In summary, the red 2MASS sources studied in this paper are dust reddened QSOs, while a large fraction (7/10 in Table 3) have far-IR properties consistent with star-formation in the host galaxy.
6 Comparison with optically selected QSOs
6.1 Star-formation rate
In this section we first explore possible systematic differences in the IR SEDs of the red 2MASS QSOs with optically selected ones. For this comparison we use the Palomar-Green (PG) QSO sample Schmidt & Green (1983), for which a rich set of multiwavelength observations is available. We consider in particular the sub-sample of 64 PG QSOs with mid- and far-IR observations () in the ISO archive analysed and presented by Haas et al. (2003). From that sub-sample only sources with SDSS optical photometry (total of 26) are used here. The near-IR data for these sources are from the 2MASS survey. In order to avoid uncertainties associated with the photometric redshift estimates, in this section we consider 2MASS QSOs with spectroscopic redshifts only. The median redshift of the PG QSO subsample used here is , lower than that of 2MASS QSOs, .
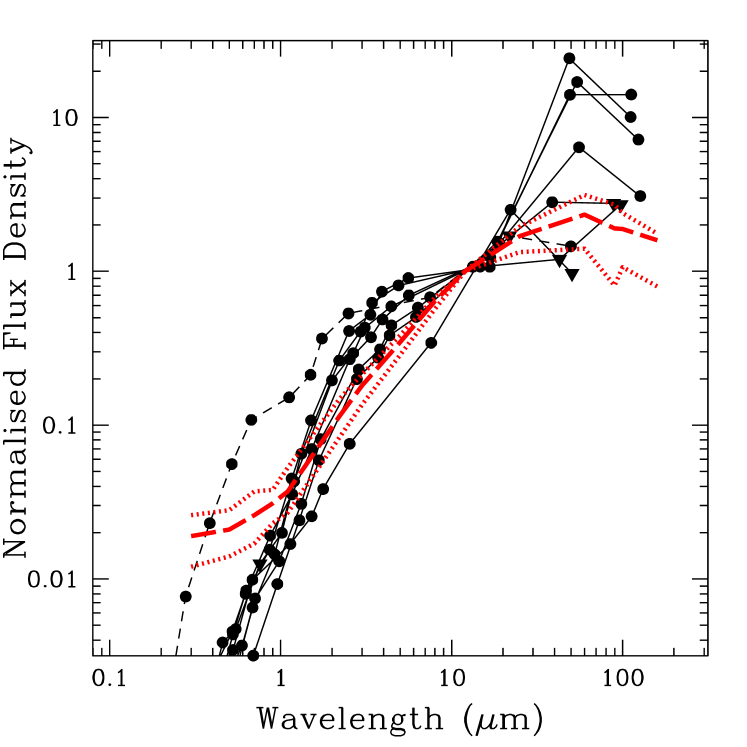
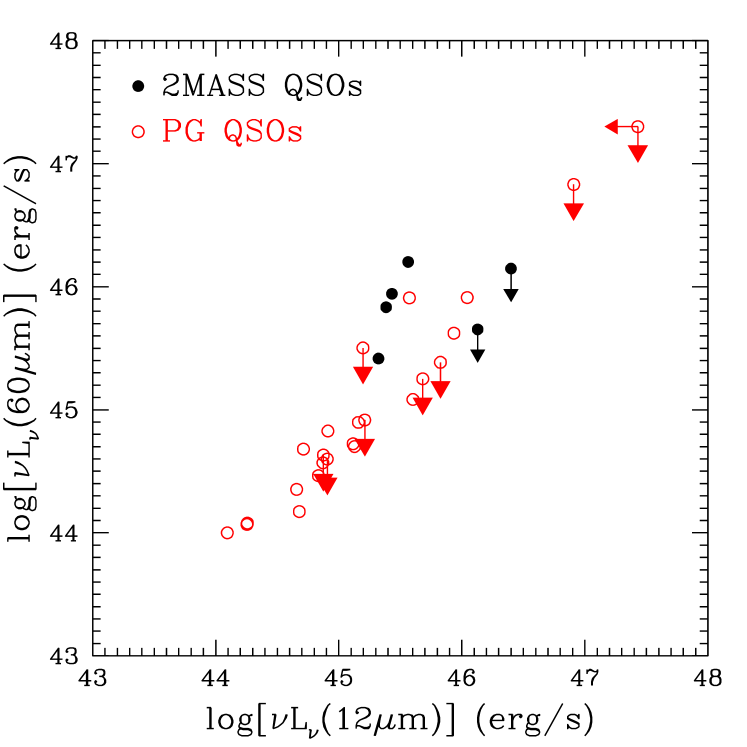
Figure 5 compares the rest-frame UV-to-IR SEDs of the 2MASS QSOs with those of the optically selected PG QSOs. The SEDs are normalised to the rest-frame flux density, as this wavelength is proposed to be nearly unbiased census of the AGN power (e.g. Spinoglio & Malkan, 1989). As expected dust reddening makes the UV/optical SEDs of 2MASS QSOs steeper than PG QSOs. Also, there is evidence that the far-IR properties of the two samples differ. The normalised rest-frame far-IR flux density of at least 4 out of 8 2MASS sources with spectroscopic redshifts is elevated compared to the median SED of PG QSOs. Our SED modeling (see Table 3) and recent studies of optically selected QSOs (e.g Haas et al., 2003; Schweitzer et al., 2006), suggest that the far-IR emission of these monsters is dominated by star-formation. Under this assumption, Figure 5 therefore shows that at least some 2MASS QSOs have, on average, higher star-formation than optically selected QSOs. This is further demonstrated in Figure 6 which plots luminosity against luminosity (see figure caption for details on the determination of the luminosities). For given luminosity, some 2MASS QSOs are more luminous at . The assessment of the significance of this excess is limited by the small sample size. Nevertheless, we use survival statistics as implemented in the ASURV package (Isobe et al., 1986; Lavalley et al., 1992) to estimate the null hypothesis probability that the distribution of the luminosity ratio of 2MASS and PG QSOs is drawn from the same parent population. Using the Gehan’s generalised Wilcoxon test we estimate this probability to be 3 per cent. The null hypothesis can therefore be rejected at the 97 per cent level ( in the case of Gauss distribution).
Schweitzer et al. (2006) and Netzer et al. (2007) find that a substantial fraction of optically selected PG QSOs show evidence for star-formation (up to 70% based on the far-IR detection rate, 30% based on PAH detection rate). Moreover, they found that indicators of star-formation rate (e.g. PAH or luminosities) correlate well with indicators of AGN power (e.g. or 5100 Å luminosities) for these systems. The red 2MASS QSOs studied here also show evidence for ongoing star-formation: 6 out of 8 sources (75%) with spectroscopic redshifts are fit by an additional starburst component in the IR (see Table 3). An additional interesting result from our analysis is that at the 97 per cent significance level the 2MASS QSOs have excess star-formation for their AGN power compared to the optically selected PG QSOs.
6.2 Radio detection rate
An interesting trend in Table 1 is the high fraction of the 2MASS QSOs with detection at 1.4 GHz: 6/10 are radio sources in either the NVSS of the the FIRST surveys. This is unexpected because the sources were selected independent of their radio properties, unlike previous efforts to identify reddened QSOs, which started from radio selected samples to identify objects with very red optical/near-IR colours (e.g. Gregg et al., 2002; White et al., 2003; Glikman et al., 2004, 2007; Urrutia et al., 2008a).
Next we explore whether the radio detection rate of 2MASS QSOs is different from optically selected ones. For this exercise, we compare against the SDSS QSOs to take advantage of the large sample size and the well defined selection criteria. We use in particular the SDSS-DR3 quasar catalog of Schneider et al. (2005), which was created by inspecting all spectra that were either targeted as quasar candidates, or classified as a quasar by the SDSS spectroscopic pipelines. This catalogue includes objects from all categories of spectroscopic target selection in the SDSS, not just those selected as QSO candidates. For our purposes we use only targeted SDSS QSOs in the Schneider et al. (2005) catalogue, i.e. sources that belong to the the main (or low-redshift) and the high-redshift QSO samples of the SDSS. These samples include QSOs with mag that were selected based on the optical colour criteria of Richards et al. (2002). We further apply a cut mag to match the magnitude limit used to select 2MASS QSOs. There are 638 such sources in the Schneider et al. (2005) catalogue. The mag magnitude cut does not introduce incompleteness in the sample, as it corresponds to mag for the average colour of optically selected QSOs, which takes values in the range 2–3, depending on redshift. Similarly, the bright magnitude limit mag for follow up spectroscopy of the SDSS QSO candidates corresponds to mag. QSOs brighter than that may be missed from the SDSS sample. The surface density of such bright QSOs is likely to be small however, and it is not expected to introduce any significant bias in the SDSS optically selected QSO sample.
In order to estimate the radio detection rate of the sample we use the FIRST radio survey. There are 582 SDSS QSOs with mag that fulfill the Richards et al. (2002) criteria and overlap with the area covered by the FIRST survey. A total of 172 of them, i.e. per cent, are detected at 1.4 GHz to the FIRST limit. This fraction should be compared with the detection rate of 2MASS QSOs, i.e. 60 per cent. Using binomial statistics we estimate a 4 per cent probability of at least 6 radio detections in 10 trials given the success rate of 30 per cent of the optically selected QSO sample. The radio detection rate of 2MASS QSOs is higher than that of optically selected ones, albeit at the 96 per cent level (). This is tentative evidence that red 2MASS QSOs are more often radio sources than optically selected QSOs. Glikman et al. (2007) have identified reddened 2MASS QSOs by preselecting candidates in the FIRST radio survey. Their radio selected reddened sample represents a substantial fraction of the overall radio detected QSO population, up to 60 per cent. This finding further supports an association between red QSOs and radio emission.
We caution that 2MASS QSOs are more luminous, on average, in the -band than the SDSS ones. This is demonstrated in Figure 7 plotting the distribution of the two samples. Although the radio detection rate of SDSS QSOs does not appear to depend on it might be possible that the somewhat different radio detection rates of the two samples are because of 2MASS QSOs are more luminous. Larger samples of reddened QSOs are needed to further explore possible differences in their radio emission compared to optically selected samples.

6.3 Fraction of reddened QSOs
The fraction of reddened QSOs within the overall population is still under debate with different studies suggesting values from 15 to over 50 per cent (e.g Richards et al., 2002; Wilkes et al., 2002; White et al., 2003; Glikman et al., 2004). The difficulty in assessing this fraction is that one has to take into account the effect on dust in the detectability of reddened QSOs, which in effect means that at a given magnitude limit one detects only the most luminous reddened QSOs. In this section we take this effect into account by estimating the maximum volume, Vmax, that a source could be detected taking into account the dust reddening and its luminosity.
First however, we directly compare the surface density of the 2MASS QSOs with those of optically selected ones. In the previous section we counted 638 QSOs in the SDSS-DR3 catalogue of Schneider et al. (2005) with mag that fulfill the Richards et al. (2002) criteria. Using the spectroscopic area of SDSS-DR3, , we estimate a sky density of for optically selected QSOs to mag. In contrast, we find 10 reddened 2MASS QSOs in the of the photometric SDSS-DR3 catalogue, which corresponds to a surface density of , 2 dex lower than optically selected QSOs. The reddened 2MASS QSOs selected here appear to be very rare and therefore insignificant, in terms of numbers, for the overall population of QSOs. However, as shown in Figure 7 reddened QSOS are more luminous and the SDSS QSOs and it is therefore not surprising they are rarer.
We address this issue using the 1/Vmax formalism (e.g. Lilly et al., 1995) to estimate the -band luminosity function of the 2MASS QSOs relative to that of the overall QSO population. For each source with intrinsic absolute magnitude the maximum volume Vmax is estimated given the selection function of the sample, i.e. mag, and . For the calculation of magnitudes, colours and k-corrections we adopt the SDSS composite QSO SED (Vanden Berk et al., 2001) and redden it by SMC type dust (Pei, 1992) assuming the optical extinction, , listed in Table 3. We then sum the 1/Vmax of each source in luminosity bins. The same procedure is repeated for the optically selected SDSS QSOs with mag, assuming for this population. In order to minimise evolution effects and to avoid high redshift sources for which lensing artificially boosts the observed luminosity (e.g. 2MASS_11), we only consider 2MASS and SDSS QSOs with . The results are shown in the inset plot of Figure 7, which plots as a function of the ratio of the 2MASS sources luminosity function over the total luminosity function of both 2MASS and SDSS QSOs. The fraction of reddened QSOs is increasing from per cent at to about per cent of the overall population at . This is evidence that reddened QSOs become important at bright luminosities. We caution that small number statistics are an issue in this calculation. Larger reddened QSO samples at magnitudes fainter than the 2MASS limit are needed to further explore this trend and to provide a more reliable measure of the reddened QSO fraction. Efforts to identify QSOs in the the UKIRT Infrared Deep Sky Survey (UKIDSS, mag) including dust reddened ones, have recently appeared in the literature (Maddox et al., 2008), although the source selection is very different to that presented here.
7 Discussion
This paper combines photometric data from the largest optical and near-IR surveys, SDSS and 2MASS, to select QSOs with red optical/near-IR colours, which are atypical to those of the traditional population of optically selected broad-line QSOs. It is shown that the UV/optical SEDs of the red QSOs can be explained by moderate amounts of dust extinction, . An open question is whether red QSOs can be explained by orientation arguments, and therefore are a subset of optically selected QSOs, or they represent a different stage of the life of QSOs.
On the latter point, there is a large volume of literature on the possible evolution link between starbursts, QSOs and spheroids. Both observations (e.g. Sanders et al., 1988; Sanders & Mirabel, 1996; Clements, 2000; Canalizo & Stockton, 2001; Komossa et al., 2003; Alexander et al., 2005; Veilleux et al., 2006; Schweitzer et al., 2006; Dasyra et al., 2007) and numerical simulations of major mergers (e.g. Di Matteo et al., 2005; Springel et al., 2005; Hopkins et al., 2006) support such an association. It is proposed in particular, that some mechanism, possibly mergers, drive gas efficiently to the central galaxy regions, thereby triggering powerful starbursts and black hole growth at a high accretion rate. During this stage both the central engine the star-forming regions are enshrouded in dust and gas clouds. As a result the system appears luminous in the infrared (LIRGs or ULIRG stage). AGN and/or starburst driven winds (feedback) will eventually develop and blow away the dust cocoon at the nuclear regions, thereby allowing the AGN to shine unobscured. This is the stage where the system can be identified as UV/optically luminous broad line QSO. When all the cold gas in the nuclear regions is depleted, either because it is used up in star-formation, consumed by the black-hole, heated or pushed away by the feedback processes, the AGN and starburst will switch off, leaving behind a quiescent galaxy. In this picture reddened QSOs are systems captured just before or during the final blow-out stage of their evolution.
Our findings, although limited by the small number of sources in the sample, are in broad agreement with this scenario. The far-IR properties of about 70 per cent of the reddened QSOs are consistent with starburst activity. There is also evidence that the star-formation rate of these systems, normalised to the AGN power, is higher than that of optically selected QSOs, on average. A possible interpretation of this finding is that feedback from the central engine has not yet suppressed the star-formation in the host galaxy at the same level as in typical QSOs. There is also tentative evidence, significant at the 96 per cent confidence level, that reddened QSOs are more often associated with radio sources compared to optically selected QSOs. If this is confirmed by larger samples, it may suggest the onset of the AGN driven feedback in these systems via radio jets. The tentative evidence for larger dust covering fractions (approximated by ) of the 2MASS QSOs presented in this paper compared to optically selected SWIRE QSOs, is also consistent with the young AGN interpretation. With the data presented here we cannot comment on the optical morphology of reddened QSO host galaxies. Hutchings et al. (2003, 2006) and Urrutia et al. (2008b) explored this issue using a different sample of red 2MASS QSOs selected to have near-IR colours mag. They report a higher incidence of systems with interaction signs in their sample compared to optically selected QSOs (but see Marble et al., 2003). Although this conclusions is limited by the absence of an appropriate comparison sample, it is consistent with the merger induced starburst/AGN activity picture above, and suggests that reddened QSOs are at an earlier evolutionary stage than optically selected ones. The relatively low fraction of 2MASS QSOs, i.e. 3-12 per cent of the overall QSO population depending on , may therefore reflect the short timescale of the particular evolutionary stage relative to the QSO lifetime.
Another class of sources that are also proposed to precede the optically luminous QSO phase are ULIRGs with broad emission lines (type-I ULIRGs; e.g. Kawakatu et al., 2003, 2006). These systems have young stellar populations ( old Canalizo & Stockton, 2001), a large fraction of them experience tidal interactions (Canalizo & Stockton, 2001; Lípari et al., 2005), their black hole masses are smaller compared to ellipticals and optically selected QSOs for the size of their bulge (Kawakatu et al., 2006), Broad Absorption Lines (BAL) indicative of outflows are frequent in this population (Canalizo & Stockton, 2001), and most of them have narrow permitted emission lines (e.g. FWHM of less than ) similar to narrow-line Seyfert 1 galaxies, which are also believed to be young AGN (Zheng et al., 2002; Anabuki, 2004). The 2MASS QSOs studied here share some of the properties of type-I ULIRGs, i.e. , permitted emission lines with FWHM typically , ongoing star-formation. Also, Urrutia et al. (2008a) have recently found an unusually high fraction of BAL sources among red 2MASS QSOs selected with criteria similar to those used here. It is therefore tempting to link the two types of sources. A major difference between the two populations however, is that Type-I ULIRGs are typically less reddened at UV/optical than 2MASS QSOs (e.g. Canalizo & Stockton, 2001). Is it therefore possible that 2MASS QSOs are even younger than type-I ULIRGs in the evolution scheme outlined above?
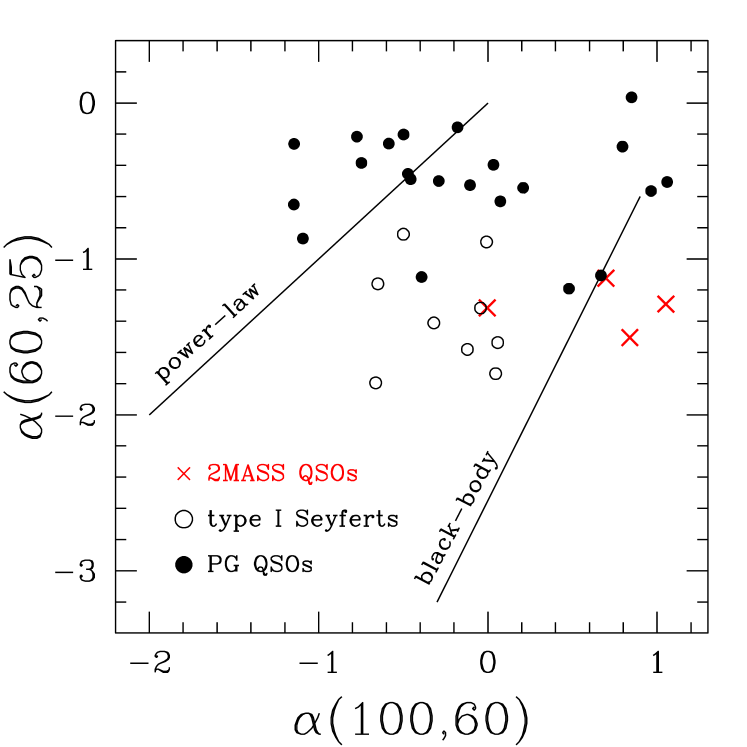
Figure 8 explore this possibility by comparing the infrared colours, against (see figure caption for details on the estimation of the colours), of PG and 2MASS QSOs with the sample of type-I ULIRGs of Canalizo & Stockton (2001). Different types of sources occupy fairly distinct regions in this figure. Sources dominated by cool dust are found in the left part of the diagram, close to line marked “black body”. Systems dominated by non-thermal emission populate the left part of the diagram, close to the “power-law” line. According to the evolution scenario described above QSOs should evolve from right to left in Figure 8. Optically selected PG QSOs dominate the upper left part of the diagram, the type-I ULIRGS of Canalizo & Stockton (2001) are selected to lie between the two diagonal lines, while the four low redshift 2MASS QSOs () scatter toward the far right end of the diagram. This suggests, but does not prove, that 2MASS QSOs may represent young QSOs, possibly before they become type-I ULIRGs and eventually typical UV/optically luminous broad line QSOs. Clearly, more data are needed to further explore this scenario. What fraction of 2MASS QSOs qualify for narrow line Seyfert 1s? What are the black hole masses and the accretion rates of these systems? Do we see optical spectral evidence for outflows (e.g. absorption features), similar to those observed in type-I ULIRGs (e.g. Canalizo & Stockton, 2001)? What are the properties of their host galaxies? All these are questions that need to be addressed before concluding on the nature of 2MASS QSOs.
8 Conclusions
We combine optical and near-IR photometry from the ground with Spitzer mid- and far-IR broadband data to explore the SEDs of a sample of 10 QSOs with red optical and near-IR colours selected by combining the 2MASS with the SDSS. The main conclusions are
-
•
The UV/optical part of the SED can be fit assuming an intrinsic spectrum similar to that of typical optically selected QSOs reddened by moderate amounts of dust.
-
•
There is evidence that red 2MASS QSOs have higher level of star-formation (approximated by the luminosity) for their AGN power (measured by the luminosity), compared to optically selected PG QSOs.
-
•
We find that 2MASS QSOs are more often associated with radio emission, compared to optically selected SDSS QSOs. This excess, although interesting, is only significant at the 96% level
-
•
The fraction of red QSOs in the overall population increases from % at mag to % at mag, suggesting that these systems become more important at the bright luminosities.
-
•
We argue that these findings are consistent with a picture where reddened QSOs are young AGN shortly before they shed their cocoon of dust and gas clouds and become typical UV/optically luminous QSOs. Comparison with Seyfert-1 ULIRGs, another class of sources proposed to be young QSOs, suggests that red 2MASS QSOs likely represent an earlier evolutionary stage.
9 Acknowledgements
We thank the anonymous referee for providing constructive comments and suggestions that significantly improved this paper. This work has been supported by funding from the Marie-Curie Fellowship grant MEIF-CT-2005-025108 (AG), the STFC (DLC) and the National Science Foundation through grant AST-0507781 (MSB). This publication makes use of data products from the Two Micron All Sky Survey, which is a joint project of the University of Massachusetts and the Infrared Processing and Analysis Center/California Institute of Technology, funded by the National Aeronautics and Space Administration and the National Science Foundation. The United Kingdom Infrared Telescope is operated by the Joint Astronomy Centre on behalf of the Science and Technology Facilities Council of the U.K. The WHT and its service programme are operated on the island of La Palma by the Isaac Newton Group in the Spanish Observatorio del Roque de los Muchachos of the Instituto de Astrof sica de Canarias.
Appendix A Notes on Individual Sources
2MASS QSO#2: The optical spectrum of this sources shows broad Balmer emission lines, , . Fitting a Gaussian to the we estimate a FWHM of . The [NeIII] 3869 line is also seen in the spectrum with broad profile. It is interesting that the Balmer lines are redshifted from the [OIII] 4959 and 5007Å lines by . A similar effect was reported by McIntosh et al. (1999) for luminous high redshift QSOs. In their sample the mean redward offset of the line with respect to the [OIII] 5007 was estimated to be . Visual inspection of the optical spectrum also suggests that the Balmer lines have asymmetric profiles with blue wings.
2MASS QSO#3: This source has narrow emission lines, , [OIII] 4959 and 5007Å [NII] 6583Å, and the line with broad wings. A simultaneous two component Gaussian fit to the blended and [NII] 6583Å lines fails to reproduce the flux in the wings of . An additional gaussian is introduced to account for the broad wings. The FHWM of this component is estimated to be . We also estimate diagnostic emission line ratios using the , [OIII] 5007Å [NII] 6583Å, and the narrow component of the . We estimate and , which place this source in the Transition Objects region of the diagnostic diagram of Kewley et al. (2001). The radio emission from this source is consistent with the starburst radio/far-IR correlation of Condon (1992). Adopting the SED of M 82 to extrapolate the measured rest-frame flux density to we estimate , which is consistent with the median for starbursts (Helou et al., 1985; Condon, 1992). We estimate an extinction of from the Balmer decrement of the narrow emission line components. This compares well to determined from the SED fits to the continuum.
2MASS QSO#4: Only narrow emission lines are observed in the optical spectrum of this source, , [OIII] 4959 and 5007Å. The spectral window does not cover the or the Paschen line region which suffer less extinction. This source is therefore likely to also have broad lines.
2MASS QSO#5: This source has optical spectroscopic observations, which however did not yield a redshift determination. SED fitting estimates a photometric redshift .
2MASS QSO#6: We find broad , and emission lines. A three component Gaussian fit to the line (to account for the blended line) gives a FWHM of for the broad component. The FWHM of the Paschen lines is about , estimated by single Gaussian fits to the line profiles. The extinction is from the Balmer decrement. In this calculation we use the narrow line component to compare with the narrow line. The extinction above is higher than determined from the SED fits to the continuum. The Paschen line ratio is estimated and is consistent with or adopting respectively, an empirically determined intrinsic ratio of 1.05 (Soifer et al., 2004) or 0.64 (Glikman et al., 2006).
2MASS QSO#7: Optical spectroscopic observations are available, but did not yield a redshift determination. SED fitting estimates a photometric redshift .
2MASS QSO#8: This source lies at and has broad with FWHM of about , estimated by single Gaussian fit to the line profile. The extinction is from the Balmer decrement. In this calculation we use single guassian line fits to the and lines. The extinction above is higher than the determined from the SED fits to the continuum.
2MASS QSO#10: The optical spectrum of this source shows narrow emission lines only, [OII] 3727Å, , [OIII] 4959 and 5007ÅṪhe near-IR spectrum of this source has been presented by Glikman et al. (2004) and shows broad emission line.
2MASS QSO#11: This is the lensed reddened QSO first found by Gregg et al. (2002). The optical and near-IR spectrum presented in that paper shows broad emission lines.
2MASS QSO#12: This source has broad and emission lines with FWHM of about , estimated by single Gaussian fits to the line profiles. The Paschen line ratio is estimated . The corresponding reddening is or for the empirically determined intrinsic ratios of 1.05 (Soifer et al., 2004) and 0.64 (Glikman et al., 2006) respectively. These ratios are larger than the reddening of determined from the SED fits to the continuum. This source has also been selected in the sample of Glikman et al. (2007) and Urrutia et al. (2008a).
References
- Alexander et al. (2005) Alexander D. M., Smail I., Bauer F. E., Chapman S. C., Blain A. W., Brandt W. N., Ivison R. J., 2005, Nature, 434, 738
- Anabuki (2004) Anabuki N., 2004, PhD thesis, University of Tokyo
- Babbedge et al. (2004) Babbedge T. S. R., Rowan-Robinson M., Gonzalez-Solares E., Polletta M., Berta S., Pérez-Fournon I., Oliver S., Salaman D. M., Irwin M., Weatherley S. J., 2004, MNRAS, 353, 654
- Becker et al. (1995) Becker R. H., White R. L., Helfand D. J., 1995, ApJ, 450, 559
- Bennert et al. (2008) Bennert N., Canalizo G., Jungwiert B., Stockton A., Schweizer F., Peng C. Y., Lacy M., 2008, ApJ, 677, 846
- Canalizo & Stockton (2001) Canalizo G., Stockton A., 2001, ApJ, 555, 719
- Cattaneo et al. (2006) Cattaneo F., Brummell N. H., Cline K. S., 2006, MNRAS, 365, 727
- Cid Fernandes et al. (2001) Cid Fernandes R., Heckman T., Schmitt H., Delgado R. M. G., Storchi-Bergmann T., 2001, ApJ, 558, 81
- Clements (2000) Clements D. L., 2000, MNRAS, 311, 833
- Condon (1992) Condon J. J., 1992, ARA&A, 30, 575
- Condon et al. (1998) Condon J. J., Cotton W. D., Greisen E. W., Yin Q. F., Perley R. A., Taylor G. B., Broderick J. J., 1998, AJ, 115, 1693
- Cutri et al. (2001) Cutri R. M., Nelson B. O., Kirkpatrick J. D., Huchra J. P., Smith P. S., 2001, in Bulletin of the American Astronomical Society, Vol. 33, Bulletin of the American Astronomical Society, pp. 829–+
- Cutri et al. (2005) Cutri R. M., et al., 2005, 2MASS All Sky Data Release and Extended Mission Products, Technical Report, Caltech, http://www.ipac.caltech.edu/2mass/releases/allsky/doc/explsup.html
- Dasyra et al. (2007) Dasyra K. M., Tacconi L. J., Davies R. I., Genzel R., Lutz D., Peterson B. M., Veilleux S., Baker A. J., Schweitzer M., Sturm E., 2007, ApJ, 657, 102
- Di Matteo et al. (2003) Di Matteo T., Croft R. A. C., Springel V., Hernquist L., 2003, ApJ, 593, 56
- Di Matteo et al. (2005) Di Matteo T., Springel V., Hernquist L., 2005, Nature, 433, 604
- Drinkwater et al. (1997) Drinkwater M. J., Webster R. L., Francis P. J., Condon J. J., Ellison S. L., Jauncey D. L., Lovell J., Peterson B. A., Savage A., 1997, MNRAS, 284, 85
- Efstathiou & Rowan-Robinson (1995) Efstathiou A., Rowan-Robinson M., 1995, MNRAS, 273, 649
- Efstathiou & Rowan-Robinson (2003) —, 2003, mnras, 343, 322
- Efstathiou et al. (2000) Efstathiou A., Rowan-Robinson M., Siebenmorgen R., 2000, MNRAS, 313, 734
- Engelbracht et al. (2007) Engelbracht C. W., et al., 2007, PASP, 119, 994
- Fabian (1999) Fabian A. C., 1999, MNRAS, 308, L39
- Ferrarese & Merritt (2000) Ferrarese L., Merritt D., 2000, ApJ, 539, L9
- Franceschini et al. (2003) Franceschini A., Braito V., Persic M., Della Ceca R., Bassani L., Cappi M., Malaguti P., Palumbo G. G. C., Risaliti G., Salvati M., Severgnini P., 2003, MNRAS, 343, 1181
- Francis et al. (2004) Francis P. J., Nelson B. O., Cutri R. M., 2004, AJ, 127, 646
- Francis et al. (2000) Francis P. J., Whiting M. T., Webster R. L., 2000, Publications of the Astronomical Society of Australia, 17, 56
- Gebhardt et al. (2000) Gebhardt K., Bender R., Bower G., Dressler A., Faber S. M., Filippenko A. V., Green R., Grillmair C., Ho L. C., Kormendy J., Lauer T. R., Magorrian J., Pinkney J., Richstone D., Tremaine S., 2000, ApJ, 539, L13
- Genzel et al. (1998) Genzel R., Lutz D., Sturm E., Egami E., Kunze D., Moorwood A. F. M., Rigopoulou D., Spoon H. W. W., Sternberg A., Tacconi-Garman L. E., Tacconi L., Thatte N., 1998, ApJ, 498, 579
- Georgakakis et al. (2004) Georgakakis A., Hopkins A. M., Afonso J., Sullivan M., Mobasher B., Cram L. E., 2004, MNRAS, 354, 127
- Glikman et al. (2004) Glikman E., Gregg M. D., Lacy M., Helfand D. J., Becker R. H., White R. L., 2004, ApJ, 607, 60
- Glikman et al. (2006) Glikman E., Helfand D. J., White R. L., 2006, ApJ, 640, 579
- Glikman et al. (2007) Glikman E., Helfand D. J., White R. L., Becker R. H., Gregg M. D., Lacy M., 2007, ApJ, 667, 673
- Gordon et al. (2003) Gordon K. D., Clayton G. C., Misselt K. A., Landolt A. U., Wolff M. J., 2003, ApJ, 594, 279
- Gordon et al. (2005) Gordon K. D., et al., 2005, PASP, 117, 503
- Gordon et al. (2007) —, 2007, PASP, 119, 1019
- Gregg et al. (2002) Gregg M. D., Lacy M., White R. L., Glikman E., Helfand D., Becker R. H., Brotherton M. S., 2002, ApJ, 564, 133
- Grogin et al. (2003) Grogin N. A., Koekemoer A. M., Schreier E. J., Bergeron J., Giacconi R., Hasinger G., Kewley L., Norman C., Rosati P., Tozzi P., Zirm A., 2003, ApJ, 595, 685
- Guyon et al. (2006) Guyon O., Sanders D. B., Stockton A., 2006, ApJS, 166, 89
- Haas et al. (2003) Haas M., Klaas U., Müller S. A. H., Bertoldi F., Camenzind M., Chini R., Krause O., Lemke D., Meisenheimer K., Richards P. J., Wilkes B. J., 2003, A&A, 402, 87
- Hall et al. (2002) Hall P. B., Richards G. T., York D. G., Keeton C. R., Bowen D. V., Schneider D. P., Schlegel D. J., Brinkmann J., 2002, ApJ, 575, L51
- Helou et al. (1985) Helou G., Soifer B. T., Rowan-Robinson M., 1985, ApJ, 298, L7
- Hopkins (2004) Hopkins A. M., 2004, ApJ, 615, 209
- Hopkins & Beacom (2006) Hopkins A. M., Beacom J. F., 2006, ApJ, 651, 142
- Hopkins et al. (2006) Hopkins P. F., Hernquist L., Cox T. J., Di Matteo T., Robertson B., Springel V., 2006, ApJS, 163, 1
- Hutchings et al. (2006) Hutchings J. B., Cherniawsky A., Cutri R. M., Nelson B. O., 2006, AJ, 131, 680
- Hutchings et al. (2003) Hutchings J. B., Maddox N., Cutri R. M., Nelson B. O., 2003, AJ, 126, 63
- Isobe et al. (1986) Isobe T., Feigelson E. D., Nelson P. I., 1986, ApJ, 306, 490
- Kauffmann & Haehnelt (2000) Kauffmann G., Haehnelt M., 2000, MNRAS, 311, 576
- Kauffmann & Haehnelt (2002) Kauffmann G., Haehnelt M. G., 2002, MNRAS, 332, 529
- Kawakatu et al. (2006) Kawakatu N., Anabuki N., Nagao T., Umemura M., Nakagawa T., 2006, ApJ, 637, 104
- Kawakatu et al. (2003) Kawakatu N., Umemura M., Mori M., 2003, ApJ, 583, 85
- Kewley et al. (2001) Kewley L. J., Dopita M. A., Sutherland R. S., Heisler C. A., Trevena J., 2001, ApJ, 556, 121
- King (2003) King A., 2003, ApJ, 596, L27
- Komossa et al. (2003) Komossa S., Burwitz V., Hasinger G., Predehl P., Kaastra J. S., Ikebe Y., 2003, ApJ, 582, L15
- Lavalley et al. (1992) Lavalley M. P., Isobe T., Feigelson E. D., 1992, in Bulletin of the American Astronomical Society, Vol. 24, Bulletin of the American Astronomical Society, pp. 839–840
- Lilly et al. (1995) Lilly S. J., Tresse L., Hammer F., Crampton D., Le Fevre O., 1995, ApJ, 455, 108
- Lipari (1994) Lipari S., 1994, ApJ, 436, 102
- Lípari et al. (2005) Lípari S., Terlevich R., Zheng W., Garcia-Lorenzo B., Sanchez S. F., Bergmann M., 2005, MNRAS, 360, 416
- Maddox et al. (2008) Maddox N., Hewett P. C., Warren S. J., Croom S. M., 2008, MNRAS, 386, 1605
- Magorrian et al. (1998) Magorrian J., Tremaine S., Richstone D., Bender R., Bower G., Dressler A., Faber S. M., Gebhardt K., Green R., Grillmair C., Kormendy J., Lauer T., 1998, AJ, 115, 2285
- Marble et al. (2003) Marble A. R., Hines D. C., Schmidt G. D., Smith P. S., Surace J. A., Armus L., Cutri R. M., Nelson B. O., 2003, ApJ, 590, 707
- Menci et al. (2004) Menci N., Fiore F., Perola G. C., Cavaliere A., 2004, ApJ, 606, 58
- Nandra et al. (2007) Nandra K., Georgakakis A., Willmer C. N. A., Cooper M. C., Croton D. J., Davis M., Faber S. M., Koo D. C., Laird E. S., Newman J. A., 2007, ApJ, 660, L11
- Netzer et al. (2007) Netzer H., Lutz D., Schweitzer M., Contursi A., Sturm E., Tacconi L. J., Veilleux S., Kim D.-C., Rupke D., Baker A. J., Dasyra K., Mazzarella J., Lord S., 2007, apj, 666, 806
- Pei (1992) Pei Y. C., 1992, ApJ, 395, 130
- Pierce et al. (2007) Pierce C. M., Lotz J. M., Laird E. S., Lin L., Nandra K., Primack J. R., Faber S. M., Barmby P., Park S. Q., Willner S. P., Gwyn S., Koo D. C., Coil A. L., Cooper M. C., Georgakakis A., Koekemoer A. M., Noeske K. G., Weiner B. J., Willmer C. N. A., 2007, ApJ, 660, L19
- Pozzetti & Mannucci (2000) Pozzetti L., Mannucci F., 2000, MNRAS, 317L, 17
- Richards et al. (2003) Richards G. T., Hall P. B., Vanden Berk D. E., Strauss M. A., Schneider D. P., Weinstein M. A., Reichard T. A., York D. G., Knapp G. R., Fan X., Ivezić Ž., Brinkmann J., Budavári T., Csabai I., Nichol R. C., 2003, AJ, 126, 1131
- Richards et al. (2002) Richards G. T., et al., 2002, AJ, 123, 2945
- Risaliti & Elvis (2004) Risaliti G., Elvis M., 2004, in Astrophysics and Space Science Library, Vol. 308, Supermassive Black Holes in the Distant Universe, Barger A. J., ed., pp. 187–+
- Rowan-Robinson (1995) Rowan-Robinson M., 1995, MNRAS, 272, 737
- Rowan-Robinson et al. (2005) Rowan-Robinson M., et al., 2005, AJ, 129, 1183
- Rowan-Robinson et al. (2008) —, 2008, MNRAS, 386, 697
- Sanders & Mirabel (1996) Sanders D. B., Mirabel I. F., 1996, ARA&A, 34, 749
- Sanders et al. (1988) Sanders D. B., Soifer B. T., Elias J. H., Neugebauer G., Matthews K., 1988, ApJ, 328, L35
- Schmidt & Green (1983) Schmidt M., Green R. F., 1983, ApJ, 269, 352
- Schneider et al. (2005) Schneider D. P., et al., 2005, AJ, 130, 367
- Schweitzer et al. (2006) Schweitzer M., Lutz D., Sturm E., Contursi A., Tacconi L. J., Lehnert M. D., Dasyra K. M., Genzel R., Veilleux S., Rupke D., Kim D.-C., Baker A. J., Netzer H., Sternberg A., Mazzarella J., Lord S., 2006, ApJ, 649, 79
- Silk & Rees (1998) Silk J., Rees M. J., 1998, A&A, 331, L1
- Soifer et al. (2004) Soifer B. T., et al., 2004, ApJS, 154, 151
- Spinoglio & Malkan (1989) Spinoglio L., Malkan M. A., 1989, ApJ, 342, 83
- Springel et al. (2005) Springel V., et al., 2005, Nature, 435, 629
- Stansberry et al. (2007) Stansberry J. A., et al., 2007, PASP, 119, 1038
- Storey & Hummer (1995) Storey P. J., Hummer D. G., 1995, MNRAS, 272, 41
- Urrutia et al. (2008a) Urrutia T., Becker R. H., White R. L., Glikman E., Lacy M., Hodge J., Gregg M. D., 2008a, ApJ accepted, arXiv:0808.3668
- Urrutia et al. (2008b) Urrutia T., Lacy M., Becker R. H., 2008b, ApJ, 674, 80
- van Dokkum (2001) van Dokkum P. G., 2001, PASP, 113, 1420
- Vanden Berk et al. (2001) Vanden Berk D. E., et al., 2001, AJ, 122, 549
- Veilleux et al. (2006) Veilleux S., Kim D.-C., Peng C. Y., Ho L. C., Tacconi L. J., Dasyra K. M., Genzel R., Lutz D., Sanders D. B., 2006, ApJ, 643, 707
- White et al. (2003) White R. L., Helfand D. J., Becker R. H., Gregg M. D., Postman M., Lauer T. R., Oegerle W., 2003, AJ, 126, 706
- Whiting et al. (2001) Whiting M. T., Webster R. L., Francis P. J., 2001, MNRAS, 323, 718
- Wilkes et al. (2002) Wilkes B. J., Schmidt G. D., Cutri R. M., Ghosh H., Hines D. C., Nelson B., Smith P. S., 2002, ApJ, 564, L65
- Zheng et al. (2002) Zheng X. Z., Xia X. Y., Mao S., Wu H., Deng Z. G., 2002, AJ, 124, 18