The isovector dipole strength in nuclei with extreme neutron excess
Abstract
The E1 strength is systematically analyzed in very neutron-rich Sn nuclei, beyond 132Sn until 166Sn, within the Relativistic Quasiparticle Random Phase Approximation. The great neutron excess favors the appearance of a deformed ground state for 142-162Sn. The evolution of the low-lying strength in deformed nuclei is determined by the interplay of two factors, isospin asymmetry and deformation: while greater neutron excess increases the total low-lying strength, deformation hinders and spreads it. Very neutron rich deformed nuclei may not be as good candidates as stable spherical nuclei like 132Sn for the experimental study of low-lying E1 strength.
pacs:
21.10.-k, 21.30.Fe, 21.60.Jz, 24.30.Cz, 25.20.Dc, 27.30.+tI Introduction
Collective modes of excitation are an universal feature of nuclei har01 . Involving a large majority of nucleons, these modes can provide crucial insight into exotic nuclear structure. For instance, the pygmy mode is known to be a consequence of a vibration involving the neutron skin paa07 against a core composed of neutrons and protons. Originally the increase of the low-lying strength was thought to be an exclusive phenomenon of heavy nuclei with large isospin asymmetry. But very similar excitation patterns have also been observed in light nuclei AETAL1999 ; TETAL2001 , and in medium-heavy stable nuclei wag08 ; sav06 ; sav08 . It has been also thoroughly investigated within a variety of theoretical tools REIN1999 ; paa07 ; TU2001 , including the RHB+RQRPA in spherical symmetry PNVR2005 ; PVR2005 ; VNPR2004 ; PRNV2003 , with different degrees of success in comparison with experimental data.
The next generation of RIB facilities, such as FAIR, Spiral2 or RIBF, will provide a wealth of new data on nuclear structure under extreme conditions, for example in nuclei closer to the drip line. Hence it is of interest to perform theoretical investigations on nuclear excitations under such conditions as extreme isospin or deformation. Specifically, the present work will focus on the study the E1 response in very neutron-rich tin isotopes, from 132Sn (where current experimental data stands) up to 166Sn.
Several experimental and theoretical studies available on the less neutron-rich part of the isotopic chain already provide some information on the character of the low-lying E1 response. In general, it has been found that the low-lying E1 strength increases with neutron excess paa07 , and that the collectivity of the excitations is rather high. Tin nuclei are spherical because of the Z=50 shell closure. However it is believed that for strong neutron excess (beyond A 140), the large diffuseness of the density induces a weakening of the spin-orbit potential dob94 ; LVPR.98 , and therefore the disappearance of the shell closure, allowing for deformed nuclei. This means that in order to describe low energy excitations in these very neutron-rich nuclei, beyond 132Sn, a model including both pairing and deformation is required. More generally, most nuclei in the nuclear chart are deformed, which requires to investigate the interplay between the low-lying E1 strength and deformation when going towards the drip-line. The aim of this work is to investigate the influence of deformation on the low-lying E1 strength for neutron-rich nuclei.
The recently developed pen08 relativistic deformed QRPA approach (RQRPAZ), provides a viable microscopical framework where deformation and pairing correlations are included in a fully self-consistent fashion. It should also be noted that the evolution of the giant dipole resonance with respect to neutron excess and deformation has not been investigated yet in a self-consistent microscopic framework. The manuscript is organized as follows: in the first section of this work we first very briefly recall the RHB and RQRPA formalism. In Section II we present the ground-state properties of the 132-166Sn chain of nuclei as calculated with the parameter set NL3 NL3 , and study the electric dipole response in the GDR and PDR energy regions, concentrating on the low-lying E1 strength. The last section is devoted to a brief summary and the conclusions.
II Deformed RHB and QRPA formalism
A detailed discussion of deformed Relativistic Hartree Bogoliubov (RHB) and Relativistic Random Phase Approximation for axially deformed systems can be found in references GRT.90 and pen08 , respectively. Therefore, only the basic theory will be outlined, and details given where extensions, like the inclusion of pairing at the RPA level, are specific to this work.
The starting point is an effective Lagrangian density
| (1) |
refers to the Lagrangian of the free nucleon
| (2) |
where is the bare nucleon mass and denotes the Dirac spinor. is the Lagrangian of the free meson fields and the electromagnetic field
| (3) |
with the corresponding masses , , . The interaction Lagrangian is given by minimal coupling terms
| (4) |
where , , and are the respective coupling constants for the , , and photon fields. However, this simple linear interaction does not provide a quantitative description of complex nuclear systems, and an effective density dependence needs to be introduced. Historically, the first BB.77 was the inclusion of non-linear self-interaction terms in the meson part of the Lagrangian in the form of a quartic potential
| (5) |
which includes the non-linear self-interactions with two additional parameters and . This particular form of the non-linear potential has become standard in applications of RMF functionals, although additional non-linear interaction terms, both in the isoscalar and isovector channels, have been considered over the years Bod.91 ; TM1 ; SFM.00 ; HP.01 .
Two other approaches, of more recent development, can also be found in the literature, based on the introduction of the density dependence directly in the coupling constants TW.99 ; DD-ME1 ; DD-ME2 and on the expansion of the meson propagators into zero-range couplings and gradient correction terms BMM.02 ; NVLR.08a ; NVLR.08b . In particular, the description of the isovector channel has been greatly improved, which is important for the quantitative description of neutron skins and low-lying excitations. For example, non-linear density functionals are known to consistently overestimate neutron skins DD-ME1 ; SR.92 . However, this discussion will be restricted only to non-linear density functionals with the NL3 parameter set: the increased computational requirements needed, for example, to do the same calculations with density functionals with density-dependent coupling constants, are such that they make unfeasible to compute as big isotopic chain as 132-166Sn, that includes many deformed nuclei, at the time of this writing. However, work in this direction is in progress.
The Hamiltonian density can be derived from the Lagrangian density of Eq. (1) as the (0,0) component of the energy-momentum tensor, leading the to the energy functional (for details see Ref. VALR.05 ).
| (6) |
In nuclei with open shells this simple covariant energy functional fails, in general, to properly describe the nuclear many-body system. It is thus necessary to introduce an additional field, the pairing potential. In order to include pairing correlations in a microscopic way, the meson fields need to be quantized, so as to gain one meson exchange two-body forces KR91 (i.e terms of the form ). It is possible, however, to follow a phenomenological approach and introduce a generalized Valatin density Vala61
| (7) |
where is the single-particle density and is the pairing density, and extend the energy functional to additionally depend on it
| (8) |
where, in general, the pairing energy density can be expressed as
| (9) |
for some yet to be defined effective pairing interaction .
For computational efficiency reasons, the results presented in this investigation have been obtained using a simple monopole-monopole pairing interaction with a smooth cutoff window Bon85 , which can be written as
| (10) |
where is the pairing window, its diffuseness, and are the eigenvalues of the Dirac single-particle Hamiltonian. This leads to the gap equation
| (11) |
To study vibrational excitations, one introduces small harmonic oscillations around the ground state generalized density and expands the equation of motion Ring80 up to linear order, gaining the RPA approximation, which in standard matrix form reads
| (12) |
where the refers to the forward and backward amplitudes of the transition density.
The matrix elements of the residual interaction are the second derivatives of the energy functional with respect to the single particle density
| (13) |
Similarly, the matrix elements are given by the second derivative of the energy functional, but this time with respect to the pairing density
| (14) |
The ph matrix elements are calculated using a Fourier-Bessel decomposition in cylindrical coordinates thes07 ; pen08 . The transition matrix elements from the ground state to an excited state for a one-body external operator are given by
| (15) |
where depending on the time reversal properties of the operator : if it is positive under time reversal, and otherwise. The transition densities can be calculated with the help of Eq. (15) using for the density operator in coordinate space
| (16) |
which can be written for an axially symmetric system as thes07 ; pen08
| (17) |
The two dimensional quantities will be plotted when discussing intrinsic transition densities. Projection of the transition densities to the laboratory frame is accomplished using the needle approximation Ring80 , where the radial part (for a given external operator angular momentum L) can be calculated from the intrinsic transition densities as
| (18) |
The definition of the quadrupole deformation parameter used throughout this work as a measure of deformation is
| (19) |
where the sub-indices refer to neutron, proton and total densities (), particle number () and deformation (); and (fm).
III The very neutron-rich Sn isotopes
III.1 Ground state and deformation
Table 1 contains some of the bulk ground-state properties of the 132-166Sn isotopic chain, as calculated with covariant DFT with the NL3 parameter set. Since there is only scarce mass data for such neutron rich nuclei, the monopole pairing constants of the energy density functional were, for a fixed pairing window ( MeV, fm), adjusted to reproduce the corresponding pairing gaps calculated with the parameter set D1S in the Gogny calculations of Ref. Hilaire02 . For the diagonalization of the Dirac Hamiltonian, an expansion in anisotropic harmonic oscillator wave-functions with N=20 major shells was used . The calculated RHB binding energies are in very good agreement with the two available experimental values for 132,134Sn aud03 : B/A = -8.355 MeV and -8.276 MeV, respectively. For 132Sn it is not very surprising since the NL3 parameter set was adjusted including experimental data from this very same nucleus. However, the agreement in the case of 134Sn provides a sound basis for our pairing prescription. The results of table 1 are also in very good agreement with the calculations in Ref. LRR.99 . Small differences have their origin in the different treatment of pairing.
| A | E/A (MeV) | Rn (fm) | Rp (fm) | R (fm) | |||
|---|---|---|---|---|---|---|---|
| 132 | -8.362 | 4.99 | 0.00 | 4.64 | 0.00 | 4.86 | 0.00 |
| 134 | -8.283 | 5.08 | 0.00 | 4.66 | 0.00 | 4.93 | 0.00 |
| 136 | -8.193 | 5.15 | 0.00 | 4.67 | 0.00 | 4.98 | 0.00 |
| 138 | -8.099 | 5.20 | 0.00 | 4.69 | 0.00 | 5.02 | 0.00 |
| 130 | -8.010 | 5.25 | 0.00 | 4.71 | 0.00 | 5.06 | 0.00 |
| 142 | -7.931 | 5.30 | 0.13 | 4.74 | 0.07 | 5.11 | 0.11 |
| 144 | -7.852 | 5.35 | 0.20 | 4.78 | 0.13 | 5.16 | 0.17 |
| 146 | -7.775 | 5.34 | 0.19 | 4.80 | 0.13 | 5.20 | 0.17 |
| 148 | -7.699 | 5.45 | 0.18 | 4.82 | 0.13 | 5.25 | 0.16 |
| 150 | -7.626 | 5.52 | 0.33 | 4.89 | 0.27 | 5.32 | 0.31 |
| 152 | -7.547 | 5.56 | 0.33 | 4.92 | 0.28 | 5.36 | 0.32 |
| 154 | -7.471 | 5.60 | 0.32 | 4.93 | 0.28 | 5.34 | 0.31 |
| 156 | -7.396 | 5.65 | 0.31 | 4.94 | 0.27 | 5.43 | 0.29 |
| 158 | -7.321 | 5.69 | 0.29 | 4.95 | 0.26 | 5.46 | 0.28 |
| 160 | -7.247 | 5.73 | 0.26 | 4.96 | 0.24 | 5.50 | 0.25 |
| 162 | -7.169 | 5.75 | 0.19 | 4.95 | 0.18 | 5.51 | 0.18 |
| 164 | -7.123 | 5.76 | 0.00 | 4.91 | 0.00 | 5.52 | 0.00 |
| 166 | -7.048 | 5.80 | 0.00 | 4.93 | 0.00 | 5.55 | 0.00 |
Fig. 1 shows the evolution of the quadrupole deformation parameter (19), for each nucleon species as well as the total, with increasing neutron number. From 132Sn up to 140Sn the mean field equations show a very well defined spherical minimum in the potential energy surface. Coincidentally with the fill up of the 1h9/2 level, a minimum with axial deformation appears for 142Sn. Deformation remains moderate () until 150Sn, where the 2f7/2 fills. From then on, deformation varies smoothly until 164Sn, where tin nuclei become spherical again due to the proximity of the N=126 shell closure.
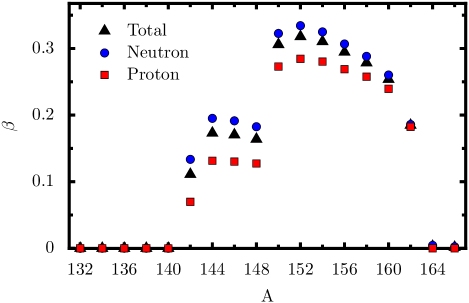
When deformation sets in at 142Sn, the neutron and proton density profiles show different deformations for neutrons and protons. This effect, that can also be found in calculations performed with other relativistic models, and in non-relativistic mean-field models using the Gogny force webb3 , is counter-intuitive if one considers the strong neutron-proton nuclear interaction. However, one should also remember that even though the proton-neutron interaction is strong enough to make stable semi-magic nuclei spherical, neutron skins are still found for neutron rich nuclei. It can thus be expected for deformed neutron-rich nuclei to not exhibit the same quadrupole deformations for the proton and neutron densities. Coming back to Fig. 1, from 142Sn, as more neutrons are added, this difference in the parameter is reduced to almost zero for the last deformed nucleus, 162Sn. This reduction in the difference of deformations might be explained by a progressive weakening of the spin-orbit interaction due to the increased diffuseness of the neutron density as more weakly bound neutrons are added.
These results compare rather well with predictions obtained using a model with a more sophisticated pairing scheme. For example, a deformed HFB approach with D1S Gogny functional shows that there is a transition from spherical to deformed shape at 147Sn, and that spherical symmetry is not restored until 163Sn webb3 . It is surprising, however, that the main differences in the predicted deformation of the tin isotopes between both approaches happen at the beginning of the chain, near the valley of -stability, where both forces, NL3 and DS1, were adjusted.
It should also be noted that the deformed tin nuclei are rather soft (i.e. the potential energy surface is almost flat), both in the present study and in results from webb3 . The flatness of the potential energy surface can be linked to quantum shape phase transitions nik07 , which have a definite effect on the vibrational response. They may be studied specifically on the isovector dipole response and deserve further consideration, even though it falls outside the scope of the present manuscript.
III.2 Response in the GDR region
The RPA matrix equation was numerically solved by reduction to, and subsequent diagonalization of, a non-Hermitian matrix of half the dimension (for technical details please refer to Ref. Papa07 ). The large configuration space provided by a N=20 shells mean-field ground state makes unfeasible its complete inclusion for the diagonalization of the RPA matrix. Thus, the number of qp-pairs considered was truncated to approximately 16-20 thousand (depending on the nucleus) out of 60 thousand , attending to energy and occupation considerations. In particular, the energy cutoff for particle-hole and antiparticle-hole pairs was set at 50 MeV and -1600 MeV, respectively. See Refs. DF.90 ; RMG.01 for a in-depth discussion about the need to include anti-particle states in the calculation of the RPA response within the no-sea approximation. In addition, since the E1 response is calculated within the same nucleus, the contribution of pairs that connect to neighboring nuclei is small, and, in order to further reduce the configuration space to a manageable dimension, the relation was also imposed on the pairs.
This drastic truncation of the RPA configuration space induces a small lack of self-consistency, and thus the translational spurious mode does not decouple at exactly zero energy. Nevertheless, it was found reasonably close to zero for all the nuclei in the isotopic chain, in the 0.5–0.8 MeV range. Moreover, it was checked that the overlap of the spurious operator, in this case the total linear momentum of the nucleus , with the actual E1 response obtained in the calculations, was minimal: the isoscalar components in the RPA transition densities do not come from admixtures with the spurious mode, but correspond to the actual response of the nuclear system to the E1 operator. This is very important in particular for the study of the low-lying E1 strength, where one expects the appearance of mixed isospin excitation modes like the pygmy resonance.
As mentioned before, there is no self-consistent RQRPA analysis of the evolution of the GDR in deformed nuclei along an isotopic chain. We shall therefore very briefly analyze this mode, although pairing and deformation effects are expected to play a less important role for these high energy collective modes.
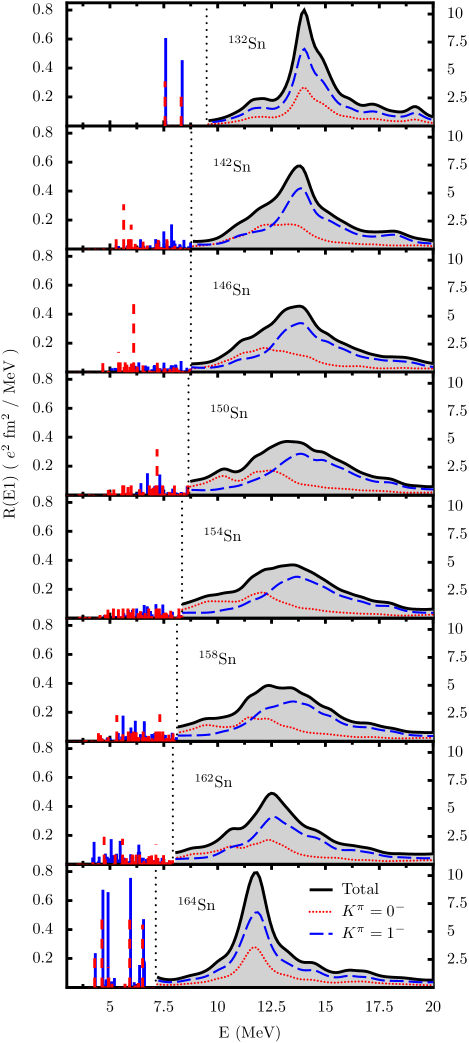
Fig. 2 displays the evolution of the isovector dipole response in Tin isotopes with increasing number of neutrons, from 132Sn to 166Sn. The response is separated in two different regions. The Giant Dipole Resonance region, to the right of the dotted vertical line, shows the response obtained through diagonalization of the RPA matrix folded with a 1 MeV Lorentzian. The dotted (red) curve corresponds to excitations along the symmetry axis, with , while the dashed (blue) curve are those perpendicular to the symmetry axis, with . The total added dipole response corresponds to the shaded region within the solid (black) line. On the other hand, the low-energy region, to the left of the dotted vertical line, shows the response without folding in order to be able to distinguish details. Dashed (red) and solid (blue) lines correspond to and peaks, respectively.
It is not possible to choose a fixed energy threshold that separates the giant dipole and pygmy regions along the whole isotopic chain. For very neutron rich nuclei, the low-energy GDR tail comes down below any reasonable fixed threshold that could be chosen for all the nuclei. Therefore, a simple procedure was adopted to separate the pygmy and giant dipole regions: first, a threshold energy is chosen in a spherical nucleus where the separation is clear (in this case it is in 132Sn at 9.5 MeV). Then, for the rest of the nuclei in the chain, the threshold is reduced the same amount the centroid of the E1 response (as calculated using energy moments over the full energy range 0-30 MeV) decreases, as compared to the chosen reference nucleus. It was checked that this simple procedure ensures that peaks with pygmy and giant dipole nature are well separated in all cases, and that the relative values of the summed low-lying strengths presented are stable to changes in the threshold energy. This last point is particularly important since the following analysis and its conclusions depend on the relative total low-lying strengths, and not in their absolute value which, of course, is determined by the chosen energy threshold.
| A | B(E1) | Ethres | B(E1) | |
|---|---|---|---|---|
| (MeV) | (% TRK) | (MeV) | (% TRK) | |
| 132 | 15.1 | 110.0 | 9.4 | 2.9 |
| 134 | 15.2 | 108.4 | 9.5 | 3.2 |
| 136 | 15.1 | 107.3 | 9.4 | 3.5 |
| 138 | 15.0 | 106.0 | 9.2 | 3.9 |
| 140 | 14.8 | 104.6 | 9.0 | 4.3 |
| 142 | 14.6 | 104.1 | 8.7 | 4.4 |
| 144 | 14.7 | 103.6 | 8.8 | 4.2 |
| 146 | 14.7 | 102.5 | 8.7 | 4.5 |
| 148 | 14.7 | 101.6 | 8.7 | 4.6 |
| 150 | 14.5 | 101.3 | 8.6 | 4.6 |
| 152 | 14.4 | 100.7 | 8.4 | 4.5 |
| 154 | 14.3 | 99.8 | 8.3 | 4.8 |
| 156 | 14.2 | 99.0 | 8.2 | 4.9 |
| 158 | 14.1 | 98.2 | 8.1 | 5.0 |
| 160 | 14.1 | 97.3 | 8.0 | 5.2 |
| 162 | 14.1 | 96.9 | 7.9 | 5.3 |
| 164 | 13.6 | 94.3 | 7.1 | 6.8 |
| 166 | 13.7 | 94.4 | 7.2 | 7.1 |
Regarding the region above the pygmy threshold, as plotted in Fig. 1, two phenomena concerning the evolution of the GDR strength are readily observable: i) The centroid position of the GDR shifts to lower energies with increased particle number, and ii) the width of the GDR increases with deformation and particle number. These features are already known from many studies har01 , but it is checked here for the first time using a self-consistent approach, and more generally on very neutron-rich nuclei. The net effect is that the dipole response becomes very soft for deformed nuclei.
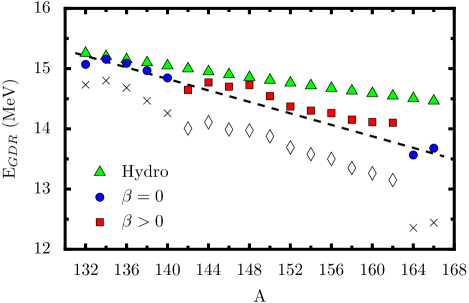
In the upper panel of Fig. 3 the GDR centroid position dependence on the mass number is plotted, as well as the predictions of the hydrodynamical model har01 (green triangles). The RQRPAZ values (blue circles and red squares) were calculated as the energy centroids of the response, from the threshold energy (see Table 2) up to 30 MeV. The dashed line indicates a least-squares fit to the GDR position of spherical nuclei. As expected, the differences increase when going away from the valley of stability. The crosses and diamonds indicate the centroid QRPA energy as calculated when including the whole energy interval, from 0 Mev to 30 MeV. Their deviation from the squares and circles show that the low-lying strength plays an increasingly important role with the addition of neutrons, i.e., the E1 distribution cannot be considered to be composed of only a very well developed GDR peak.
Even though it falls outside the scope of this investigation, it would be interesting to study the same isotopic chain using parameters sets and functional forms of the covariant Lagrangian. Measurements of the GDR could be used to further constrain the isospin dependence of the density functional, which would have direct applications to nuclear structure and astrophysical problems Khan.02 ; Khan.04 .
As expected, for spherical nuclei the excitation peaks for both the and modes lie at the same energies (Fig. 2, 132Sn and 164Sn). However, once the nucleus becomes deformed, they split. In principle, for prolate nuclei, as is the case for the studied Tin isotopes, the strength coming from the mode should appear at lower energies compared to the mode. An intuitive argument to explain this phenomenon recalls a very simple picture where the nuclear potential must be flatter (more extended) along the symmetry axis, and thus it is more favorable energetically for the nucleons to oscillate in that direction () than perpendicular to the symmetry axis (), where the nuclear potential is narrower Dan.58 .
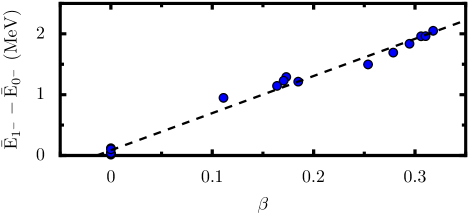
Since deformation is the cause of the GDR splitting, it is possible, in principle, to relate the nuclear deformation with the energy separation of the two -modes. In the lower panel of Fig. 3 is plotted the GDR splitting along the 132-166Sn isotopic chain versus the quadrupole deformation parameter . There is an approximate linear relation between the two parameters, as was already predicted by hydrodynamical models har01 .
To finish with this brief analysis of the dipole strength in the Giant Dipole region, Table 2 also displays the strength exhausted by the GDR in percents of the classical Thomas-Reihe-Kuhn (TRK) sum rule. The sharp decrease in strength is constant along the isotope chain, proportional to the enhancement of low-lying response, and no big effects due to deformation can be observed. Obviously, for spherical nuclei the contribution to the response strength coming from the mode is found to be double than that of the mode. However, for deformed nuclei the share of strength exhausted by the mode increases slightly up to 37% for the most deformed nucleus in the chain, 152Sn.
III.3 Low-lying dipole response
The nature of the low-lying dipole response in neutron-rich nuclei is currently under discussion sav08 ; paa07 . All of the available microscopic models predict an increase in dipole strength below 10 MeV for nuclei with high isospin asymmetry, but differ on basic details, like excitation patterns or collectivity of the low-lying modes. For example, for light nuclei, models based on covariant DFT obtain the already well-known pygmy structure, while on non-covariant models the response in this energy region is composed of single-particle excitation peaks paa07 . The low-lying E1 strength in spherical Tin isotopes (from 114Sn to 140Sn) has been studied within spherical RQRPA in Ref. PNVR2005 , showing that with increasing neutron number i) the share of strength exhausted by the low-lying part is generally enhanced, ii) the centroid position of the low-lying modes decreases.
Nuclei with extreme isospin asymmetry such as 140Sn will be accessible in next generation experimental facilities, and their study will hopefully shed light on the nature of the low-lying dipole strength. It is thus relevant to study the predictions of the different theoretical models on exotic nuclei. Of course, as most of these nuclei are expected to be deformed, theoretical models should make explicit allowance for the deformation degree of freedom. In this regard, recent advances have been also made with non-relativistic models using the Gogny Sophie.08 , and Skyrme forces Giai.08 .

In the case of the present investigation within the RQRPA model in Tin isotopes, the left panels in Fig. 2 show that the response in the energy region below the threshold becomes more spread with increasing neutron excess, up to the restoration of spherical symmetry in 164Sn, where it shows again only a few contributing peaks. It is evident that for the most deformed nuclei (i.e. ), 150-162Sn, the low-lying strength tends to be distributed into many different peaks, without any one of them dominating the response. For mildly deformed nuclei () there is also significant Landau damping, even though a single (most cases) or several (as for example in 162Sn) peaks clearly stand from the background response. The overall conclusion is that deformation distributes the low-lying strength, irregardless of the number of excess neutrons.
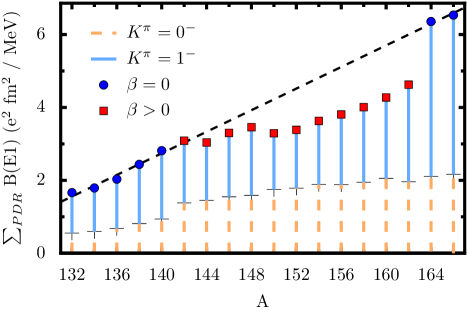
To assert if, and to what extent, the low-lying response is in general affected by deformation, it is interesting to concentrate on the total low lying strength. Fig. 4 shows the summed response up to the threshold energy versus the mass number for the whole isotopic chain. Again (blue) circles and (red) squares refer to spherical and deformed nuclei, respectively. The dashed line, which is a least squares fit to the data points for spherical nuclei, clearly indicates that, all things being equal, for spherical nuclei the low-lying strength increases almost linearly with neutron number. It is important to note, however, that studies within the RQRPA paa07 in the spherical 100-132Sn nuclei, show that this trend is reversed near a shell closure, in this particular isotopic chain approaching the neutron number N=82. Between 126Sn and 132Sn one finds a decrease of the PDR strength (see paa07 and references therein).
However, Fig. 4 also shows that the linear link between the addition of neutrons and an increase in total low-lying strength is no longer kept for deformed nuclei, where the growth is less pronounced. Furthermore, for nuclei where deformation most dramatically increases, from 148Sn to 150Sn, and to the most deformed 152Sn, the summed low-lying strength even decreases with the addition of two neutrons. As stated before, it has been checked that this is not due to the particular energy threshold chosen, and therefore, it has to be concluded that deformation quenches the dipole response in the low-lying energy region.
The origin of this quenching can be further analyzed looking at the vertical lines that mark each data point in Fig. 4, which show the decomposition of the strength into contributions coming from and modes. For spherical nuclei the mode carries two thirds of the total response, while the mode provides the rest. However, for deformed nuclei in the isotopic chain the contribution from the mode increases (in the case of the most deformed nucleus 152Sn it reaches almost 60% of the total), while that from the mode significantly decreases. Thus, there is a quenching of the mode and a smaller enhancement of the mode, that leads to an overall quenching of the dipole strength in the low-lying region.
Since this reduction comes mainly from the mode, it is likely that there is a geometrical interpretation. It is important to realize, however, that the validity of such a geometrical picture depends very much on the collectivity and excitation structure of the RPA peaks. In other studies within spherical RQRPA paa07 it has been found that the dominant low-lying peaks in this region of the nuclear chart show a rather collective structure, with a very characteristic pattern for the transition densities which support the common interpretation of the low-lying strength as the pygmy dipole resonance, a collective vibration of the skin of excess neutron against a T=0 core. Furthermore, a study using deformed RQRPA in 100Mo () pen08b shows that, at least for stable nuclei, deformation does not destroy neither the excitation pattern nor the collectivity of the PDR, but merely splits the response into different peaks for the different modes.
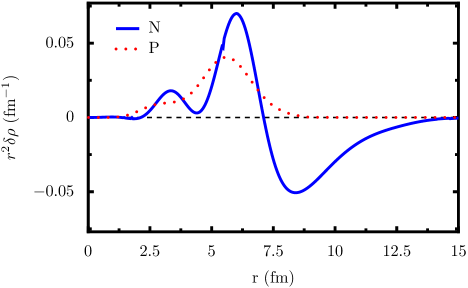
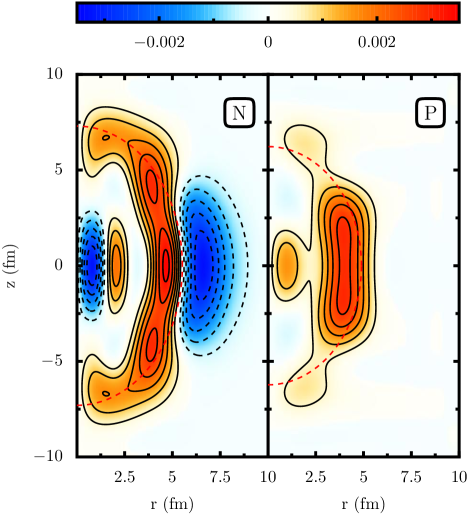
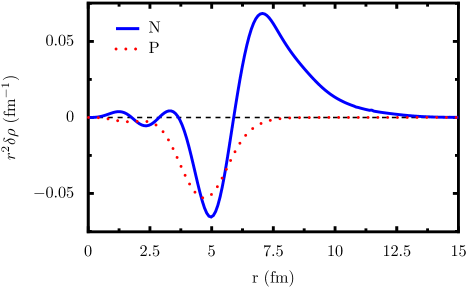
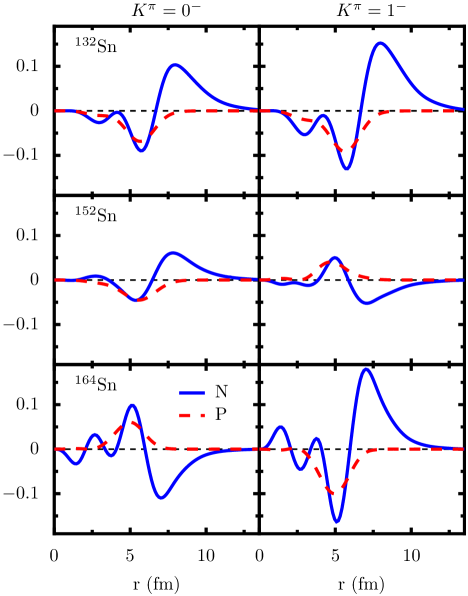
To gain insight on the geometrical nature of the low-lying excitations one has to look at the transition densities (17), which are in the case of axially deformed nuclei functions depending on the two coordinates along () and perpendicular () to the symmetry axis. It has been found that along the full chain of Tin isotopes under study, a pygmy-like structure was present in the most dominant peaks in the low-lying energy region. As an example, Figs. 5 and 6 show, in the upper panel, the 2D transition densities of the (at 7.2 MeV) and (at 7.3 MeV) peaks in 152Sn. The upper panel of Fig. 5 shows the typical pygmy excitation pattern: inside the dotted line, the nuclear interior, the transition densities for neutrons (left) and protons (right) are in phase (same sign, i.e. same kind of contour lines and same color shading), while in the surface region, outside the dotted (red) line, they are out of phase in the case of neutrons, and non-existent for protons. In the specific case of Fig. 5, since it is the transition density for a mode, the vibration takes place along a perpendicular of the symmetry axis, i.e., the skin of neutrons (left panel, ) is concentrated at the caps of the prolate nuclear shape, along the symmetry axis. On the other hand, on the upper panel of Fig. 6 is plotted a mode, and thus the excitation is along a perpendicular of the symmetry axis, i.e. the neutron skin ( fm) is concentrated around the equator.
The 2D transition densities are referred to the intrinsic frame of reference, where only the total angular momentum projection is a good quantum number, i.e., they are expected to contain admixtures from all possible angular momenta. Since the E1 transition operator is a 1-rank tensor, it is expected that the major contributions of the transition densities to the total response come from the angular momentum. It is therefore interesting to obtain the actual transition density that would be observed in the laboratory frame of reference, after projection to . The lower panels of Figs. 5 and 6 show the radial part of the transition densities after such a projection procedure. The pygmy pattern is easily recognizable, and is very similar to those obtained in spherical systems: in the nuclear interior both neutrons and protons oscillate in-phase, out-of-phase with the skin where only neutrons contribute.
This pattern is observed for both -modes for the non-negligible excitation peaks in the low-lying region across the isotopic chain. Fig. 7 shows, as an example, a comparison of the projected transition densities for some selected spherical and deformed cases. Obviously there is a direct correlation between the share of strength coming from the different -modes and their transition density amplitudes. For example, for 152Sn, where the contribution to the strength from the mode is slightly larger than that of the mode, the transition densities show a similar magnitude. This is in contrast to spherical nuclei where it is trivial that the one third/two thirds ratio is exactly preserved for both total response strength and transition density amplitude. In addition, and even though the total response decreases, the share of strength from the response increases with deformation (e.g. in Fig. 4 from 140Sn to 142Sn).
The analysis of the single-particle structure of the peaks reveal that their overall collectivity, measured as the number of contributing qp-pairs, is comparable with those peaks in the GDR energy region. In all the cases except of 132Sn, the collectivity of the low-energy states is further enhanced due to the opening of the neutron shell and the increased number of two-quasiparticle configurations which contribute to the low-lying states. In particular, the proton contribution does not exceed 10% of the total in any of the cases, and is usually around 3–4%. This is in good agreement with previous RQRPA results in spherical systems, where similar collectivity and proton contribution has been reported paa07 . Finally, expanding the single-particle wave-functions in an anisotropic harmonic oscillator basis, one finds that usually there is one dominant factor in the series, that can be used qualitatively as a label. This provides insight into the kind of single-particle excitations that compose each RPA peak (for details, see pen08 ). In this regard, the pygmy resonance shares the same structure as the GDR, in so far as both of them involve a change in major quantum number of .
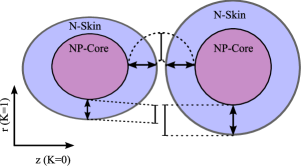
Delving deeper into the reason why the response is reduced with deformation, it is useful to look at a schematic diagram of the differences between the spherical and deformed cases. Fig. 8 portrays the basic feature found for the deformed Tin isotopes under study, namely that the deformation of the proton density is lower than that of the neutron density. This means that the thickness of the neutron skin is reduced along a perpendicular of the symmetry axis and this leads to a reduction of the strength for the mode. This disturbs the simple 1:2 rule of the spherical case. This reduction is obviously not fully compensated by a corresponding increase of the strength of the mode. Of course the details depend on the properties of the orbits occupied by the additional neutrons, which cannot be explained in this simple picture.
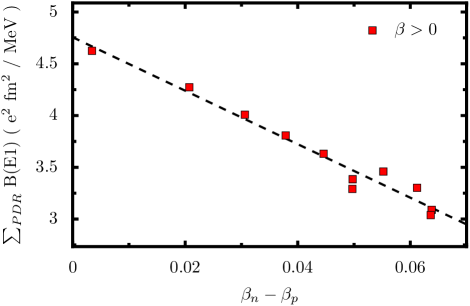
In Fig. 9 is plotted the total pygmy strength dependence on the difference of deformations for the ground state neutron and proton densities . It shows that both are linearly linked. This result is equivalent to the situation found in spherical nuclei, where the neutron skin thickness determines the total low-lying pygmy strength. However, in the deformed case, in addition to the difference in neutron-proton densities radii, the difference of quadrupole deformations comes into play to determine the total low-lying strength. For the cases presented in this manuscript, i.e. prolate nuclei, this produces a reduction in strength in the mode. For oblate nuclei with different proton and neutron deformations it is therefore plausible to expect a similar reduction in overall low-lying strength, caused in this case by a reduced neutron skin along the symmetry axis and thus a reduced strength. In summary, the reduced skin thickness along a perpendicular of the symmetry axis, caused by the different deformations of the neutron and proton densities, might explain the reduction in strength of the pygmy resonance in the deformed Tin isotopes under study.
IV Conclusions
The isovector dipole strength in very neutron-rich tin isotopes has been studied using a fully self-consistent deformed QRPA model based on relativistic DFT. The parameter set used in the Lagrangian is NL3 NL3 with a monopole force in the pairing channel. The coupling constants of the pairing interaction were adjusted to reproduce the gap values predicted by the DS1 Gogny force Hilaire02 . Due to the weakening of the Z=50 shell closure, deformation appears for tin nuclei around 142Sn. In the vicinity of the N=126 shell closure, beyond 164Sn, spherical symmetry is restored again. Therefore axial deformation was included explicitly in these calculations.
The analysis of the evolution of the Giant Dipole Resonance along an isotopic chain confirms that the Relativistic Quasiparticle Approximation reproduces basic features predicted by macroscopic hydrodynamical models, namely the reduction of the centroid position and the splitting of the response in two modes due to deformation. However the hydrodynamical models and the RQRPA GDR position predictions are at variance in the case of very neutron-rich nuclei. Furthermore, it has been confirmed that th GDR splitting depends linearly on the deformation.
Regarding the low-lying E1 response, it has been found that deformation hinders the dipole strength in this region. This effect has been linked to the suppression of vibrations along a perpendicular of the symmetry axis ( mode) for prolate deformed systems, and explained by the reduction of neutron skin in this direction caused by the difference in deformation of the neutron and proton densities. On the other hand, the low-lying E1 strength increases with the neutron number, and thus the interplay of these two effects determines the actual low-lying dipole response in deformed nuclei.
The analysis of the excitation peaks shows that, even if the low-lying strength is quenched and spread in deformed nuclei, it nevertheless shows pygmy character, with a neutron skin oscillating against neutron-proton core. The number of contributing qp-pairs is comparable to that found in the GDR region, and in agreement with other RQRPA studies in spherical nuclei. It is therefore concluded that for deformed nuclei with extreme isospin asymmetry the pygmy mode subsists, but is more spread than in spherical nuclei. Hence, prominent pygmy modes may be a specific characteristic of spherical neutron rich nuclei which are not too far from the valley of stability.
Acknowledgments The authors wish to thank D. Vretenar for fruitful discussions. The paper has also been supported by the Bundesministerium für Bildung und Forschung, Germany under project 06 MT 246 and by the DFG cluster of excellence “Origin and Structure of the Universe” (www.universe-cluster.de).
References
- (1) M. N. Harakeh and A. van der Woude, Giant Resonances (Oxford University Press, Oxford, 2001).
- (2) N. Paar, D. Vretenar, E. Khan, and G. Coló, Rep. Prog. Phys. 70, 691 (2007).
- (3) T. Aumann et al, Nucl. Phys. A649, 297c (1999).
- (4) E. Tryggestad et al, Nucl. Phys. A687, 231c (2001).
- (5) A. Wagner, R. Beyer, M. Erhard, E. Grosse, A. R. Junghans, J. Klug, K. Kosev, C. Nair, N. Nankov, G. Rusev, K. D. Schilling, and R. Schwengner, J. Phys. G35, 014035 (2008).
- (6) D. Savran, M. Babilon, A. M. van den Berg, M. N. Harakeh, J. Hasper, A. Matic, H. J. Wörtche, and A. Zilges, Phys. Rev. Lett. 97, 172502 (2006).
- (7) D. Savran, M. Fritzsche, J. Hasper, K. Lindenberg, S. Miller, V. Y. Ponomarev, K. Sonnabend, and A. Zilges, Phys. Rev. Lett. 100, 232501 (2008).
- (8) P.-G. Reinhard, Nucl. Phys. A649, 105c (1999).
- (9) M. Tohyama and A. S. Umar, Phys. Lett. B516, 415 (2001).
- (10) N. Paar, T. Nikšić, D. Vretenar, and P. Ring, Phys. Lett. B606, 288 (2005).
- (11) N. Paar, D. Vretenar, and P. Ring, Phys. Rev. Lett. 94, 182501 (2005).
- (12) D. Vretenar, T. Nikšić, N. Paar, and P. Ring, Nucl. Phys. A731, 281 (2004).
- (13) N. Paar, P. Ring, T. Nikšić, and D. Vretenar, Phys. Rev. C67, 034312 (2003).
- (14) J. Dobaczewski, I. Hamamoto, W. Nazarewicz, and J. Sheikh, Phys. Rev. Lett. 72, 981 (1994).
- (15) G. A. Lalazissis, D. Vretenar, W. Pöschl, and P. Ring, Phys. Lett. B418, 7 (1998).
- (16) D. Pena Arteaga and P. Ring, Phys. Rev. C77, 034317 (2008).
- (17) Y. K. Gambhir, P. Ring, and A. Thimet, Ann. Phys. (N.Y.) 198, 132 (1990).
- (18) J. Boguta and A. R. Bodmer, Nucl. Phys. A292, 413 (1977).
- (19) A. R. Bodmer, Nucl. Phys. A526, 703 (1991).
- (20) Y. Sugahara and H. Toki, Nucl. Phys. A579, 557 (1994).
- (21) M. M. Sharma, A. R. Farhan, and S. Mythili, Phys. Rev. C61, 054306 (2000).
- (22) C. J. Horowitz and J. Piekarewicz, Phys. Rev. C64, 062802 (2001).
- (23) S. Typel and H. H. Wolter, Nucl. Phys. A656, 331 (1999).
- (24) T. Nikšić, D. Vretenar, P. Finelli, and P. Ring, Phys. Rev. C66, 024306 (2002).
- (25) G. A. Lalazissis, T. Nikšić, D. Vretenar, and P. Ring, Phys. Rev. C71, 024312 (2005).
- (26) T. Bürvenich, D. G. Madland, J. A. Maruhn, and P.-G. Reinhard, Phys. Rev. C65, 044308 (2002).
- (27) T. Nikšić, D. Vretenar, G. A. Lalazissis, and P. Ring, Phys. Rev. C77, 034302 (2008).
- (28) T. Nikšić, D. Vretenar, G. A. Lalazissis, and P. Ring, Phys. Rev. C78, 034318 (2008).
- (29) M. M. Sharma and P. Ring, Phys. Rev. C45, 2514 (1992).
- (30) D. Vretenar, A. V. Afanasjev, G. A. Lalazissis, and P. Ring, Phys. Rep. 409, 101 (2005).
- (31) H. Kucharek and P. Ring, Z. Phys. A339, 23 (1991).
- (32) J. G. Valatin, Phys. Rev. 122, 1012 (1961).
- (33) P. Bonche, H. Flocard, P.-H. Heenen, S. J. Krieger, and M. S. Weiss, Nucl. Phys. A443, 39 (1985).
- (34) P. Ring and P. Schuck, The Nuclear Many-Body Problem (Springer, Heidelberg, 1980).
- (35) D. Pena Arteaga, Phd thesis, Technische Universität München (unpublished), 2007.
- (36) S. Hilaire, J.-F. Berger, M. Girod, W. Satula, and P. Schuck, Phys. Rev. Lett. B531, 61 (2002).
- (37) G. Audi, A. H. Wapstra, and C. Thibault, Nucl. Phys. A729, 337 (2003).
- (38) G. A. Lalazissis, S. Raman, and P. Ring, Atomic and Nuclear Data Tables 71, 1 (1999).
- (39) http://www-phynu.cea.fr/science_en_ligne/ carte_potentiels_microscopiques/index.htm
- (40) T. Nikšić, D. Vretenar, G. A. Lalazissis, and P. Ring, Phys. Rev. Lett. 99, 092502 (2007).
- (41) P. Papakonstantinou, Euro. Phys. Lett. 78, 12001 (2007).
- (42) J. F. Dawson and R. J. Furnstahl, Phys. Rev. C42, 2009 (1990).
- (43) P. Ring, Z.-Y. Ma, N. Van Giai, D. Vretenar, A. Wandelt, and L.-G. Cao, Nucl. Phys. A694, 249 (2001).
- (44) S. Goriely and E. Khan, Nucl. Phys. A706, 217 (2002).
- (45) S. Goriely, E. Khan, and M. Samyn, Nucl. Phys. A739, 331 (2004).
- (46) M. Danos, Nucl. Phys. 5, 23 (1958).
- (47) S. Péru and H. Goutte, Phys. Rev. C77, 044313 (2008).
- (48) K. Yoshida and N. V. Giai, Phys. Rev. C78, 014305 (2008).
- (49) D. Pena and P. Ring, in preparation.
- (50) G. A. Lalazissis, J. König, and P. Ring, Phys. Rev. C55, 540 (1997).