Molecular Signatures in the Near Infrared Dayside Spectrum of HD 189733b
Abstract
We have measured the dayside spectrum of HD 189733b between 1.5 and 2.5 m using the NICMOS instrument on the Hubble Space Telescope. The emergent spectrum contains significant modulation, which we attribute to the presence of molecular bands seen in absorption. We find that water (H2O), carbon monoxide (CO), and carbon dioxide (CO2) are needed to explain the observations, and we are able to estimate the mixing ratios for these molecules. We also find temperature decreases with altitude in the bar region of the dayside near-infrared photosphere and set an upper limit to the dayside abundance of methane (CH4) at these pressures.
1 Introduction
HD 189733b is a transiting hot-Jupiter planet in a 2.2-day orbit around a K2V stellar primary (Bouchy et al., 2005). Due to the relatively large depth of the eclipse (% at K band) and the bright stellar primary (Kmag = 5.5), this system was immediately recognized as an important target for atmospheric characterization observations, and its emission has been studied extensively durning secondary eclipse (Deming et al., 2005; Knutson et al., 2007; Grillmair et al., 2007; Knutson et al., 2008; Charbonneau et al., 2008). Multicolor photometric observations revealed the presence of H2O (Tinetti et al., 2007a) and the likely presence of CO (Charbonneau et al., 2008), while optical transmission spectroscopy suggests scattering by high altitude haze (Pont et al., 2008). In addition, extensive theoretical work has also been done on the atmosphere of this planet by Fortney et al. (2006); Barman (2008); Burrows et al. (2008); Showman et al. (2008) and others.
Recently, the NICMOS camera on the Hubble Space Telescope (HST) was used during the primary eclipse of HD 189733b to obtain a near-IR transmission spectrum of the planet’s atmosphere; these results showed the presence of H2O and CH4 (Swain et al. 2008; hereafter SVT08). The near-IR transmission spectrum of HD 189733b probes the upper (P bar estimated from our models) regions of the of the atmosphere at the terminator. In this paper, we report the results of HST observations of the dayside spectrum (derived from secondary eclipse measurements). At near infrared wavelengths, the dayside portion of the atmosphere of HD 189433b is probed in deeper (P bar estimated from our models) regions.
2 Observations
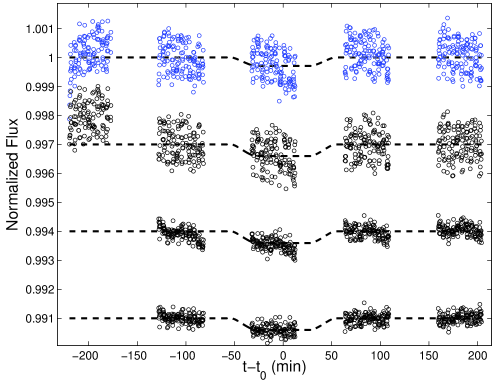
We observed HD 189733 with the Hubble Space Telescope for five contiguous spacecraft orbits, using NICMOS in imaging-spectroscopy mode with the G206 grism (wavelength coverage 1.4-2.5 m). Observations began on April 29, 2007 at UT 23:47:58 and ended at UT 06:51:52 on the next day. The first two orbits ( & ) observed the target pre-ingress, the third orbit () was phased to capture the occultation, while the fourth and fifth orbits ( & ) were post-egress (see figure 1). A total of 638 usable snapshot spectra were acquired during the five orbits. The third orbit (the occultation) contained 130 spectra. Using the best available ephemerides (Winn et al., 2007; Pont et al., 2008) we determine that full-occultation starts exposures into , and lasts for the remainder of this orbit. The effective exposure time for each spectrum was s; the overall instrumental configuration, including the location of the spectrum on the focal plane array, was identical to that in SVT08. A few spectral calibration exposures (in ) were acquired using a narrow-band filter.
Because the NIC-3 camera is severely undersampled and because of large gain drop-off at the edges in the NICMOS detector pixels, the instrument was configured in DEFOCUS mode (FWHM 5 pixels). This defocus reduces the level of photometric fluctuations due to both pointing jitter (random) and beam wander (systematic errors). While the defocus also helps to minimize the bright-source overheads for this extremely bright target, it nevertheless limits the effective spectral resolution to .
2.1 Data Analysis
A complete description of the data-analysis methods is provided in the supplementary information to SVT08. Herein, we discuss only departures and addenda to these analysis methods.
First, each image is reduced to a one-dimensional spectrum covering 1.5-2.5 m in spectral range. This includes combining data from the grating’s first and second orders, which are simultaneously imaged onto the detector array. Inclusion of the second order improves the SNR in the blue because the second order, which is partially imaged onto the detector, contains more detected photon-flux at the shortest wavelengths (shortwards of 1.7 m, longwards of which the efficiency of the 2nd order falls rapidly) as a consequence of the peculiar blaze of the parent grating. Prior to combination, wavelength solutions for both orders were obtained using the calibration exposures and the wavelength-scale coefficients in Nicmoslook (Freudling et al., 1997). Merger of the spectral orders takes advantage of the near integer ratio, , of the spectral resolutions of the two orders. The orders are coadded around a fiducial wavelength, and any smearing is captured by assigning the coadded channel a wavelength equivalent to the weighted average of wavelengths of component channels. Prior to coadding, the 2nd order spectra were multiplied by a broad Tukey window so as to suppress the effects of (1) the sharp band-edge at 1.5 m and (2) the detector array edge at m on the final spectrophotometry. Lastly, coadded spectra are rebinned to wavelength channels at the binwidth of the DEFOCUS full-width-at-half-maximum, guaranteeing adjacent channels have independent spectral content. As the state variables are channel independent, the two orders can be coadded prior to decorrelation (see below). The secondary eclipse is observable in the raw light-curves (see Fig. 1) and especially so in spectral subbands with high contrast (e.g. around 2.3 m; see Fig. 3). For example, if we divide the “red broadband” (see caption Fig. 1) into two subbands between 1.9 to 2.2 m and 2.2 to 2.5 m, little contrast is apparent in the former while a large contrast is seen in the latter.
The nature of the state variables chosen for decorrelation has been discussed extensively in SVT08-SI. One change is in the array temperature vector: instead of using temperatures from the probe at the NIC-1 mounting cup, we use the diode properties of the detector pixels as proxy for the detector temperature because the measurable detector bias voltage is highly temperature sensitive. These temperatures were extracted by the STScI staff on request (courtesy N. Pirzkal, priv. comm.). We find that the peak-to-valley variations of the state variables are similar (i.e. pixel for PSF displacement) to those seen in the observations of SVT08 for all orbits included in the fitting procedure, i.e. . A large rotation of the dispersion axis is apparent in , and data were discarded in order to satisfy our underlying assumption – that spectrophotometry systematics are linear in small perturbations of the state variables. After the rotation settles, although shows a larger rotation from mean than the final three orbits.
The framework for decorrelation of the light curves is the joint energy minimization procedure described in SVT08, i.e. modelling and removal of the systematics was performed simultaneously, with the eclipse-depth, , left as a free variable. The unique minima in the space determines the emission spectrum. The point-to-point photometric scatter (see Fig. 1), which is stochastic in time but common to all wavelength channels, is estimated using optimally weighted fit-residuals as in SVT08-SI. For all channels, the final residual vectors are examined via Lomb-Scargle periodograms to ensure that correlated noise, as well as noise at the HST orbital period and its overtones, is removed. An alternative scheme, that uses just the baseline light curves to fit for a model (SVT08-SI) and then interpolates to determine the emission spectrum, gave answers that were statistically consistent with the joint energy minimization scheme; this implies that just the baseline orbits provide an adequate model.
The importance of the various state variables in modelling the overall systematics is assessed via principal components. The model in each light curve is first decomposed along each state vector, which is converted to a channel-wise correlation matrix. Each correlation matrix is diagonalized, along with the computation of the principal vectors. We find that a maximum of two principal components is required to model the bulk of the variance in the channel light curves. The rotation , and the displacements , , are the most important projections onto the first principal component, which models between 55-90 % of the variance across channels. The spacecraft orbital phase, , is the single most important projection onto the second principal component. This behavior is largely explained by the fact that most elements in the set of state vectors show some dependence on the spacecraft orbital period.
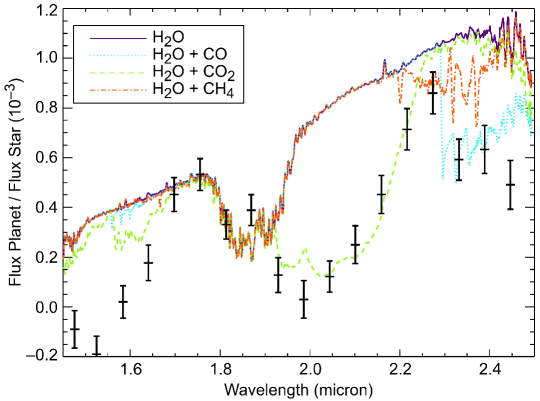
The final emission spectrum (planet/star ratio) is shown in figures 2 & 3 and tabulated in Tab. 1. The error bars contain three major components in quadrature. These are as follows: (1) the random noise, including detection noise, errors in the estimation of the state vectors, and any remaining systematics are contained in the light curve residuals, (2) stochastic uncertainties in the model are computed by bootstrapping, and (3) gross errors in the model fitting. The latter are estimated either via Monte Carlo methods by applying random perturbations to the model components (SVT08-SI), or via the surfaces obtained from the fitting procedure. Finally, we draw attention to the fact that the penultimate bluest channel (1.525 m) has an unphysical eclipse depth; specifically, the wavelenth channel is negative at . This may be due to the fact that this channel contains a dead pixel in the brightest part of the spectral image. We have not evaluated the effect of such dead-pixels on the spectrophotometry in a strict statistical sense; consequently such effects are not reflected in the error-bar for that channel. Previous ground-based observations have been used to estimate the K-band planet/star contrast upper limit as 0.00039 (Barnes et al, 2007). We find the contrast in the same passband (averaging the contrast in our spectral channels between 1.98 and 2.38 m) to be 0.0004; given the challenges associated with ground-based secondary eclipse measurements, we do not consider the difference significant.
3 Discussion
The interpretation of emergent spectra is generally complex because molecular bands could appear either in emission, absorption, or both, depending on the detailed temperature, pressure, and chemical profile of the planetary atmosphere. Nonetheless, when molecular species with detectable spectral features are present, radiative transfer models can be used to retrieve the temperature and abundance structure of the photosphere of emission. This approach, used extensively for the study of planetary atmospheres in our solar system (Goody & Yung, 1989), is the basis of our spectral retrieval.
We undertook a detailed analysis using a line-by-line, radiative-transfer model developed for disk-averaged planetary spectra and subsequently adapted for the specific case of hot-Jupiters (Tinetti et al., 2006, 2007b). The model covers a pressure range from bar in which the individual model layers are populated by abundance profiles for molecules used in the retrieval process. The opacity contribution of each molecule is computed based on its mixing ratio , local density (), and temperature in accordance with the assumed T-P profile. Our compendium of line-lists is the same as that given in SVT08. Trial planetary spectra were converted to contrast spectra using an ATLAS-9 model-spectrum of a K1-K2V star with solar abundances (Kurucz, 1993). To retrieve molecular abundances and the temperature profile, we iteratively compared the modelled contrast spectra to the observed NIR spectra as well as mid-IR Spitzer-IRAC photometry (Charbonneau et al., 2008). We found that the IRAC photometry did not provide constraints for molecular mixing ratios, although those data were consistent with a decreasing T profile. Thus, the results for molecular abundances presented here are independent of IRAC data that probe lower pressures in the atmosphere.
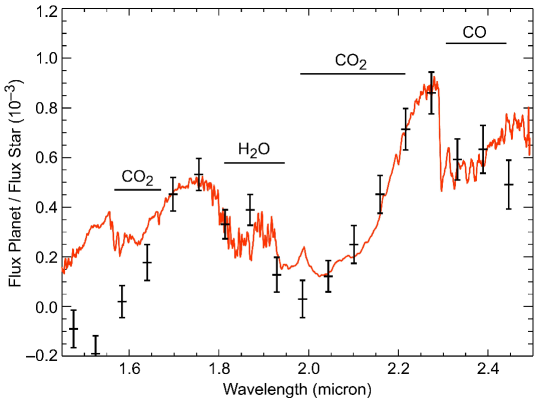
The significant spectral modulation present in the near-IR contrast spectrum is best explained by the presence of water vapor and the carbon-bearing molecules CO and CO2. The model requires a decreasing temperature with altitude between 1 P bar (the relevant photosphere). The modelling began by including the minimum number of molecules (H2O, CO, and CH4) composed from the most abundant reactive elements (H,O,and C). These molecules are highly plausible; H2O and CH4 have already been inferred via transmission photometry and spectroscopy (Tinetti et al., 2007a; Swain et al., 2008), and CO, thermochemically the most stable carbon molecule on the hot day-side, has been inferred from photometry (Barman, 2008; Charbonneau et al., 2008). However, this minimal combination of molecules is unable to reproduce the large contrast deficit in the 1.95-2.15 m region of the spectrum, suggesting additional opacity by the 2 m combination-bands of CO2. The inclusion of CO2 in the model reproduces the major features of the observed spectrum. Fig. 2 illustrates the contribution of individual molecules to the model spectrum; the significance of CO2 is evident. This suggests searching for evidence of other CO2 bands, such as the 15 m band, which may be present in the Spitzer mid-IR spectra (Grillmair et al., 2007).
Although CO2 is not the primary carrier of carbon in the pressure and temperature range of relevance here, it is thermochemically predicted to be fairly abundant ( for solar abundance) when CO is the major carbon-bearing gas (Lodders & Fegley, 2002) and has been discussed in the context of low-gravity brown dwarf spectral models (Saumon et al., 2003; Mainzer et al., 2007). It is formed via the net thermochemical reaction,
Additionally, CO2 is readily produced by the reaction
where the hydroxyl radical OH is derived from photolysis of H2O (Liang et al., 2003).
While the observed spectrum places strong constraints on what major molecules are present, the model fitting must deal with a degeneracy between and the molecular mixing ratio. In order to estimate the range of plausible mixing ratios for the inferred species, our final family of models explored a range of profiles (Barman, 2008; Burrows et al., 2008), with constant vertical mixing ratios for H2O, CO and CO2, and a vertical mixing profile for CH4, as derived by Liang et al. 2003. Based on this family of models, we find the following range for mixing ratios at pressure altitudes relevant here: H2O (), CO (), CO2 (), and CH4 (). These values imply a 0.5 C/O 1 together with a metallicity that is potentially subsolar. The inclusion of CO2 in our models does not explain the contrast deficits at the band-edges, particularly the blue edge at 1.6 m (Fig. 3). One possibility is the presence in the atmosphere of trace amounts of hydrocarbons such as acetylene (C2H2), ethane (C2H6), and possibly ammonia (NH3). For example, C2H2, CH4 and C2H6 can be produced via photolysis of CO (the primary reservoir for carbon) and water (Liang et al., 2004), while ammonia is likely to be found in low concentrations (c ) in thermal equilibrium with N2, which is the dominant reservoir for nitrogen in these conditions. Indeed, including one or more of the above molecules does improve the model fit at the band-edges. However, a firm assertion of their presence amongst a myriad of possibilities would require better data and/or broader wavelength coverage.
4 Conclusions
In summary, we have presented the first near infrared spectrum of light emitted by a hot-Jupiter type planet. Using a radiative transfer model, we determine that the molecules H2O, CO and CO2 are likely present on the dayside of HD 189733b, and we are able to estimate abundances for these species. Although we cannot tightly constrain the slope of the temperature profile, the observed absorption features indicate that temperature decreases with altitude at pressures between 1 and 0.01 bar. In addition, there are residual features in the spectrum that could be explained by including opacities of other species that are presently not well constrained.
This work represents an initial step in exploiting the power of spectral analysis (even at low resolutions of ) in determining the chemical composition of extrasolar planetary atmospheres; it also illustrates the extraordinary potential of the NICMOS instrument for characterizing bright, transiting exoplanets. In a previous paper, we presented a transmission spectrum of this planet at the terminator (SVT08), in which methane is seen to be more abundant ( = ) in the higher, cooler regions of the terminator region atmosphere. However, it is difficult to compare directly the previous terminator results with our current dayside results because they probe atmospheric regions with significantly different temperatures and altitudes on this highly irradiated planet. The development of sophisticated global circulation and chemistry models could significantly advance the state of the art in this respect.
References
- Barman (2008) Barman, T. 2008, ApJ, 676, L61
- Barnes et al (2007) Barnes, J.R. et al. 2007, MNRAS, 382, 473
- Bouchy et al. (2005) Bouchy, F. et al. 2005, A&A, 444, 15
- Burrows et al. (2008) Burrows, A., Budaj, J., & Hubeny, I., & 2008, ApJ, 678, 1436
- Charbonneau et al. (2008) Charbonneau, D., et al. 2008, arXiv:0802.0845v1
- Deming et al. (2005) Deming, D., Seager, S., Richardson, L. J., & Harrington, J. 2005a, Nature, 434, 740
- Fortney et al. (2006) Fortney, J. J., Saumon, D., Marley, M. S., Lodders, K., & Freedman, R. S. 2006, ApJ, 642, 495
- Freudling et al. (1997) Freudling, W., Storrs, A., Pirzkal, N., & Pasquali, A. 1997, AAS, 191.1002
- Goody & Yung (1989) Goody, R. M., & Yung, Y. L. 1989, Atmospheric Radiation. Oxford University Press
- Grillmair et al. (2007) Grillmair, C. J, Charbonneau, D., Burrows, A., Armus, L, Stauffer, J., Meadows, V., Van Cleve, J., & Levine, D. 2007, ApJ, 658, L115
- Knutson et al. (2007) Knutson, H. A., et al. 2007b, Nature, 447, 183
- Knutson et al. (2008) Knutson, H. A. et al. 2008, arXiv0802.1705K
- Kurucz (1993) Kurucz, R. L. 1993, Kurucz CD-Rom, Atlas 9 (SAO, Cambridge)
- Liang et al. (2003) Liang, Parkinson, C. D., Lee, A. Y.-T., Yung, Y. L., & er, S. 2003, ApJ, 596, L247
- Liang et al. (2004) Liang, M.-C., Seager, S., Parkinson, C. D., Lee, A. Y.-T., & Yung, Y. 2004, ApJ, 605, L61
- Lodders & Fegley (2002) Lodders, K. & Fegley, B. 2002, Icarus, 155, 393
- Mainzer et al. (2007) Mainzer, A. K., Roellig, T. L., Saumon, D., Marley, M. S., Cushing, M. C., & Sloan, G. C. 2007, ApJ, 662, 1245
- Pont et al. (2008) Pont, F., Knutson, H., Gilliland, R. L., Moutou, C., & Charbonneau, D. 2008, MNRAS, 385, 109
- Saumon et al. (2003) Saumon, D., Marley, M. S., & Lodders, K. 2003, astro.ph.10805S
- Showman et al. (2008) Showman, A. P., Cooper, C. S., Fortney, J. J., & Marley, M. S. 2008, ApJ, 682, 559S
- Swain et al. (2008) Swain, M. R., Vasisht, G. V., & Tinetti, G. 2008, Nature, 452, 329
- Tinetti et al. (2006) Tinetti, G. et al. 2006, Astrobiology, 6(1), 34
- Tinetti et al. (2007a) Tinetti, G. et al. 2007, ApJ, L99
- Tinetti et al. (2007b) Tinetti, G. et al. 2007, Nature, 448, 169
- Winn et al. (2007) Winn, J. N. et al. 2007, AJ, 133, 1828
Planet/Star Contrast Spectrum
| wavelength () | error | |
|---|---|---|
| 2.446 | 0.000491 | 0.00009 |
| 2.389 | 0.000633 | 0.00009 |
| 2.332 | 0.000592 | 0.00008 |
| 2.274 | 0.000860 | 0.00008 |
| 2.216 | 0.000714 | 0.00008 |
| 2.159 | 0.000452 | 0.00007 |
| 2.101 | 0.000250 | 0.00007 |
| 2.044 | 0.000122 | 0.00006 |
| 1.986 | 0.000030 | 0.00007 |
| 1.929 | 0.000128 | 0.00007 |
| 1.869 | 0.000389 | 0.00006 |
| 1.814 | 0.000331 | 0.00006 |
| 1.755 | 0.000532 | 0.00006 |
| 1.698 | 0.000452 | 0.00007 |
| 1.640 | 0.000177 | 0.00007 |
| 1.584 | 0.000021 | 0.00006 |
| 1.525 | -0.000190 | 0.00007 |
| 1.476 | -0.000089 | 0.00008 |