High velocity H2O maser emission from the Post-AGB star OH 009.1–0.4
Abstract
Observations of H2O masers towards the post-AGB star and water fountain source OH 009.1–0.4 were made as part of HOPS (The H2O southern galactic Plane Survey), with the Mopra radiotelescope. Together with followup observations using the Australia Telescope Compact Array (ATCA), we have identified H2O maser emission over a velocity spread of nearly 400km s-1 (–109 to +289 km s-1). This velocity spread appears to be the largest of any known maser source in our Galaxy. High resolution observations with the ATCA indicate the maser emission is confined to a region and shows weak evidence for a separation of the red- and blueshifted maser spots. We are unable to determine if the water fountain is projected along the line of sight, or is inclined, but either way OH 009.1–0.4 is an interesting source, worthy of followup observations.
keywords:
masers – stars: AGB and post-AGB1 Introduction
Water (H2O) maser emission is found throughout our Galaxy,
pinpointing unusual physical conditions towards many different
astrophysical objects, including high- and low-mass star forming regions,
planetary nebulae (Miranda et al., 2001), Mira variables (Hinkle & Barnes, 1979)
and asymptotic giant branch (AGB) stars (Engels & Lewis, 1996).
They are also found outside our Galaxy,
such as in the centres of active galaxies (Claussen et al., 1984).
In order to study the occurrence of H2O masers in our Galaxy, a
large-scale untargetted survey has begun, called HOPS (The H2O southern
galactic Plane Survey; Walsh et al. in preparation).
This survey will cover 90 square
degrees of the southern Galactic plane, searching for, amongst other things,
H2O masers.
Planetary nebulae (PN) are the end-phase of evolution for intermediate-mass
( 1-8 M⊙) Main Sequence stars. These stars spend a significant
fraction of their lives ( 106 yr) on the Asymptotic Giant Branch
(AGB), a phase characterised by copious mass-loss which results in thick,
dusty, molecular envelopes (see e.g. Herwig 2005 for a review of AGB
evolution) with expansion velocities of order 10-20 km s-1. In the
O-rich case, the envelopes of these AGB stars can display emission from the
masing species of SiO, OH and H2O. The velocity profiles of these species
(e.g. Deacon et al. 2004, 2007) are usually consistent with them having arisen
in largely spherical shells around their host star (e.g. Cohen 1989);
additionally, the velocity extent of the OH typically lies outside of and
encloses that of the H2O. Interferometric observations of these species
reveal spatiokinematic distributions of maser spots that largely corroborate
the suggested overall sphericity, sometimes with small deviations within the
inner molecular envelopes (e.g. Bains et al. 2003). As the objects evolve past
the tip of the AGB, it is surmised that a fast wind emanates from the
exposed stellar core (Kwok, Purton, & Fitzgerald, 1978) and gradually the maser species are extinguished due to
the loss of coherence length in the disrupted shell (see e.g. van Winckel
2003 for a review of post-AGB evolution). It is this fast wind that is
thought to amplify any existing asymmetries in the
slower AGB envelope, leading to the morphological evolution of the object
from largely spherical to the array of shapes displayed by PN (e.g. Balick &
Frank 2002).
Recent imaging of post-AGB dust shells (e.g. Gledhill 2005) in scattered light has
revealed a preponderance of axisymmetric structures, suggesting the window
for turning on the shaping mechanism can be narrowed to the late AGB/early
post-AGB phase. Further, the slowly-growing subclass of ‘water fountain’ sources
(first discovered and aptly named by Likkel & Morris 1988), with about 10
members (Imai, 2007), can potentially elucidate the mystery of the shaping
mechanism. Water fountains are bipolar post-AGB stars that display highly
collimated and high velocity expanding regions (typically 100 km s-1) of H2O maser emission. The spectral profile
of the H2O maser emission displays a larger velocity range of emission compared
to that of OH, where present; maps of the sources reveal that the OH emission traces
the remnant molecular shell while the H2O emission is shock-excited in
collimated bipolar jets (Imai et al., 2002). Observations seem to confirm the
theory that these high velocity jets are likely driven by
magneto-hydrodynamical processes (Vlemmings et al., 2006). However, whether
the observed strong magnetic fields originate from single stars or through
binary interactions is still unclear. Water fountains may therefore represent an
extremely short-lived phase of post-AGB evolution that all such objects pass
through, where much of the shaping takes place via the sculpting caused by
the high velocity jets. Alternatively, they may be a special subset of
stars, perhaps the more massive ones that evolve quicker and have
sufficiently thick envelopes to shield clouds of H2O vapour and preserve
them to later be shocked into masing by the fast wind (Suarez et al. 2007).
Either way, their discovery represents an exciting new addition to the study
of the late stages of stellar evolution.
In this Letter, we report on the detection of a H2O maser towards the
young post-AGB star known as OH 009.1–0.4 and b292 (Sevenster et al., 1997),
which shows maser emission over the widest velocity
range known in our Galaxy, confirming it as a new addition to the short list of
known water fountains. The post-AGB star is associated with the IRAS
source 18043–2116. It is unusual in that it exhibits 1665 MHz and 1612 MHz
OH maser emission, but not at 1667 MHz (Deacon et al., 2004). Furthermore,
it is the only known post-AGB star to show 1720 MHz OH maser emission,
which is thought to arise in the region where the AGB and starting planetary
nebula winds collide (Sevenster & Chapman, 2001). Previous observations of
H2O maser emission towards OH 009.1–0.4 (Deacon et al., 2007) showed emission
covering 210 km s-1, although the authors noted that there could be other
maser features that were outside the observed velocity range.
2 Observations
2.1 Mopra Observations
The Australia Telescope National Facility Mopra telescope is a 22 m antenna
located 26 km outside the town of Coonabarrabran in New South Wales, Australia.
It is at an elevation of 850 metres above sea level and at a latitude of
31∘ south.
Observations of OH 009.1–0.4 were performed as part of the large survey HOPS
on 2008 March 9 and 10, using the on-the-fly mapping method. Total on-source
integration time is approximately two minutes. The Mopra spectrometer (MOPS)
was used in “zoom” mode, which allows us to simultaneously observe 16
different frequencies, each with 4096 channels across a bandwidth of
137.5 MHz, corresponding to 0.45 km s-1 per channel. To observe H2O masers,
we employed two contiguous zoom bands, allowing us to search for maser emission
over a velocity range between –2395 and +1326 km s-1.
Data were reduced using livedata and gridzilla, which are both AIPS++ packages written for the Parkes radiotelescope and adapted for Mopra.
2.2 ATCA Observations
Followup observations of OH 009.1–0.4 were made with the Australia Telescope
Compact Array (ATCA) on 2008 July 12 and 13, using the H214 hybrid array.
Observations were made using three different frequencies spaced 26 MHz
apart, each 32 MHz wide and containing 512 channels, equivalent to
0.84 km s-1 per channel. Together, the three frequencies covered a velocity
range of –395 to +670 km s-1with respect to the local standard of rest (LSR).
Observations were made with one linear polarisation,
were phase referenced to either 1730–130 or 1817–254 and flux calibrated
using 1934–638. We estimate the flux scale will be accurate to around 10%,
which is typical for observations at this frequency.
For each frequency, seven snapshot observations of two minutes each were taken. The snapshots were evenly spaced throughout eight hours, to ensure a wide coverage of the UV plane. The data were reduced using the miriad package using similar techniques described in (Walsh et al., 2007). Strong maser emission was used to self-calibrate the data, and allowed data from antenna 6 to be included, greatly reducing the synthesised beam to 1.19″ 2.75″.
3 Results
The initial Mopra observations showed maser emission detected at velocities
from –48 to +286 km s-1, as shown in the bottom spectrum of Figure 1.
This emission comprises of eleven individual maser spots. Followup observations
with the ATCA (top spectrum in Figure 1) showed emission spanning a
larger velocity range from –109 to +289 km s-1 and comprising of 32
individual maser spots. The greater number of maser spots identified in the
ATCA observations appears to be a result of the lower noise level
in the ATCA spectrum, allowing weaker spots to be identified.
However, intrinsic variablility of the masers has resulted in some brighter spots in
the ATCA observations. This variability has taken place over 125 days and is
most noticeable in the velocity range of +40 to +80 km s-1, where the brightest
emission occurs in the ATCA spectrum.

Some overlap in the ATCA bandpasses allowed us to observe the same
maser spots between –50 and –12 km s-1 on different nights. Based on the two
brightest maser spots (1 Jy) within this range (at –21.8 and
–47.7 km s-1), we find an absolute offset of not more than 1.9″ between
the observations made on different nights. We note that the weather on the second
night of observations was considerably worse than the first night, with significantly
higher phase noise. The second nights
observations covered maser spots in the velocity range –12 km s-1 to –109 km s-1.
Thus, we expect absolute positional data for the majority of maser spots,
observed on the first night, to be better than
1.9″. We use the brightest maser spot in the spectrum
(based on integrated intensity, rather than the peak) as the reference
position of our observations, which is at 18h07m20 85
–21∘16120 (J2000).
With the small ATCA synthesised beam, we are able to accurately determine
relative positions of each maser spot. For each maser spot, we integrated all
channels showing emission, avoiding any channels which might be confused by
emission from other spots. The resultant integrated image was fitted with a
two-dimensional gaussian, using the “imfit” routine in miriad. For
each maser spot, this allows us to determine its relative position more
accurately than the beam size. We estimate the relative positional uncertainty
of each maser spot as (Fomalont, 1999),
where is the synthesised beam (1.19″
2.75″) and SNR is the signal-to-noise ratio.
4 Discussion
We have detected H2O maser emission over a radial velocity range of 398 km s-1 which we believe is the largest of any known water fountain, or indeed any maser source in our Galaxy. Based on the available information, we are unable to determine the orientation of this system with respect to the line of sight. If the orientation is not along the line of sight, the spread of maser velocities will be even greater. For example, if the orientation is 45∘ to the line of sight, the masers will cover a velocity range of over 560 km s-1 in three dimensional space. This can be compared to recent observations of the water fountain IRAS 16342–3814 (Claussen et al., 2008), whose radial velocities are measured over a spread of 270 km s-1 and whose three dimensional velocities range up to 370 km s-1, based on an inclination angle of 45∘. Thus, if OH 009.1–0.4 has a large inclination angle, it shows maser velocities far in excess of any other known water fountain. Alternately, it may be aligned close to the line of sight with a three dimensional velocity slightly larger than that of IRAS 16342–3814.
Based on the systemic velocity of the post-AGB star of
87 km s-1 (Deacon et al., 2007), the highest velocity spots of the H2O maser
spectrum are at –196 and +202 km s-1 along the line of sight, relative to the
systemic velocity.
It is interesting to note that the velocity difference of the most redshifted
maser spot to the systemic velocity closely matches the magnitude
of the velocity difference between the most blueshifted component and the
systemic velocity. In addition to this, we find 8 out of 13 maser spots (60%)
on the redshifted side have maser spot counterparts on the blueshifted side
with similar magnitudes of velocity offset from the systemic velocity.
Such mirroring of the maser emission could be a result of symmetries
between each lobe of a bipolar jet.
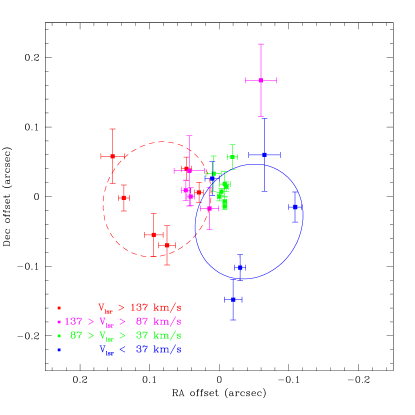
Figure 2 shows the relative positions of the brightest 24 maser spots, together with their error bars. As can be seen from this Figure, all the emission is found within a small area of . However, we do see significant differences between the positions of some maser spots. We assume a kinematic distance to OH 009.1–0.4 of 6.4 kpc (Brand & Blitz, 1993). Thus, the maser spots are confined to a projected area of AU.
As seen in Figure 2, the H2O maser morphology of OH 009.1–0.4 does not resemble the distinct bipolar structures characteristic of the imaged water fountain sources. Although there is a offset of (corresponding to AU) between the most red- and blue-shifted maser features, the opening angle of the outflow of OH 009.1–0.4 appears to be much larger than that of the collimated jet of the typical water fountain sources. However, this could be due to projection effect when the source is observed almost along the outflow (‘jet’) axis. Assuming a regular bipolar outflow structure, the opening angle of the OH 009.1–0.4 outflow is given by , with the inclination angle of the outflow axis from the line-of-sight. Ignoring any possible contributions from jet precession as observed for W43A (Imai et al., 2002), a typical water fountain opening angle implies . We can also use the projected separation to estimate the dynamical age of the high velocity outflow from OH 009.1–0.4. Again assuming a regular bipolar outflow with constant velocity, the dynamical age yr. While a dynamical age as low as 10 yr cannot be excluded, a more typical water fountain age of yr (Imai, 2007) also implies a small inclination angle. Thus, the high velocity H2O masers around OH 009.1–0.4 either originate from a typical water fountain jet observed almost along the jet axis, or they occur in an extremely young and fast wide-angled wind. These different scenarios can be directly tested by astrometric monitoring at Very Long Baseline Interferometry (VLBI) resolution, as a regular outflow implies proper motions of mas yr-1 for the high velocity H2O maser components.
Contrary to the other water fountain sources, the strongest H2O maser emission of OH 009.1–0.4 originates from within km s-1 of the stellar velocity. While the spatial extent and velocity of these masers are fairly typical for the standard AGB H2O maser shells (e.g. Bains et al., 2003), Figure 2 shows that the low velocity emission at the blue- and red-shifted sides of the spectrum also arises in separated regions. Although high resolution observations are needed to properly probe the relation between the high- and low-velocity components, the emission could arise in an km s-1 equatorial wind as observed at somewhat lower velocities ( km s-1) in the water fountain sources IRAS 18286–0959 and IRAS 18460–0151 (Deguchi et al., 2008; Imai, 2007). Alternatively, the low-velocity components are excited in a slow wind or in accelerating material further down the fast outflow, possibly due to episodic ejections.
5 Conclusions
We have observed the water fountain OH 009.1–0.4 with both the Mopra and
ATCA radiotelescopes. We find water maser spots covering an unprecedented
velocity range of 398 km s-1 which we believe is the largest range of velocities
for any known maser site in our Galaxy. Using the ATCA interferometer, we have partially
resolved the water maser emission, which covers a projected area of
AU. From our current observations, it is not clear if the
water fountain is aligned along the line of sight, or if it is inclined. If it
is aligned along the line of sight, then this orientation offers a unique perspective
on water fountains with the jet pointed towards us. If it is inclined to the line of
sight, then the three dimensional velocities will be even larger than measured here.
Either way, OH 009.1–0.4 is certainly a unique and interesting water fountain,
worthy of further investigation.
We suggest that followup observations OH 009.1–0.4 at higher spatial resolution,
such as with VLBI, will be able to tell us more about the nature of this region.
References
- Bains et al. (2003) Bains, I., Cohen, R. J., Louridas, A., Richards, A. M. S., Rosa-González, D. & Yates, J. A. 2003, MNRAS, 342, 8
- Balick & Frank (2002) Balick, B. & Frank, A. 2002 ARA&A, 40, 439
- Brand & Blitz (1993) Brand, J. & Blitz, L. 1993, A&A, 275, 67
- Claussen et al. (2008) Claussen, M.J., Sahai, R. & Morris, M. R. 2008, ApJ in press
- Claussen et al. (1984) Claussen, M.J., Berge, G.L., Heiligman, G.M., Leighton, R.B., Lo, K.Y., Masson, C.R., Moffet, A.T ., Philips, T.G., Sargent, A.I., Scott, S.L., Wannier, P.G. & Woody, D.P. 1984, ApJL, 285, 79
- Cohen (1989) Cohen, R. J. 1989, RPPh, 52, 881
- Deacon et al. (2007) Deacon, R. M., Chapman, J. M., Green, A. J. & Sevenster, M. N. 2007, ApJ, 658, 1096
- Deacon et al. (2004) Deacon, R. M., Chapman, J. M. & Green, A. J. 2004, ApJS, 155, 595
- Deguchi et al. (2008) Deguchi et al. 2008, in preparation
- Engels & Lewis (1996) Engels, D. & Lewis, B. M. 1996, A&AS, 116, 117
- Fomalont (1999) Fomalont E. 1999, ASP Conf. Series, 180, 301
- Gledhill (2005) Gledhill, T. 2005, MNRAS, 356, 883
- Herwig (2005) Herwig, F. 2005, ARA&A, 43, 435
- Hinkle & Barnes (1979) Hinkle, K.H. & Barnes, T.G. 1979, ApJ, 227, 923
- Imai (2007) Imai, H. 2007, in IAU Symp., 242, 279
- Imai et al. (2002) Imai, H., Obara, K., Diamond, P. J., Omodaka, T., Sasao, T. 2002, Nature, 417, 829
- Kwok, Purton, & Fitzgerald (1978) Kwok, S., Purton, C. R., & Fitzgerald, P. M. 1978, ApJL, 219, 125
- Likkel & Morris (1988) Likkel, L. & Morris, M. 1988, ApJ, 329, 914
- Miranda et al. (2001) Miranda, L. F., Gómez, Y., Anglada, G. & Torrelles, J.M. 2001, Nature, 414, 284
- Sevenster & Chapman (2001) Sevenster, M. N. & Chapman, J. M. 2001 ApJL, 546, 119
- Sevenster et al. (1997) Sevenster, M. N., Chapman, J. M., Habing, H. J., Killeen, N. E. B. & Lindqvist, M. 1997, A&AS, 122, 79
- Suárez et al. (2007) Suárez, O.; Gómez, J. F. & Morata, O. 2007 A&A, 467, 1085
- Walsh et al. (2007) Walsh, A. J., Longmore, S. N., Thorwirth, S., Urquhart, J. S. & Purcell, C. R. 2007, MNRAS, 382, L35
- van Winckel (2003) van Winckel, H. 2003, ARA&A, 41, 391
- Vlemmings et al. (2006) Vlemmings, W. H. T., Diamond, P. J., & Imai, H. 2006, Nature, 440, 58