Present address: ]Institute for Experimental and Applied Physics, University of Regensburg, 93040 Regensburg, Germany.
Pumping of vibrational excitations in a Coulomb blockaded suspended carbon nanotube
Abstract
Low-temperature transport spectroscopy measurements on a suspended few-hole carbon nanotube quantum dot are presented, showing a gate-dependent harmonic excitation spectrum which, strikingly, occurs in the Coulomb blockade regime. The quantized excitation energy corresponds to the scale expected for longitudinal vibrations of the nanotube. The electronic transport processes are identified as cotunnel-assisted sequential tunneling, resulting from non-equilibrium occupation of the mechanical mode. They appear only above a high-bias threshold at the scale of electronic nanotube excitations. We discuss models for the pumping process that explain the enhancement of the non-equilibrium occupation and show that it is connected to a subtle interplay between electronic and vibrational degrees of freedom.
pacs:
63.22.Gh, 73.63.Fg, 73.23.HkThe coupling of vibrational modes and electronic transport in nanoscale systems and in particular quantum dots is currently the focus of many theoretical Braig and Flensberg (2003); Lüffe et al. (2008) and experimental Sazonova et al. (2004); Witkamp et al. (2006); LeRoy et al. (2004); Sapmaz et al. (2006); Park et al. (2000); Smit et al. (2002); Leturcq et al. (2009) research efforts. In this respect, single wall carbon nanotubes (SW-CNTs) provide a unique mesoscopic system where both bulk beam mechanics Sazonova et al. (2004); Witkamp et al. (2006) and quantization of phonon modes LeRoy et al. (2004); Sapmaz et al. (2006); Leturcq et al. (2009) have already been demonstrated. Low-temperature Coulomb blockade (CB) spectroscopy on quantum dots formed within the nanotube Bockrath et al. (1997); Tans et al. (1997) has led to a well-developed understanding of the electronic structure of SW-CNTs Deshpande and Bockrath (2008); Kuemmeth et al. (2008); Jarillo-Herrero et al. (2004). In suspended SW-CNT quantum dots, transport spectroscopy has also revealed the Franck-Condon effect Braig and Flensberg (2003), where the quantized vibrations of the nanotube become visible in single electron tunneling (SET) at finite bias. A large electron phonon coupling Sapmaz et al. (2006); Leturcq et al. (2009), and first indications of vibrational phenomena in cotunneling have been observed Leturcq et al. (2009); Hüttel et al. (2008).
In this Letter we present low-temperature transport measurements on a suspended CNT quantum dot system. We observe signatures of non-equilibrium population of the quantized mechanical oscillations in the transport spectrum, revealed by cotunnel-assisted sequential electron tunneling (CO-SET). The non-equilibrium occupation is enhanced (“pumped”) by higher-order tunnel processes. Detailed models are discussed which explain the observations.
The basic device geometry is sketched in
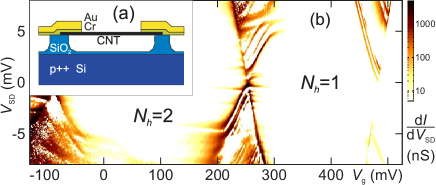
Fig. 1(a). A highly p++ doped silicon wafer, also functioning as back gate, with thermally grown oxide on top provides the starting point of the sample preparation. After lithographic fabrication of marker structures and localized deposition of growth catalyst Kong et al. (1998), carbon nanotubes are grown in situ by chemical vapor deposition and located using atomic force microscopy. Contact electrodes consisting of chromium and gold are deposited on top of the nanotubes. In a last step, the nanotube devices are suspended using wet etching in buffered hydrofluoric acid.
Measurements were performed in a dilution refrigerator with a base temperature and an electron temperature . Fig. 1(b) shows the differential conductance as function of back gate (substrate) voltage and bias voltage of one particular suspended nanotube quantum dot. This sample has a lithographically designed length of , and was – from transport measurements as in Fig. 1(b) – identified to be a semiconducting nanotube with a band gap of . Band gap energy and device length lead to a predicted energy scale of of orbital electronic excitations Jarillo-Herrero et al. (2004). In the measurement of Fig. 1(b), the basic structure of diamond-shaped CB regions with a fixed trapped charge, as expected for a single quantum dot, is clearly visible. Since the band gap position is known, we can identify the charge states as and , respectively.
Figure 2(a)
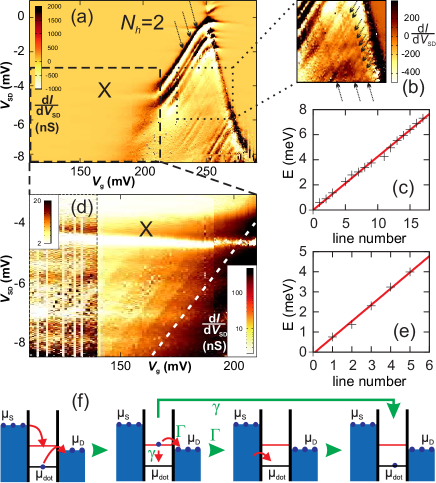
displays a detail measurement of the single electron tunneling region with at low negative bias, and the adjacent CB region. A rich spectrum of equidistant excitation lines with positive slope, corresponding to excitations of the system (see e.g. Ref. Jarillo-Herrero et al. (2004)), is found in SET sup . This is also detailed in the enlarged plot of Fig. 2(b) (see arrows). Figure 2(c) shows the corresponding excitation energies as function of line number 111No clear features can be identified in the data at the positions expected for lines 4 and 10. This may e.g. be due to electronic transitions shadowing the vibrational effects in transport.. We assign these excitations to a harmonic vibration whose frequency is , in good agreement with the bulk mechanics prediction of for the longitudinal vibration mode of a long nanotube segment Sapmaz et al. (2006). In addition, the data of Fig. 2(a-b) reveals three faint excitation lines with negative slope (i.e. excitations), marked by three black arrows and separated by approximately . It is difficult to confirm a harmonic spectrum because of the faintness of the three lines.
Figure 2(d) enlarges the region outlined in Fig. 2(a) by a black dashed rectangle, plotting the differential conductance in logarithmic color scale. Here, CB stabilizes a total charge of holes on the nanotube, suppressing SET. Surprisingly, a pattern of gate dependent excitation lines in the CB region, parallel to the edge of the SET region, emerges sup . Their relative excitation energies are plotted in Fig. 2(e). A regular spacing corresponding to a harmonic oscillator energy of is visible, close to the above mentioned energy scale of the excitations in SET.
The most straightforward explanation for these lines is that they correspond to cotunnel-assisted sequential tunneling (CO-SET) processes Schleser et al. (2005). These are multi-step processes, as sketched in Fig. 2(f). Inelastic cotunneling leaves a quantum dot in an excited state (see second panel in the figure), which is possible at any voltage above the energy of this state. Subsequently, sequential tunneling to the drain electrode can follow for voltages close to the Coulomb diamond edges, even if the Coulomb-blockaded ground state does not allow it. For this to happen, the rate for tunneling out has to be comparable to or larger than the energy relaxation rate to the ground state.
In general, CO-SET processes can involve intrinsic (e.g. orbital) excitations of quantum dots as well as vibrational states. Here, as opposed to the measurements of Ref. Schleser et al. (2005), the highly regular excitation spectrum observed in Fig. 2(d) strongly indicates a vibrational origin. The vibrational CO-SET lines are related to the two-hole charge state vibrational excitations seen in SET with negative slope. As the vibrational energy exceeds thermal broadening (), the observation of multiple excitations in CB strongly suggests storage and subsequent release of energy in the vibrational mode, involving phonon absorption sidebands Lüffe et al. (2008); Leijnse and Wegewijs (2008); LeRoy et al. (2004). This stands in contrast to the usual assumption that vibrational relaxation is fast and that the mechanical system is predominantly found in its ground state. The required energy is provided by inelastic cotunneling, exciting the vibrational mode and causing its non-equilibrium occupation.
A particularly interesting feature of the measurement of Fig. 2(a-e) is that the CO-SET lines can only be observed beyond a weakly gate-dependent threshold at (marked X in the plots), where the differential conductance is enhanced; i.e. they only occur at energies higher than .
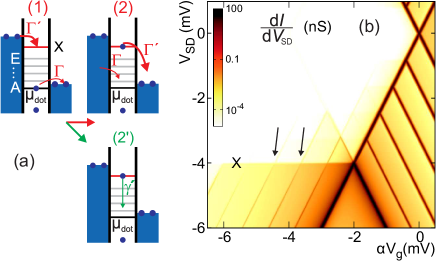
The line feature marked with X in the measurements represents the onset of an inelastic cotunneling current, corresponding to an electronic excitation of the quantum dot. To understand the resulting interplay between mechanical and electronic excitations we have performed model calculations, illustrated in Fig. 3. The transport calculations account for strong Coulomb effects as well as tunneling processes up to 4th order in the tunneling Hamiltonian, responsible for cotunneling, line broadening and level renormalization which are important close to SET resonance; see Ref. Leijnse and Wegewijs (2008) for details.
The two-hole ground state and its vibrational excitations are the origin of CO-SET lines as observed in the experiment. To demonstrate this idea, it suffices to consider a model with several equidistant states A–E (see Fig. 3(a), panel (1), and also sup ), which are coupled with the same rate to the one-hole ground state. In addition, an excited two-hole state X supporting a current with rate is introduced. Since the edge of the CB diamond becomes very broad in the experiment beyond this excitation, an estimate of the ratio of and based on the SET current is difficult. However, the strong signature of the inelastic cotunneling line associated with state X indicates that . The result of a calculation based on this model is shown in Fig. 3(b). The important characteristic of the experiment is reproduced: CO-SET lines are strongly enhanced beyond the threshold for inelastic cotunneling connected to state X (see arrows in Fig. 3(b)).
The appearance of a set of harmonic CO-SET lines at high bias can be explained by a subtle interplay of electronic and vibrational excitations, with two coexisting paths. Figure 3(a) illustrates these two paths; panels (1) and (2) for one and panel (1) and (2’) for the other. For energies larger than the one of the inelastic cotunneling step at a process involving two stages of inelastic cotunneling becomes feasible: the first effectively excites the dot from state A to state X (panel (1)), the second results in a transition from state X into one of the states B-E (panel (2)). The rate for each such cotunnel process is . Compared to the low bias situation, this significantly enhances the population of the vibrational excited states B-E, and thereby the visibility of the vibrational CO-SET lines, since without access to state X, the limiting rates for CO-SET are proportional to . Thus, while CO-SET lines can in principle also be present at small bias (), beyond the inelastic contunneling step they appear more pronounced: The strongly coupled excited state pumps the vibrational mode out of equilibrium, enhancing its population.
The second path that increases the occupation of the vibrationally excited states B-E involves direct relaxation of state X (panel (2’) in Fig. 3(a)) with a rate . As the precise value of is unknown, we have verified that the qualitative result that the CO-SET lines are strongly enhanced beyond the inelastic cotunneling step connected to state X persists for a large range of this parameter. An important further qualitative conclusion from the observation of CO-SET features is that relaxation from states B-E into the two-hole ground state A (rate in Fig. 2(f)) in the experiment can not be faster than tunneling out of the quantum dot ().
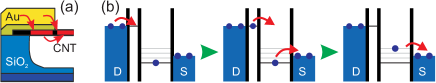
So far we have assumed that the weakly gate-dependent feature X in Fig. 2 corresponds to an electronic excited state. An alternative explanation invokes an electronic ground state of a second quantum dot forming within the nanotube, e.g. beneath one of the contact electrodes, as drawn in Fig. 4(a). Assuming this state has a much weaker gate coupling, we arrive at an equivalent mechanism for the non-equilibrium occupation of the vibrational mode. Local distortions and curving edges in the measurement of Figs. 1 and 2 may be taken as a hint of such a scenario, as has also been reported in Ref. Grove-Rasmussen et al. (2008).
Fig. 4(b) illustrates the transport process for this ‘double quantum dot’ case. The shielded additional small quantum dot displays a much weaker gate voltage dependence of the level energy. The line of enhanced differential conductance marked in Fig. 2 with X now describes its alignment at the drain lead with the drain Fermi edge. The small quantum dot can then be occupied by a sequential tunneling process as sketched in Fig. 4(b). Inelastic cotunneling through the main dot may follow, leading to the occupation of an excited vibrational state. Although the origin of, and tunneling processes associated with, state X differ from the first scenario, the main effect is the same: state X pumps the vibrational mode through consecutive tunneling events.
An intriguing feature of the measurement that has not been discussed so far is that the vibrational frequency in the charge state, as measured both from SET and CO-SET lines, is approximately twice as large as that in the charge state, seen as SET features only. This difference does not affect the pumping mechanism. It is possibly related to the fact that the observed quantum dot is in the few-carrier regime – in contrast to previous work on longitudinal phonon excitations in carbon nanotubes Sapmaz et al. (2006). Whereas tension only affects the longitudinal mode via higher-order effects Sapmaz et al. (2006), the transition from e.g. one to two trapped holes involves a distinct spatial redistribution of charge along the nanotube Deshpande and Bockrath (2008). This strongly affects the electrostatic force distribution, which makes variations of vibration mode energies and mode shapes likely. As shown in Ref. Sapmaz et al. (2006), the coupling to the lowest symmetric vibrational mode of the nanotube may vanish for a charge distribution localized at the center of the nanotube. In general one may thus expect that the excitation of different modes depends strongly on the charge state, as we observe in the experiment.
Finally, the experimental observation of vibrational CO-SET resonances allows to establish a lower boundary for the quality factor of the longitudinal mechanical mode Lüffe et al. (2008), independent of the detailed pumping mechanism. The tunnel current at the edge of the low-bias CB region (), , provides an approximation for the SET tunneling rate . For CO-SET to be visible, the lifetime of vibrational excitations must be larger than the corresponding timescale . With the vibrational energy , one obtains . Since we observe several sidebands, a higher value for is more likely than this lower boundary, depending on the specific relaxation processes.
In conclusion, we have observed a pattern of equidistant, gate-dependent vibrational excitations in the Coulomb blockade regime of a suspended carbon nanotube quantum dot. The appeareance of the excitations is explained in the context of co-tunnel assisted sequential electron tunneling via phonon absorption processes. Interestingly, the absorption sidebands of the quantized phonon mode are only visible above a finite bias voltage threshold. Two models for the enhancement of the non-equilibrium distribution of the mechanical mode are discussed which demonstrate that the mode can be “pumped” either by an electronic excitation of the nanotube, or by a ground-state of another small quantum dot within the same nanotube. The pumping mechanism offers a perspective for electric control of quantized mechanical motion in nanoscale transistors by employing the interplay with electronic degrees of freedom.
The authors would like to thank Y. Blanter and M. Poot for insightful discussions, and B. Otte and H. Pathangi for experimental help. Financial support by the Dutch organization for Fundamental Research on Matter (FOM), the NWO VICI program, NanoNed, DFG SPP-1243, the Helmholtz Foundation, and the FZ-Jülich (IFMIT) is acknowledged.
References
- Braig and Flensberg (2003) S. Braig and K. Flensberg, Phys. Rev. B 68, 205324 (2003).
- Lüffe et al. (2008) M. C. Lüffe, J. Koch, and F. von Oppen, Phys. Rev. B 77, 125306 (2008).
- Sazonova et al. (2004) V. Sazonova, Y. Yaish, H. Ustunel, D. Roundy, T. A. Arias, and P. L. McEuen, Nature 431, 284 (2004).
- Witkamp et al. (2006) B. Witkamp, M. Poot, and H. S. J. van der Zant, Nano Lett. 6, 2904 (2006).
- LeRoy et al. (2004) B. J. LeRoy, S. G. Lemay, J. Kong, and C. Dekker, Nature 432, 371 (2004).
- Sapmaz et al. (2006) S. Sapmaz, P. Jarillo-Herrero, Y. M. Blanter, C. Dekker, and H. S. J. van der Zant, Phys. Rev. Lett. 96, 026801 (2006).
- Park et al. (2000) H. Park, J. Park, A. K. L. Lim, E. H. Anderson, A. P. Alivisatos, and P. L. McEuen, Nature 407, 57 (2000).
- Smit et al. (2002) R. H. M. Smit, Y. Noat, C. Untiedt, N. D. Lang, M. C. van Hemert, and J. M. van Ruitenbeek, Nature 419, 906 (2002).
- Leturcq et al. (2009) R. Leturcq, C. Stampfer, K. Inderbitzin, L. Durrer, C. Hierold, E. Mariani, M. G. Schultz, F. von Oppen, and K. Ensslin, Nature Physics (2009), doi:10.1038/nphys1234.
- Bockrath et al. (1997) M. Bockrath, D. H. Cobden, P. L. McEuen, N. G. Chopra, A. Zettl, A. Thess, and R. E. Smalley, Science 275, 1922 (1997).
- Tans et al. (1997) S. J. Tans, M. H. Devoret, H. Dai, A. Thess, R. E. Smalley, L. J. Geerligs, and C. Dekker, Nature 386, 474 (1997).
- Deshpande and Bockrath (2008) V. V. Deshpande and M. Bockrath, Nature Physics 4, 314 (2008).
- Kuemmeth et al. (2008) F. Kuemmeth, S. Ilani, D. C. Ralph, and P. L. McEuen, Nature 452, 448 (2008).
- Jarillo-Herrero et al. (2004) P. Jarillo-Herrero, S. Sapmaz, C. Dekker, L. P. Kouwenhoven, and H. S. J. van der Zant, Nature 429, 389 (2004).
- Hüttel et al. (2008) A. K. Hüttel, M. Poot, B. Witkamp, and H. S. J. van der Zant, New Journal of Physics 10, 095003 (2008).
- Kong et al. (1998) J. Kong, H. T. Soh, A. M. Cassell, C. F. Quate, and H. Dai, Nature 395, 878 (1998).
- (17) See EPAPS Document No. XXXXX for additional plots. For more information on EPAPS, see http://www.aip.org/pubservs/epaps.html.
- Schleser et al. (2005) R. Schleser, T. Ihn, E. Ruh, K. Ensslin, M. Tews, D. Pfannkuche, D. C. Driscoll, and A. C. Gossard, Phys. Rev. Lett. 94, 206805 (2005).
- Leijnse and Wegewijs (2008) M. Leijnse and M. R. Wegewijs, Phys. Rev. B 78, 235424 (2008).
- Grove-Rasmussen et al. (2008) K. Grove-Rasmussen, H. I. Jørgensen, T. Hayashi, P. E. Lindelof, and T. Fujisawa, Nano Letters 8, 1055 (2008).