75282
Axisymmetric mass models of S0 and spiral galaxies with boxy bulges: mass-to-light ratios, dark matter and bars
Abstract
We examine a sample of 30 edge-on spiral and S0 galaxies that have boxy and peanut-shaped bulges. We compute model stellar kinematics by solving the Jeans equations for axisymmetric mass distributions derived from -band images. These simple models have only one free parameter: the dynamical mass-to-light ratio, which we assume is independent of radius. Given the simplicity of the modelling procedure, the model second velocity moments are strikingly good fits to the observed stellar kinematics within the extent of our kinematic data, which typically reach 0.5–1 (where is the optical radius), or equivalently 2–3 (where is the effective or half-light radius). We therefore find no evidence for a dominant dark matter component within the optical disk of spiral galaxies. This is equally true of the S0s in our sample, which significantly extends previous observational constraints on dark matter in these galaxies. The predicted kinematics do deviate slightly but systematically from the observations in the bulge region of most galaxies, but we argue that this is consistent with the claim that boxy and peanut-shaped bulges are bars viewed edge-on.
keywords:
dark matter — galaxies: bulges — galaxies: elliptical and lenticular, cD — galaxies: kinematics and dynamics — galaxies: spiral — galaxies: structure1 Introduction
Previous studies indicate with some certainty that dark matter does not make a significant contribution to the total mass within the optical radius, , of disk galaxies (e.g. Palunas & Williams, 2000; Bell & de Jong, 2001; Kassin et al., 2006). Similar studies of ellipticals find little evidence for significant dark matter within the effective radius, (e.g. Gerhard et al., 2001; Rusin et al., 2003; Romanowsky et al., 2003; Cappellari et al., 2006; Thomas et al., 2007). However, degeneracies in the modelling mean that the dark matter content of ellipticals is more uncertain. Moreover, .
Non-axisymmetric galaxies make it possible to lift degeneracies in the contributions from luminous and dark matter by ascribing non-circular motions to luminous matter only (e.g. Englmaier & Gerhard, 1999; Weiner et al., 2001). Fast observed pattern speeds also constrain dark matter in barred disks (e.g. Debattista & Sellwood, 2000; Aguerri et al., 2003; Gerssen et al., 2003).
In this study we use the sample of thirty S0 and spiral galaxies with a boxy or peanut-shaped bulge of Bureau & Freeman (1999) to constrain their dark matter content. From previous numerical and observational work, such galaxies are thought to be barred disk galaxies viewed edge-on (e.g. Kuijken & Merrifield, 1995; Bureau & Freeman, 1999; Chung & Bureau, 2004; Méndez-Abreu et al., 2008).
2 Method and assumptions
We modelled the stellar kinematics of the sample galaxies by making two key assumptions: that dark matter is an insignificant dynamical component and that these galaxies are axisymmetric (so are unbarred). In this way, we were able to constrain the dark matter content while simultaneously seeking independent confirmation that boxy bulges are bars viewed edge-on.
We first parametrized the apparent light distributions of the galaxies using -band images (Bureau et al., 2006) and the multi-Gaussian expansion method (Emsellem et al., 1994). We deprojected these light distributions by assuming that the galaxies are axisymmetric. We then converted the intrinsic light distributions to intrinsic mass distributions by assuming constant mass-to-light ratios. This is equivalent to assuming either that there is no significant dark matter, or that the dark matter distribution follows the visible matter in shape and scale (which would be inconsistent with CDM). Finally, we computed predictions of the stellar second velocity moments integrated along the line-of-sight by solving the Jeans equations under the assumption of constant anisotropy in the meridional plane (see Cappellari 2008 for details).
3 Results
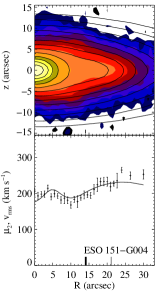
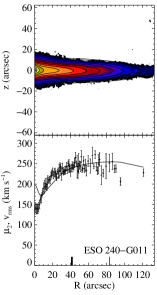
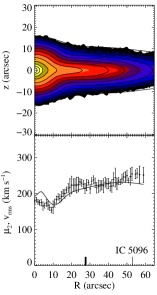
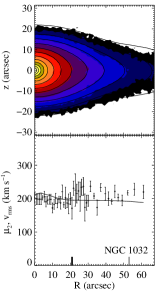
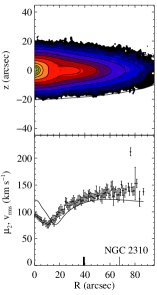
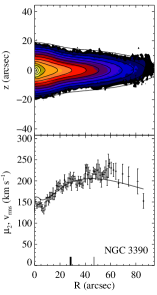
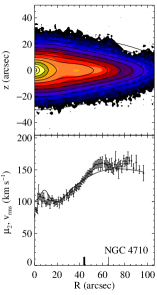
Results for 9 of the 30 galaxies are shown in Figure 1 (see Williams et al. 2008 for figures for the complete sample). Bearing in mind that our modelling procedure contains just one free parameter, the mass-to-light ratio (which simply scales the models up and down), the model second moments are strikingly accurate representations of the kinematic data (themselves from Chung & Bureau 2004). The models shown assume isotropy (, ). We experimented with anisotropic models with and found that, outside the bulge, it did not significantly affect the models. There is a slight but systematic deviation of the models within the central 10 arcsec or so, a region which roughly corresponds to the boxy bulges (and thus the non-axisymmetric barred regions).
4 Discussion
Because our models are such good fits to the data, they provide no evidence for a dominant dark component within 0.5–1 or 2–4 in a sample of thirty S0 and spiral galaxies. This is consistent with previous studies of spiral galaxies. It also extends the radius out to which observational constraints may be placed on the dark matter content of S0s. In fact, since S0s have been demonstrated to be observationally equivalent to fast-rotating ellipticals (Emsellem et al., 2007; Cappellari et al., 2007), this statement may also be tentatively applied to fast-rotating ellipticals.
The -band dynamical mass-to-light ratios that we measure are typically in the range 1–2 . This is consistent with those of the SAURON sample (Cappellari et al., 2006), but the mass-to-light ratios predicted by the single stellar population models of Maraston (2005) with a Kroupa initial mass function do not exceed 1.4 . This may thus hint at the presence of dynamically subdominant dark haloes. To place constraints on the amount, we have constructed Jeans models which explicitly include dark halos (Williams et al., 2008)
We are limited by the small size of our non-boxy control sample, but the slight but systematic deviation of the models within the bulge regions is consistent with the claim that boxy bulges are bars viewed edge-on. The sense of the discrepancy (model data) is also consistent with the construction of the sample, which is dominated by bars viewed side-on (end-on bars appear spheroidal so were not included in this boxy sample). The radial extent of this discrepancy is smaller than the bars, which are probably about twice the length of the boxy bulge (Athanassoula, 2005), but simple models have shown that the axial ratio of the orbits supporting the bar decreases rapidly toward unity from its peak at around 20 percent of the length of the bar (see, e.g., Figure 2 (a) of Bureau & Athanassoula, 1999).
We will follow up the present work by using the derived dynamical mass-to-light ratios in two ways. Firstly, we will compare them to those inferred from stellar population syntheis models based on absorption line strength indices, providing further constraints on the dark matter content and initial mass function of the galaxies. Secondly we will compute total dynamical masses and study the Tully-Fisher relation of these galaxies, which should reveal information about the possible evolutionary link between spirals and S0s.


References
- Aguerri et al. (2003) Aguerri, J. A. L., Debattista, V. P., & Corsini, E. M. 2003, MNRAS, 338, 465
- Athanassoula (2005) Athanassoula, E. 2005, MNRAS, 358, 1477
- Bell & de Jong (2001) Bell, E. F. & de Jong, R. S. 2001, ApJ, 550, 212
- Bureau & Athanassoula (1999) Bureau, M. & Athanassoula, E. 1999, ApJ, 522, 686
- Bureau & Freeman (1999) Bureau, M. & Freeman, K. C. 1999, AJ, 118, 126
- Bureau et al. (2006) Bureau, M. et al. 2006, MNRAS, 370, 753
- Cappellari (2008) Cappellari, M. 2008, MNRAS, 390, 71
- Cappellari et al. (2006) Cappellari, M. et al. 2006, MNRAS, 366, 1126
- Cappellari et al. (2007) Cappellari, M. et al. 2007, MNRAS, 379, 418
- Chung & Bureau (2004) Chung, A. & Bureau, M. 2004, AJ, 127, 3192
- Debattista & Sellwood (2000) Debattista, V. P. & Sellwood, J. A. 2000, ApJ, 543, 704
- Emsellem et al. (1994) Emsellem, E., Monnet, G., & Bacon, R. 1994, A&A, 285, 723
- Emsellem et al. (2007) Emsellem, E. et al. 2007, MNRAS, 379, 401
- Englmaier & Gerhard (1999) Englmaier, P. & Gerhard, O. 1999, MNRAS, 304, 512
- Gerhard et al. (2001) Gerhard, O. et al. 2001, AJ, 121, 1936
- Gerssen et al. (2003) Gerssen, J., Kuijken, K., & Merrifield, M. R. 2003, MNRAS, 345, 261
- Kassin et al. (2006) Kassin, S. A., de Jong, R. S., & Weiner, B. J. 2006, ApJ, 643, 804
- Kuijken & Merrifield (1995) Kuijken, K. & Merrifield, M. R. 1995, ApJL, 443, L13
- Maraston (2005) Maraston, C. 2005, MNRAS, 362, 799
- Méndez-Abreu et al. (2008) Méndez-Abreu, J. et al. 2008, ApJL, 679, L73
- Palunas & Williams (2000) Palunas, P. & Williams, T. B. 2000, AJ, 120, 2884
- Romanowsky et al. (2003) Romanowsky, A. J. et al. 2003, Science, 301, 1696
- Rusin et al. (2003) Rusin, D., Kochanek, C. S., & Keeton, C. R. 2003, ApJ, 595, 29
- Thomas et al. (2007) Thomas, J. et al. 2007, MNRAS, 382, 657
- Weiner et al. (2001) Weiner, B. J., Sellwood, J. A., & Williams, T. B. 2001, ApJ, 546, 931
- Williams et al. (2008) Williams, M. J., Bureau, M., & Cappellari, M. 2008, MNRAS, submitted