A New Feature in the Spectrum of the Superluminous LMC Supergiant HDE 269896
Abstract
We have found strong selective emission of the N II 5000 Å complex in the spectrum of the LMC hypergiant HDE 269896, ON9.7 Ia+. Since this object also has anomalously strong He II 4686 emission for its spectral type, an unusually wide range of ionization in its extended atmosphere is indicated. The published model of this spectrum does not reproduce these emission features, but we show that increased nitrogen and helium abundances, together with small changes in other model parameters, can do so. The morphological and possible evolutionary relationships of HDE 269896, as illuminated by the new spectral features, to other denizens of the OB Zoo are discussed. This object may be in an immediate pre-WNVL (Very Late WN) state, which is in turn the quiescent state of at least some Luminous Blue Variables.
More generally, the N II spectrum in HDE 269896 provides a striking demonstration of the occurrence of two distinctly different kinds of line behavior in O-type spectra: normal absorption lines that develop P Cygni profiles at high wind densities, and selective emission lines from the same ions that do not. Further analysis of these features will advance understanding of both atomic physics and extreme stellar atmospheres.
1 Introduction
Inverse N vs. C, O anomalies in OB absorption-line spectra, denoted as OBN and OBC, have been described by Walborn (1976, 2003). It is now generally accepted that the morphologically normal majority of OB supergiants display an admixture of CNO-cycled material in their atmospheres and winds, while the relatively rare OBC objects have physically normal (i.e., main-sequence) CNO abundances, and the OBN may have enhanced mixing as a result of additional effects such as binary interactions or rapid initial rotational velocities, with homogeneous evolution in extreme cases (Maeder & Meynet 2000).
For instrumental and historical reasons, as well as sometimes scientific ones, optical stellar spectroscopy has usually concentrated on certain wavelength regions, such as the blue-violet or the red. As a result, new phenomena may be encountered when the orphan regions are examined. A recent example is the unexpected discovery of CNO anomalies in O2 spectra, from a survey of the 3400 Å region (Walborn et al. 2004; Morrell et al. 2005). Another example is the subject of this report, arising from a digital OB spectral-classification atlas extending somewhat beyond the traditional blue-violet limit around H (http://www.fcaglp.unlp.edu.ar/mariela/atlas-mariela/index.htm).
The spectrum of HDE 269896 (= Radcliffe (R) 129, Sanduleak (Sk) ), one of the brightest OB stars in the Large Magellanic Cloud, was first described in detail by Hyland & Bessell (1975) and Walborn (1977). It displays two unusual characteristics: an emission line of He II 4686 at its relatively late spectral type, and the CNO absorption-line intensity anomalies that define the ON supergiant class. At earlier spectral types, the 4686 emission (Of) effect is a luminosity indicator (Walborn 1971, 1973, 2008; Walborn & Fitzpatrick 1990); hence, its presence in this spectrum was interpreted as an effect of superluminosity, which is supported by the very bright of 8.1, a magnitude brighter than typical Ia supergiants. Thus, this spectrum was classified ON9.7 Ia+ by Walborn (1977).
2 Observations
The observations for the atlas, including HDE 269896 and several comparison objects shown below, were obtained by M.A.C. at the CASLEO “Jorge Sahade” 2.15 m telescope in San Juan, Argentina, during 2001–2004. (HDE 269896 was observed on 2001 February 5.) The REOSC echelle spectrograph (on loan from the Institut d’Astrophysique de Liège) was used in its non-echelle mode with a 200–300 m slit; a 600 l mm-1 grating; and a Tek , 24 m pixel CCD, covering the 3700–5600 Å range at a reciprocal dispersion of 1.64 Å pix-1 (resolution Å) and typical S/N of 150–200. The exposure times ranged from 20 s for Normae to 600 s for HDE 269896 ( = 11.36, () = 0.00). Reductions were performed with standard IRAF routines. (IRAF is distributed by NOAO, operated by AURA, Inc., under agreement with the NSF.)
We also make use of high-resolution spectroscopy of HDE 269896 from the Ultraviolet-Visual Echelle Spectrograph (UVES) at the European Southern Observatory Very Large Telescope (VLT). These data are described and discussed by Evans et al. (2004); they were obtained by L. Kaper.
3 Results
The low-resolution spectrogram of HDE 269896 is shown in Figure 1, together those of four Galactic ON, OC, and normal supergiants of the same spectral type for comparison. All of these spectra are also compared by Walborn & Fitzpatrick (1990) at twice the resolution, but only to 4750 Å. The absorption-line CNO anomalies are best seen here in the ratio of N III 4640 to C III 4650. HDE 269896 also stands out by its strong H emission, weakened H absorption, and He II 4686 emission, which are diagnostics of its higher luminosity. In addition, it is now seen to have a strong N II 5000 Å emission feature, which is present more weakly in the other ON supergiant HD 105056, but completely absent in the OC and normal objects. This N II feature is a blend of several lines, as shown in high-resolution data for HD 105056 by Walborn (2001), and more weakly still in some related northern objects by Walborn & Howarth (2000). Thus, it is a further important diagnostic of nitrogen enhancement, and perhaps luminosity as well, in late-O supergiants.
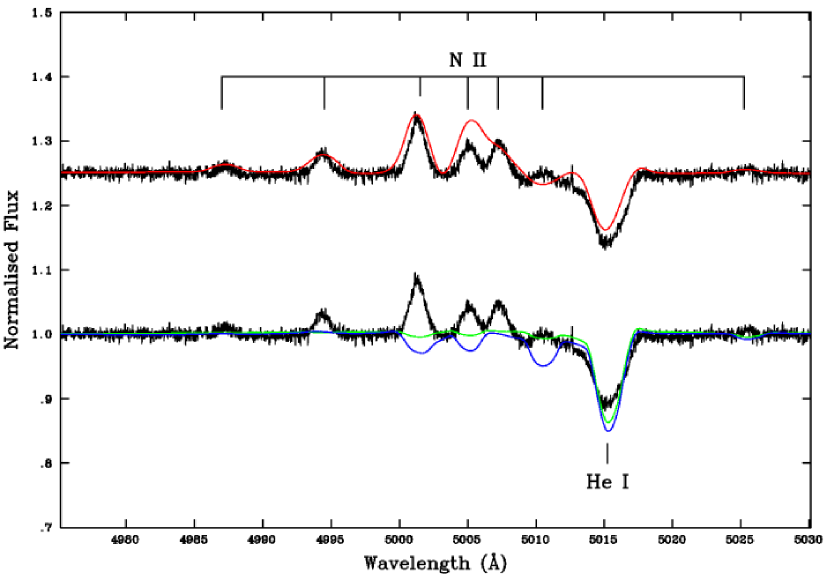
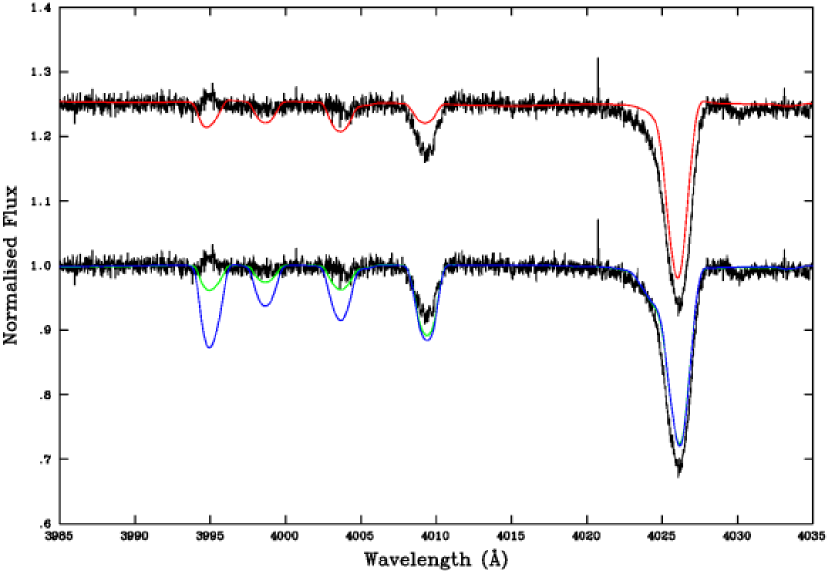
Sections of the VLT/UVES observation of HDE 269896 are displayed in Figures 2, 3, and 4, and compared with three different model fits. The model parameters are specified in Table 1, and equivalent-width (EW) measurements of N II lines in both the data and the models are listed in Table 2. Negative EW values signify emission lines. The transitions are shown with the upper levels first, as appropriate for emission lines. Relative intensities of the lines from the NIST Atomic Spectra Database (Ralchenko et al. 2008) are also listed, to emphasize that they are all comparable. However, as seen in the figures and table, in the stellar spectrum the lines fall into two groups with qualitatively distinct behaviors: those with absorption or incipient P Cygni profiles, and those with narrow, symmetrical emission profiles. The latter are typical selective emission lines, as reviewed and discussed in detail by Walborn (2001). The UVES data show that the next N II downward transitions, in the 5700 region, not discussed here, are also in selective emission in HDE 269896.
4 Discussion
The ionization potentials of H0, N+, and He+ are 13.6, 29.6, and 54.4 eV, respectively. It is surprising to see both N II and He II features in the same spectrum; the former corresponds to later and the latter to earlier spectral types than that of HDE 269896. Thus, this superluminous object must have an unusually extended atmosphere with a large range of ionization conditions. These features together provide constraints on models of this atmosphere, as substantiated below.
Fitzpatrick (1991) discovered an interesting LMC relative of HDE 269896, namely Sk , O9.7 Ia+. As implied by the spectral type, it has similar values of the classification criteria, including He II 4686 emission (albeit somewhat weaker, consistent with its fainter but still superluminous of 7.5), and morphologically normal CNO features. The optical spectra of both objects are illustrated by Fitzpatrick (1991), and their UV spectra from 900 through 1900 Å by Walborn, Parker, & Nichols (1995) and Walborn et al. (2002a). Comparative astrophysical analyses of these two stars are of considerable interest.
Indeed, they have been analyzed similarly by Crowther et al. (2002) and Evans et al. (2004). Sections of the spectrum of HDE 269896 analyzed in the latter paper are reproduced here in Figures 2–4, and compared with the adopted model spectrum in green. It is seen that, while fitting the He I absorption lines well, the adopted model does not reproduce any of the N II or He II emission lines; in fact, it does not reproduce the N III absorption-line strengths, either. Fortunately, two other, unpublished trial models run at the same time are available; they are also shown here, in blue and red. The blue model, with an increased N abundance (Table 1), does not produce emission lines, either. However, the red model, with a similarly increased N abundance, but also somewhat lower effective temperature and increased mass-loss rate, does produce both N II and He II emission lines; actually, the N II emission is somewhat overestimated (Table 2). On the other hand, the He I lines are badly underproduced, which is why this model was not favored at the time. D. Lennon (priv. comm.) has suggested that increasing the He abundance above the number ratio to H of 0.2 adopted by Evans et al. (2004) may remedy this discrepancy. The results discussed here indicate that it may well be possible to reproduce most features in the optical spectrum of HDE 269896 with relatively small adjustments to the model parameters.
It is also very important to understand the atomic processes that produce the selective emission lines in O-type spectra, as emphasized by Walborn (2001). These are lines that come into emission while others from the same ions remain in absorption; they are for the most part photospheric and respond to the temperature and luminosity. A striking analogy to the N II lines discussed here, but at higher ionization, is provided by the selective emission in N IV 4058 vs. the absorption or P Cygni profiles in the 3480 blend from the same ion, in early-O spectra (Walborn et al. 2004; Morrell et al. 2005). It is remarkable that current models can produce these emission lines; evidently the essential physics has been correctly incorporated. However, there has been no systematic effort to extract and elucidate the mechanisms involved, as was done for the Of N III 4634-4640-4642 triplet by Mihalas, Hummer, & Conti (1972) and Mihalas & Hummer (1973). Such an effort will certainly provide interesting insights into the ionic level-population processes, and in turn further sensitive diagnostics for hot atmospheres.
Finally, it is interesting to compare HDE 269896 to other objects showing these N II emission lines, particularly the WN10 and WN11 types defined by Crowther & Smith (1997); see also Smith, Crowther, & Prinja (1994). These objects have much more extensive emission-line spectra, including a strong He I 5016 P Cygni profile adjacent to and blended with the N II feature, which diagnose much denser winds. Their typical He/H ratios range from 0.3 to 0.6. Clearly HDE 269896 is a highly evolved object, but less so than the WN10/11 stars. Thus, it is reasonable to propose that it may be in an immediate pre-WNVL (Very Late WN) stage, i.e., that it will develop a denser, slower wind, a more extensive emission-line spectrum, and a higher surface He/H ratio as its evolution proceeds. Many (perhaps all) WNVL objects are now recognized as quiescent states of Luminous Blue Variables (Walborn et al. 2008 and references therein), and HDE 269896 has a comparable luminosity (Humphreys & Davidson 1994). HDE 269896 is located in relative isolation, north of 30 Doradus, but near the O2 III(f*) star Sk , also a very massive, likely WN progenitor (Walborn et al. 2002b).
References
- (1) Crowther, P.A., Hillier, D.J., Evans, C.J., Fullerton, A.W., De Marco, O., & Willis, A.J. 2002, ApJ, 579, 774
- (2) Crowther, P.A., & Smith, L.J. 1997, A&A, 320, 500
- (3) Evans, C.J., Crowther, P.A., Fullerton, A.W., & Hillier, D.J. 2004, ApJ, 610, 1021
- (4) Fitzpatrick, E.L. 1991, PASP, 103, 1123
- (5) Humphreys, R.M., & Davidson, K. 1994, PASP, 106, 1025
- (6) Hyland, A.R., & Bessell, M.S. 1975, Proc. Astr. Soc. Australia, 2, 353
- (7) Maeder, A., & Meynet, G. 2000, ARA&A, 38, 143
- (8) Mihalas, D., & Hummer, D.G. 1973, ApJ, 179, 827
- (9) Mihalas, D., Hummer, D.G., & Conti, P.S. 1972, ApJ, 175, L99
- (10) Morrell, N.I., Walborn, N.R., & Arias, J.I. 2005, PASP, 117, 699
- (11) Ralchenko, Yu., Kramida, A.E., Reader, J., & NIST ASD Team 2008, NIST Atomic Spectra Database (v3.1.5), http://physics.nist.gov/asd3
- (12) Smith, L.J., Crowther, P.A., & Prinja, R.K. 1994, A&A, 281, 833
- (13) Walborn, N.R. 1971, ApJS, 23, 257
- (14) —– 1973, AJ, 78, 1067
- (15) —– 1976, ApJ, 205, 419
- (16) —– 1977, ApJ, 215, 53
- (17) —– 2001, in ASP Conf. Ser., 242, Eta Carinae & Other Mysterious Stars, ed. T. Gull, S. Johansson, & K. Davidson (San Francisco: ASP), 217
- (18) —– 2003, in ASP Conf. Ser., 304, CNO in the Universe, ed. C. Charbonnel, D. Schaerer, & G. Meynet (San Francisco: ASP), 29
- (19) —– 2008, in Spectral Classification, ed. R.O. Gray & C. Corbally (Princeton University Press), in press
- (20) Walborn, N.R., & Fitzpatrick, E.L. 1990, PASP, 102, 379
- (21) Walborn, N.R., Fullerton, A.W., Crowther, P.A., Bianchi, L., Hutchings, J.B., Pellerin, A., Sonneborn, G., & Willis, A.J. 2002a, ApJS, 141, 443
- (22) Walborn, N.R., & Howarth, I.D. 2000, PASP, 112, 1446
- (23) Walborn, N.R., Howarth, I.D., Lennon, D.J., Massey, P., Oey, M.S., Moffat, A.F.J., Skalkowski, G., Morrell, N.I., Drissen, L., & Parker, J.Wm. 2002b, AJ, 123, 2754
- (24) Walborn, N.R., Morrell, N.I., Howarth, I.D., Crowther, P.A., Lennon, D.J., Massey, P., & Arias, J.I. 2004, ApJ, 608, 1028
- (25) Walborn, N.R., Parker, J.Wm., & Nichols, J.S. 1995, International Ultraviolet Explorer Atlas of B-Type Spectra from 1200 to 1900 Å, NASA RP 1363
- (26) Walborn, N.R., Stahl, O., Gamen, R.C., Szeifert, T., Morrell, N.I., Smith, N., Howarth, I.D., Humphreys, R.M., Bond, H.E., & Lennon, D.J. 2008, ApJ, 683, L33
| Plot | Description | ||||
|---|---|---|---|---|---|
| Color | (kK) | ( yr-1) | |||
| Green | Evans et al. (2004) | 27.5 | 5.97 | 8.3 | |
| Blue | Increased N | 27.0 | 5.97 | 8.9 | |
| Red | Increased N | 26.0 | 5.97 | 8.9 | |
| Reduced |
| Wavelength | Rel. | Multiplet | Equivalent Widths (mÅ) | Comment | |||
|---|---|---|---|---|---|---|---|
| (Å) | Int. | Obs. | Red | Green | Blue | ||
| Absorption or P Cygni Lines: | |||||||
| 3995.0 | 1000 | 50 | 53 | 178 | |||
| 4601.5 | 550 | : | 38 | 16 | 82 | ||
| 4607.2 | 450 | ” | |||||
| 4613.9 | 360 | ” | |||||
| 4621.4 | 450 | ” | |||||
| 4630.5 | 870 | ” | 52 | 96 | 48 | 175 | |
| 4643.1 | 550 | ” | blended w. N iii | ||||
| Selective Emission Lines: | |||||||
| 4987.4 | 285 | ||||||
| 4994.4 | 450 | ” | |||||
| 5001.1 | 550 | 13 | 72 | blended | |||
| 5001.5 | 650 | ” | blended | ||||
| 5002.7 | 360 | blended | |||||
| 5005.2 | 870 | 7 | 50 | red model blend | |||
| 5007.3 | 550 | ” | red model blend | ||||
| 5010.6 | 450 | ||||||
| 5016.4 | 360 | blended w. He i | |||||
| 5025.7 | 360 | ” | 7 | 18 | |||