The Young, Massive, Star Cluster Sandage-96 After the Explosion of SN 2004dj in NGC 2403
Abstract
The bright Type II-plateau supernova (SN) 2004dj occurred within the young, massive stellar cluster Sandage-96 in a spiral arm of NGC 2403. New multi-wavelength observations obtained with several ground-based and space-based telescopes are combined to study the radiation from Sandage-96 after SN 2004dj faded away. Sandage-96 started to dominate the flux in the optical bands starting September 2006 (800 d after explosion). The optical fluxes are equal to the pre-explosion ones within the observational uncertainties. An optical Keck spectrum obtained 900 d after explosion shows the dominant blue continuum from the cluster stars shortward of 6000 Å as well as strong SN nebular emission lines redward. The integrated spectral energy distribution (SED) of the cluster has been extended into the ultraviolet region by archival XMM-Newton and new Swift observations, and compared with theoretical models. The outer parts of the cluster have been resolved by the Hubble Space Telescope, allowing the construction of a color-magnitude diagram. The fitting of the cluster SED with theoretical isochrones results in cluster ages distributed between 10 and 40 Myr, depending on the assumed metallicity and the theoretical model family. The isochrone fitting of the color-magnitude diagrams indicates that the resolved part of the cluster consists of stars having a bimodal age distribution: a younger population at 10–16 Myr, and an older one at 32–100 Myr. The older population has an age distribution similar to that of the other nearby field stars. This may be explained with the hypothesis that the outskirts of Sandage-96 are contaminated by stars captured from the field during cluster formation. The young age of Sandage-96 and the comparison of its pre- and post-explosion SEDs suggest M⊙ as the most probable mass range for the progenitor of SN 2004dj. This is consistent with, but perhaps slightly higher than, most of the other Type II-plateau SN progenitor masses determined so far.
Subject headings:
supernovae: individual (SN 2004dj) — galaxies: individual (NGC 2403)1. Introduction
The theory of stellar evolution predicts that massive stars () end their lives as core-collapse supernovae (CC SNe, e.g., Woosley et al. 2002). In particular, after the main-sequence phase the most massive stars undergo heavy mass loss, become stripped stellar cores and explode as Type Ib/c supernovae (SNe Ib/c; see Filippenko 1997 for a discussion of SN spectral classification). Stars close to the lower mass limit of CC are thought to produce Type II-plateau SNe (SNe II-P). Recent observations to detect the progenitors of CC SNe support this scenario. Currently there are 10 SNe II (1987A, 1993J, 1999ev, 2003gd, 2004A, 2004et, 2005cs, 2006ov, 2008bk; the last seven are Type II-P) whose progenitors have been directly identified in pre-explosion images (see Hendry et al. 2006; Li et al. 2007; Mattila et al. 2008; Leonard et al. 2008; Smartt et al. 2008, and references therein), and the mass estimates are –20 M⊙ for all of them. Moreover, upper mass limits were derived for a number of other SNe II from nondetections of their progenitors (Van Dyk et al., 2003; Maund & Smartt, 2005; Leonard et al., 2008), and the highest upper limit was found to be M⊙. These observations have led to the conclusion that SNe II-P likely originate from “low-mass” massive progenitors with M⊙ (Li et al., 2006, 2007; Smartt et al., 2008), and the fate of stars with M⊙ may be a SN Ib/c explosion.
On the other hand, the progenitors of SNe Ib/c (even the brightest and closest ones) have escaped direct detection so far (Crockett et al., 2007a). The most promising candidate is SN 2007gr, which occurred in a compact, massive stellar cluster in NGC 1058 that has been detected with the Hubble Space Telescope (HST) prior to explosion (Crockett et al., 2008).
SN 2004dj, the closest ( Mpc, Vinkó et al. 2006) and one of the brightest SNe since SN 1987A, was a Type II-P event. It occurred within a young, massive cluster, Sandage-96 (S96) in NGC 2403. SN 2004dj has been extensively studied through multi-wavelength observations; see Vinkó et al. (2006) (hereafter Paper I) for references. In particular, several attempts were made to infer the mass of the progenitor by comparing the pre-explosion magnitudes and colors of S96 with theoretical spectral energy distributions (SEDs) to determine the age, hence the turnoff mass, of the cluster. These resulted in a range of possible progenitor masses from M⊙ to M⊙ depending on the assumed metallicity and/or reddening (Maíz-Apellániz et al., 2004; Wang et al., 2005; Vinkó et al., 2006). However, all of these studies suffered from the age-reddening and age-metallicity degeneracy (Renzini & Buzzoni, 1986), because the available pre-explosion observations covered only the optical and near-infrared (NIR) bands.
The main aim of this paper is to derive further constraints on the progenitor mass of SN 2004dj from post-explosion observations of S96, made after its reappearance from the dimming light of the SN. The cluster has been successfully redetected both by our ground-based and space-based observations, showing no significant change in its optical light level with respect to the pre-explosion level. We have extended the wavelength coverage of the observed SED into the ultraviolet (UV) with new Swift/UVOT observations. Moreover, the cluster has been partially resolved by our new /ACS observations, which provides an additional opportunity to infer age constraints on its stellar population.
The paper is organized as follows. In §2 we present our new multi-wavelength observations made from the ground and space. The SED of the cluster and its color-magnitude diagram are constructed and fitted with theoretical model predictions in §3. We discuss the results in §4 and present our conclusions in §5.
2. Observations
2.1. Optical Data
2.1.1 Ground-Based Photometry
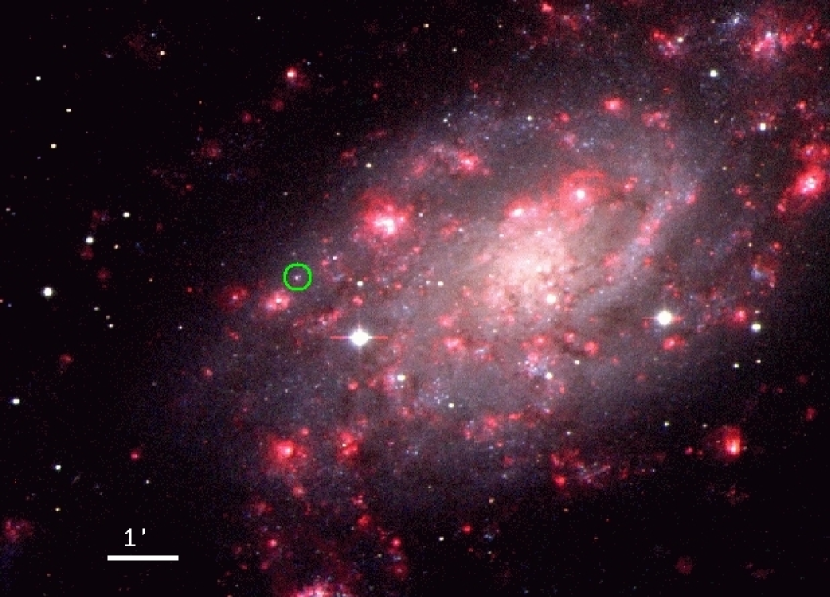
The light variation of SN 2004dj in the nebular phase was followed from Konkoly Observatory (see Paper I for a description of the telescopes and detectors). In addition, Johnson , Johnson , and narrow-band H images were taken with the 90Prime camera on the 2.3 m Bok telescope at the Steward Observatory, Arizona (Fig. 1, left panel).
The magnitudes of SN 2004dj were calculated via aperture photometry based on the same sequence of local standard stars as in Paper I. The photometric data obtained after 2005 May are summarized in Table 1.
The light curves are plotted in Figure 2. Following the usual decline in the nebular phase (starting d after explosion), the light curves approached a constant level around day 800; see the two right-hand panels of Figure 2.
As expected, the flattening of the light curves is caused by the increasing contribution of the radiation from S96, emerging from the fading light of SN 2004dj. In Figure 2 the dotted horizontal lines mark the pre-explosion magnitudes of S96 (see Paper I).
| UT Date | JD | Instrument | |||||
|---|---|---|---|---|---|---|---|
| 2,450,000 | (d) | (mag) | (mag) | (mag) | (mag) | ||
| 2005-11-09 | 3684.6 | 500 | 17.79 (0.08) | 17.25 (0.03) | 16.69 (0.08) | 16.44 (0.06) | Konkoly 0.6 m Schmidt |
| 2006-01-27 | 3762.5 | 577 | 17.89 (0.11) | 17.68 (0.05) | 17.19 (0.11) | 16.86 (0.09) | Konkoly 0.6 m Schmidt |
| 2006-08-23 | 3971.6 | 787 | 17.93 (0.11) | 17.71 (0.05) | 17.38 (0.11) | 17.00 (0.09) | Konkoly 0.6 m Schmidt |
| 2006-09-07 | 3986.3 | 801 | 17.98 (0.07) | 17.85 (0.03) | 17.50 (0.07) | 17.07 (0.06) | Konkoly 1.0 m RCC |
| 2006-09-22 | 4001.6 | 817 | 18.22 (0.10) | 17.79 (0.04) | 17.53 (0.10) | 17.08 (0.08) | Konkoly 0.6 m Schmidt |
| 2006-10-17 | 4026.6 | 842 | 18.01 (0.09) | 17.83 (0.04) | 17.53 (0.09) | 16.96 (0.08) | Konkoly 0.6 m Schmidt |
| 2006-12-22 | 4092.5 | 907 | 18.15 (0.09) | 17.88 (0.04) | 17.54 (0.09) | 17.08 (0.08) | Konkoly 0.6 m Schmidt |
| 2006-12-27 | 4097.6 | 913 | 18.11 (0.10) | 17.86 (0.04) | 17.51 (0.10) | 17.08 (0.08) | Konkoly 0.6 m Schmidt |
| 2007-01-28 | 4128.0 | 943 | 18.15 (0.06) | 17.86 (0.02) | – | – | Steward 2.3 m Bok |
| 2007-02-09 | 4141.4 | 956 | 18.13 (0.08) | 17.76 (0.04) | 17.51 (0.06) | 17.01 (0.08) | Konkoly 1.0 m RCC |
| 2007-03-06 | 4166.3 | 981 | 18.11 (0.08) | 17.87 (0.03) | 17.47 (0.06) | 16.99 (0.08) | Konkoly 1.0 m RCC |


From the two right-hand panels of Figure 2 it is apparent that the post-explosion magnitudes of S96 are almost identical to the pre-explosion ones in , , and . There is a very slight excess in the band ( mag), which is about the same as the photometric uncertainty of the data. Although it cannot be ruled out that this excess is due to some kind of systematic error in the calibration of the -band data (the deviation from the pre-explosion level is ), it is interesting that the ground-based and magnitudes agree very well with those obtained by Swift/UVOT (see §2.2.2).
2.1.2 Keck Spectroscopy

A late-time spectrum of SN 2004dj (exposure time 2200 s) was obtained on 2006 Dec. 23 ( d after explosion) with the DEIMOS spectrograph (Faber et al., 2003) mounted on the 10 m Keck-II telescope in Hawaii. The 1200 line mm-1 grating was used, with a slit wide, resulting in a resolution (full width at half-maximum intensity) of 2.7 Å. The slit was aligned close to the parallactic angle (Filippenko, 1982), so differential light losses were not a problem.
As seen in Figure 3, the Keck spectrum is clearly a composite of S96 and the nebular ejecta of SN 2004dj. Longward of 6000 Å, strong emission lines of H, [O I] 6300, 6363, and [Fe II] Å, characteristic of a typical nebular SN II-P spectrum at late phases, can be identified. Shortward of 6000 Å, the blue continuum dominates the spectrum; Na I D appears in emission, which emerges mostly from the SN ejecta, but H is in absorption. Clearly, the radiation from the young stellar population of S96 is visible in this regime. The shape of the spectrum is fully consistent with the predictions of population-synthesis models (see Paper I and §3).
2.1.3 HST Observations
SN 2004dj and its surrounding area was observed with HST/ACS on 2005 August 28, 425 d after explosion (GO-10607; PI. B. Sugerman). Four sets of 4 drizzled frames were obtained through the and filters, and 3 sets were recorded with the filter. In the latter case the POLUV polarization filter was also placed in the beam. This made it possible to study the polarization of the SN light, but slightly complicated the photometry of the frames, causing a systematic shift of the zeropoint in the standard transformation (see §3.2).
The ACS frames, reduced and calibrated by the pipeline (including MultiDrizzle), were downloaded from the archive at the Canadian Astronomy Data Centre111CADC is operated by the National Research Council of Canada with the support of the Canadian Space Agency.. Because SN 2004dj was still very bright compared with the rest of S96 at the epoch of these observations, its point-spread function (PSF) was subtracted from the ACS frames. We used the TinyTim software222http://www.stsci.edu/software/tinytim/tinytim.html . (version 6.3) for calculating the ACS PSFs in each filter. Since the analytical PSF works less effectively for drizzled frames, the flatfield-corrected “.FLT” frames were used for the PSF removal. After sub-pixel registration, the individual frames belonging to the same filter were averaged. The model PSF was then scaled to the peak of the SN and subtracted from the combined frame.
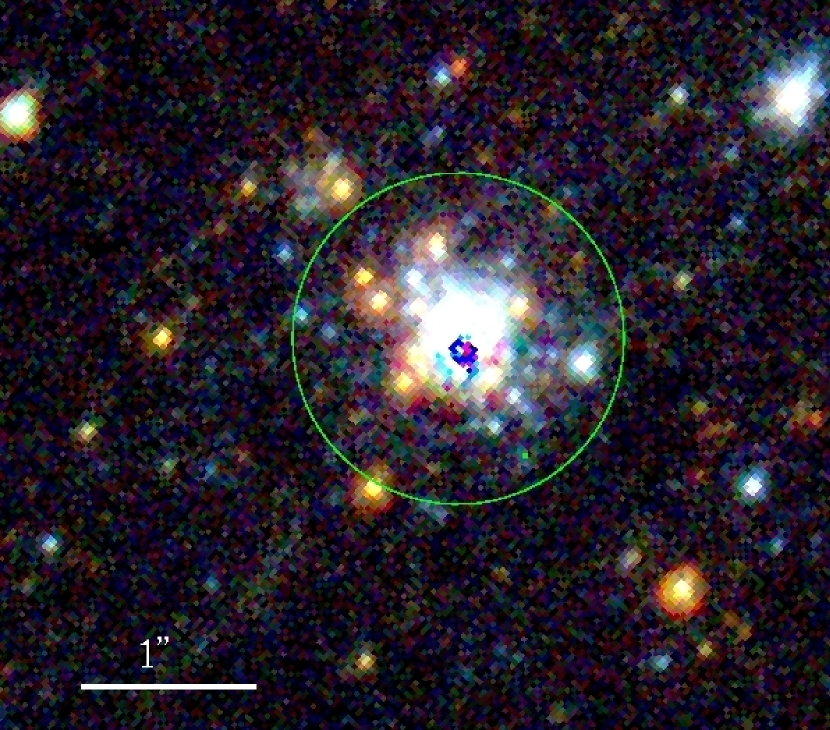
The result is shown in Figure 4. The encircled region ( pixels pc) contains S96 with its unresolved inner and resolved outer parts. Several bright red and blue giants are visible in the outer region. The color of the unresolved inner part is also very blue, in accord with the pre-explosion photometric observations and the proposed young cluster age (see Paper I). It is also apparent that SN 2004dj occurred near the projected center of the cluster (there are some artifacts due to the incomplete PSF removal at the SN position, but they are less than 1% of the subtracted SN flux).
Photometry of the stars appearing in the ACS frames was obtained with the DOLPHOT333http://purcell.as.arizona.edu/dolphot . 1.0 software (Dolphin, 2000). DOLPHOT incorporates corrections for geometric distortions of the ACS camera, cosmic-ray removal, object identification, PSF fitting (using precomputed PSFs via TinyTim), charge-transfer efficiency correction, and transformation into standard photometric systems. It works best with the flatfield-corrected “.FLT” frames. All of these frames were processed with DOLPHOT, and the resulting magnitudes belonging to the same filter were combined frame by frame. Only those stars that could be identified on at least two frames with the same filter were retained in the final list. The photometric errors were computed from the scatter of the individual data around their mean value, taking into account the individual magnitude errors computed by DOLPHOT. The final magnitudes were converted to Johnson-Cousins , , and using the calibration by Sirianni et al. (2005). Note that mag has been added to the transformed magnitudes to take into account the transmission of the POLUV polarization filter, which was used together with the filter during the observations. The results are analyzed in §3.2.
2.2. Ultraviolet Data
2.2.1 XMM-Newton Observations
| Obs. ID | UT Date | Exp. time | Fluxa | Fluxa | Fluxa | |||
|---|---|---|---|---|---|---|---|---|
| (s) | (mag) | (mag) | (mag) | |||||
| 0150651101 | 2003-04-30 | 6304 | 16.87 | 9.20 | 16.76 | 6.59 | 17.37 | 4.04 |
| 0.11 | 0.93 | 0.06 | 0.37 | 0.06 | 0.23 |
Prior to the explosion of SN 2004dj, S96 was observed with the Optical/UV Monitor telescope (OM) on board XMM-Newton (Mason et al., 2001) on 2003 April 30 (PI. M. Pakull). The FITS frames and tables containing the photometric data (reduced and calibrated by the SAS pipeline) were downloaded from the XMM-Newton Science Archive444http://xmm.esac.esa.int/xsa/index.shtml .. The instrumental magnitudes of S96 (object #1057) are listed in Table 2. Unfortunately, no or observations were made, so full transformation into the standard Johnson system cannot be computed. However, applying the UV transformation equations in the OM Calibration Documentation555http://xmm.vilspa.esa.es/external/xmm_sw_cal/calib/index.shtml ., the correction in the band is only mag; thus, the instrumental magnitudes in Table 2 should well represent the Vega-based standard magnitudes of S96.
Finally, the observed count rates were transformed into fluxes (in erg s-1 cm-2 Å-1) using the conversion factors listed in the OM Calibration Documentation (CAL-TN-0019-3-2, p. 17, Table 4). It is known that such a conversion is only approximate, because it depends on the SED of the object. However, the SED of S96 in the blue/UV regime is very similar to that of an early-type star or a white dwarf (cf. §3.1). The count rate to flux conversion was calibrated using white dwarf spectrophotometric standards. Therefore, the flux conversion of S96 is fairly robust.
2.2.2 Swift Observations
| Obs. ID | UT Date | Exp. time | Fluxa | Fluxa | Fluxa | Fluxa | Fluxa | Fluxa | ||||||
|---|---|---|---|---|---|---|---|---|---|---|---|---|---|---|
| (s) | (mag) | (mag) | (mag) | (mag) | (mag) | (mag) | ||||||||
| 00035870002 | 2006-10-09 | 2215 | – | – | – | – | 16.96 | 6.98 | 17.44 | 3.45 | 18.02 | 3.59 | 17.65 | 3.24 |
| 00035870003 | 2006-10-15 | 5553 | – | – | – | – | 16.91 | 7.33 | 17.25 | 4.08 | 17.94 | 3.88 | 17.81 | 2.81 |
| 00035870004 | 2007-04-06 | 2308 | 16.84 | 9.61 | 16.91 | 6.92 | 17.00 | 6.78 | 17.13 | 4.58 | – | – | – | – |
| 00036563001 | 2007-12-03 | 6440 | 16.81 | 9.89 | 16.80 | 7.66 | 16.95 | 7.09 | 17.31 | 3.88 | 18.24 | 2.93 | 17.76 | 2.94 |
| 00036563002 | 2007-12-06 | 2382 | 16.99 | 8.32 | 17.01 | 6.31 | 17.07 | 6.30 | 17.24 | 4.13 | 18.07 | 3.44 | 17.80 | 2.83 |
| average | 16.88 | 9.27 | 16.91 | 6.96 | 16.98 | 6.90 | 17.27 | 4.02 | 18.07 | 3.46 | 17.76 | 2.96 | ||
| 0.10 | 0.84 | 0.11 | 0.68 | 0.06 | 0.39 | 0.11 | 0.41 | 0.13 | 0.40 | 0.07 | 0.20 |
The Swift Observatory (Gehrels et al., 2004) was launched into orbit on 2004 November 20. Its Ultraviolet/Optical Telescope (UVOT, Roming et al. 2005) was used to observe SN 2004dj/S96 at five epochs. Table 3 summarizes the basic parameters of these observations. A color-combined UV image (made from the data obtained on 2007 December 3) is presented in the right-hand panel of Figure 1.
The UVOT observations were downloaded from the Swift data archive666http://heasarc.gsfc.nasa.gov/cgi-bin/W3Browse/swift.pl .. The sky-subtracted frames were processed and analyzed with a self-developed script in the following way. First, the individual exposures belonging to the same filter (stored as extensions of the same FITS file) were co-added with the UVOTIMSUM routine of the HEAsoft software777http://heasarc.gsfc.nasa.gov/docs/software/lheasoft/ .. For those frames that were obtained without binning, the summed frames were rebinned by binning () in order to enhance the signal-to-noise ratio (S/N) of the point sources. The fluxes of S96 and the local photometric standard stars (that could be identified on the UVOT frames) were computed with aperture photometry in IRAF888IRAF, the Image Reduction and Analysis Facility, is distributed by the National Optical Astronomy Observatory, which is operated by the Association of Universities for Research in Astronomy, Inc. (AURA) under cooperative agreement with the National Science Foundation (NSF).. The photometric calibration was done according to the latest prescriptions by Poole et al. (2008). The aperture radius was set as (5 pixels on the binned frames), while the sky was computed as the “mode” of the pixel values in an annulus with and pixels centered on the point source. The summed, sky-corrected fluxes in analog-to-digital units (ADU) were divided by the dead-time corrected exposure time (defined by the keyword EXPOSURE in the FITS headers) to obtain the raw count rates in ADU s-1. These raw count rates were corrected for coincidence loss following Poole et al. (2008).
Finally, the corrected count rates were transformed into magnitudes and physical fluxes by using the photometric calibrations given by Poole et al. (2008). (Note that we have applied the formulae based on the Pickles stellar spectra, instead of gamma-ray burst spectra, because the SED of S96 is more like that of a star than a gamma-ray burst.) No color-term correction was applied to the magnitudes, since we intend to compare physical fluxes rather than magnitudes from UVOT and other instruments. The color-term corrections have been computed only for checking the deviation of the UVOT magnitudes from the magnitudes in the standard Johnson/Bessell system for S96 (Poole et al., 2008). The corrections are mag, mag, and mag, where lower-case letters refer to the Swift filters. It is seen that the UVOT and magnitudes are fairly close to the standard system, while the magnitudes are slightly brighter. The final UVOT fluxes and their uncertainties are listed in Table 3; they are analyzed further in §3.1.

From our ground-based optical photometry (§2.1) it was concluded that SN 2004dj faded below the light level of S96 by September 2006 (800 d after explosion). Because the UV flux of SNe II-P diminishes more rapidly than the optical flux (Immler et al., 2007; Brown et al., 2007), the UVOT observations made in October 2006 and April 2007 recorded mostly the cluster light. Figure 5 shows the comparison of the UV fluxes with the Keck spectrum (dotted line) and ground-based fluxes (asterisks). The UV fluxes observed by different satellites before and after explosion agree nicely within the errors. The agreement is also very good in the and bands, between the ground-based and space-based observations; the differences are mag and mag in and , respectively. Similar agreement was obtained for some of our local photometric standard stars, although most of them were too bright for UVOT photometry.
3. Results
We now present the analysis of the observations described in the previous section.
3.1. SED Fitting
The physical properties of S96 were discussed by Maíz-Apellániz et al. (2004), Wang et al. (2005), and in Paper I. These studies were based on pre-explosion photometry of S96 (broad-band Johnson and the 14-color BATC system in the optical, and 2MASS in the NIR). Fitting the optical through NIR SED with single stellar population (SSP) models, all of these studies revealed that S96 is a young, compact stellar cluster with an age of 8–20 Myr. The uncertainty is caused by the strong age-reddening and age-metallicity correlations in the SED fitting, and also to the sensitivity of the stellar-evolution models applied for constructing the SED of an SSP with a given age.
Extending the wavelength coverage of the observed SED may help break the age-reddening-metallicity degeneracy (Renzini & Buzzoni, 1986; Kaviraj et al., 2007). The SED of young stellar clusters can be best characterized in the UV, because the UV luminosity, originating from the most massive, fast-evolving supergiants, strongly correlates with the cluster age (O’Connell, 1999; Buzzoni et al., 2007). By adding the UV data from XMM-Newton and Swift (§2.2) to the optical through NIR SED used in the previous studies, one can get a better constraint for the cluster age, and hence the SN mass.
There is, however, an additional, non-negligible source of systematic uncertainty in the interpretation of the SEDs of young massive clusters: they contain – stars, and the high-mass end of their initial mass function (IMF) is poorly populated. Because these stars are also the most luminous ones, the observed SEDs of clusters having the same physical parameters will statistically deviate from the model SED depending on the actual number of their most massive, luminous stars (Cerviño et al., 2002; Cerviño & Luridiana, 2004; Jamet et al., 2004; Cerviño & Luridiana, 2006). This clearly limits the applicability of model SEDs computed by assuming an analytical, completely sampled IMF (i.e., practically an infinite number of stars). Because this effect was not taken into account in the previous studies of S96, here we address it in detail.
In Table 4 we have collected all available photometric data (converted to fluxes in erg s-1 cm-2 Å-1) of S96, including both pre-explosion and post-explosion observations. We have used our photometry made d after explosion (Table 1) for the representation of the post-explosion flux in the optical. Unfortunately, there are no post-explosion observations in the bands at our disposal.
| Filter | References | |||
| Before explosion | ||||
| 2025 | 450 | 9.20 (0.93) | This paper (XMM) | |
| 2825 | 750 | 6.59 (0.37) | This paper (XMM) | |
| a | 3360 | 360 | 3.11 (0.62) | Wang et al. (2005) |
| 3450 | 900 | 4.04 (0.23) | This paper (XMM) | |
| 3663 | 650 | 3.58 (0.43) | Larsen (1999) | |
| c | 4210 | 320 | 3.28 (0.12) | Wang et al. (2005) |
| 4361 | 890 | 3.33 (0.29) | Paper I | |
| d | 4540 | 340 | 2.88 (0.08) | Wang et al. (2005) |
| 4872 | 1280 | 2.74 (0.10) | Davidge (2007) | |
| e | 4925 | 390 | 2.54 (0.16) | Wang et al. (2005) |
| f | 5270 | 340 | 2.22 (0.10) | Wang et al. (2005) |
| 5448 | 840 | 2.72 (0.11) | Paper I | |
| g | 5795 | 310 | 2.18 (0.08) | Wang et al. (2005) |
| h | 6075 | 310 | 2.14 (0.11) | Wang et al. (2005) |
| 6282 | 1150 | 1.93 (0.10) | Davidge (2007) | |
| 6407 | 1580 | 1.75 (0.15) | Paper I | |
| i | 6656 | 480 | 1.90 (0.10) | Wang et al. (2005) |
| j | 7057 | 300 | 1.98 (0.16) | Wang et al. (2005) |
| k | 7546 | 330 | 1.79 (0.09) | Wang et al. (2005) |
| 7776 | 1230 | 1.64 (0.10) | Davidge (2007) | |
| 7980 | 1540 | 1.37 (0.17) | Paper I | |
| m | 8023 | 260 | 1.59 (0.11) | Wang et al. (2005) |
| n | 8480 | 180 | 1.50 (0.23) | Wang et al. (2005) |
| o | 9182 | 260 | 1.35 (0.13) | Wang et al. (2005) |
| p | 9739 | 270 | 1.24 (0.25) | Wang et al. (2005) |
| 12200 | 2130 | 1.06 (0.08) | Skrutskie et al. (1997) | |
| 16300 | 3070 | 0.70 (0.07) | Skrutskie et al. (1997) | |
| 21900 | 3900 | 0.28 (0.05) | Skrutskie et al. (1997) | |
| After explosion | ||||
| 2030 | 760 | 9.27 (0.84) | This paper (Swift) | |
| 2231 | 510 | 6.96 ( 0.68) | This paper (Swift) | |
| 2634 | 700 | 6.90 (0.39) | This paper (Swift) | |
| 3501 | 875 | 4.02 (0.41) | This paper (Swift) | |
| 4329 | 980 | 3.46 (0.40) | This paper (Swift) | |
| 5402 | 750 | 2.96 (0.20) | This paper (Swift) | |
| 4361 | 890 | 3.75 (0.34) | This paper | |
| 5448 | 840 | 2.69 (0.25) | This paper | |
| 6407 | 1580 | 1.78 (0.23) | This paper | |
| 7980 | 1540 | 1.39 (0.24) | This paper | |

The pre- and post-explosion SEDs are plotted together in Figure 6. It is apparent that the two datasets agree within the errors. The agreement in the UV and optical bands implies that the removal of the flux of the progenitor of SN 2004dj from the integrated light of the cluster has not caused a significant loss of light in these bands.
In order to fit theoretical SEDs to the observations, we have defined an averaged “normal” SED of S96 by combining the pre- and post-explosion data. In the UV range, between and Å, we adopted the average of the fluxes from XMM-Newton/OM and Swift/UVOT. The ground-based data in this spectral range are expected to be less reliable than the satellite-based ones, because of the higher probability of systematic errors introduced by the local atmospheric conditions. In the optical we used the Johnson-Cousins data. In the NIR, only the pre-explosion 2MASS fluxes (Skrutskie et al., 1997) were available to us.
There is a possibility that the observed SED is somewhat contaminated by foreground/background stars belonging to NGC 2403, altering the fluxes from being entirely due to a SSP. The amount of this contamination is difficult to estimate, because S96 itself may contain some older stars captured from its galactic neighborhood (see §3.2 and §4). However, the background subtraction we applied during photometry should have removed most of the flux from background stars. Due to the compactness of S96 ( pc diameter, Fig.4), the number of foreground field stars should be minimal (see §3.2 for a detailed discussion). Consequently, the SED fluxes are expected to be due mostly to S96. Since S96 is by far the brightest source in this region, the contamination from field stars should not exceed the estimated errors of the “normal” SED fluxes, %.
During the analysis the distance of NGC 2403 was fixed at 3.5 Mpc. This optimal value is found by combining various distance measurement results for SN 2004dj and its host galaxy, as discussed in Paper I.
In order to test whether the effect of statistical IMF sampling allows the modeling of the cluster SED, Cerviño & Luridiana (2004) introduced the concept of the “lowest luminosity limit” (LLL). It can be simply expressed as follows: the integrated luminosity of the cluster must be higher than that of the most luminous star of the model isochrone, at any wavelengths. The LLL is a strong function of age and it also depends on the considered wavelength regime (or filter band). As expected, LLL gives the strongest constraint for the models with age 1–100 Myr (Cerviño & Luridiana, 2004). Because the possible ages of S96 found in previous studies are all in this interval, it is necessary to check whether the cluster meets this criterion. The normal SED fluxes described above were dereddened and converted to absolute magnitudes assuming a distance of 3.5 Mpc and mag (see Paper I). This resulted in mag, mag and increasing up to mag. The predictions for the most massive stars from the Padova isochrones (Cioni et al., 2006a, b) with Myr (the youngest age proposed for S96 so far) are , , and mag () and , , and mag () for the , , and bands, respectively. We see that S96 is at least mag brighter in the optical/NIR bands, and it is also mag brighter in . This criterion becomes more relaxed toward higher ages as the possible most luminous stars become fainter. Our first conclusion is that although S96 is close to the LLL for 8 Myr, it is definitely above it, so this cluster is sufficiently rich to make the comparison of its observed SED with theoretical models statistically feasible.
For comparison with the observations, we have applied three different classes of SSP models with somewhat different input physics. First, as in Paper I, we selected the GALAXEV models of Bruzual & Charlot (2003) that are based on the Padova evolutionary tracks. Second, we chose the SPEED models by Jimenez et al. (2004) that were computed using a new set of stellar interior models, evolutionary tracks, and different treatment of the mass loss. For both of these models, a Salpeter IMF Was adopted, similarly to Paper I and previous studies. The machine-readable data of these two model sets were downloaded from the SPEED website999http://www.astro.princeton.edu/raulj/SPEED/index.html .. Third, we applied the SSP models generated by the Starburst99101010http://www.stsci.edu/science/starburst99/ . code (Vázquez & Leitherer, 2005). The Starburst99 models are highly configurable; the user may choose between different evolutionary tracks, atmospheric models, and pre-computed spectral libraries to create a unique set of SSP models. In order to test the model dependency of the results, we have chosen the Geneva evolutionary tracks and Kroupa IMF, and generated SSP SEDs using metallicities , , and , between and Myr. Note that the metallicity resolution of the SPEED models is lower; only models with and are available. The age step of the Starburst99 models was selected as Myr sampling linearly between 1 and 100 Myr, providing much better age resolution than the SPEED models for Myr.
The model SEDs were compared with the observations via the usual fitting. Note that throughout the paper we use the reduced (the sum of the squares of residuals divided by the number of data points). The optimized parameters were the cluster mass , the cluster age , and the reddening , while the metallicity and the distance were kept fixed. The interstellar extinction at any wavelength in the considered UVOIR spectral regime was calculated adopting and the average Galactic reddening law of Fitzpatrick & Massa (2007).
First, the fitting was computed in the canonical way, not taking into account the statistical fluctuations in the IMF sampling. and the models were fitted directly to the observed normal SED, as if the cluster were composed of an infinite number of stars. In this case the function was defined as
| (1) |
where is the number of observed points in the normal SED, is the observed flux at wavelength (corrected for distance and extinction), is its uncertainty, and is the flux of the model SED with age , at the same wavelength. Because the model fluxes are usually normalized to 1 M⊙, the cluster mass enters simply as a scale parameter in this expression. The results of these calculations are summarized in Table 5. The age resolution for the SPEED models was slightly increased by interpolating between the two neighboring model SEDs for those ages that were not covered by the original models. However, without this correction, the best-fitting parameters did not change significantly. The cluster parameters inferred in this way are very similar to the results of earlier investigations cited above.
| Model | |||||
|---|---|---|---|---|---|
| ( yr) | () | (mag) | |||
| J04 | 0.004 | 8 | 27 | 0.09 | 1.422 |
| J04 | 0.020 | 24 | 99 | 0.04 | 2.313 |
| BC03 | 0.004 | 35 | 114 | 0.13 | 2.794 |
| BC03 | 0.020 | 26 | 92 | 0.13 | 0.536 |
| BC03 | 0.020 | 9 | 37 | 0.17 | 0.886 |
| SB99 | 0.004 | 40 | 90 | 0.08 | 3.279 |
| SB99 | 0.008 | 9 | 26 | 0.12 | 3.521 |
| SB99 | 0.020 | 9 | 24 | 0.10 | 1.624 |
| SB99 | 0.020 | 40 | 91 | 0.07 | 3.918 |
Second, the statistical IMF sampling was taken into account as follows. For each age and wavelength, an uncertainty was assigned for any model flux as a measure of the fluctuation of the model SED fluxes due to the random sampling of the IMF. Then, each model flux was modified as where is a random variable. This step was repeated () times, thus constructing a series of model SEDs that fluctuate around the original model fluxes. For the th model (), was computed as in Eq. (1). Finally, following the recommendation by an anonymous referee, the final was determined as
| (2) |
where is the likelihood that the th model describes the observations. Eq. (2) means that the likelihoods are averaged, and the final is computed from . This approach gives lower final values than the simple average of the individual values.
The modification of the function in Eq. (2) ensures that the is mostly sensitive to those models that are particularly affected by the sampling effect (i.e., those whose is high) but give a good fit to the observations, while giving lower weight to those models that produce inferior fits. Also, the value remains mostly unchanged when the random sampling effect is negligible, because in this case the individual values (and the corresponding s) are nearly the same for each random model.
Of course, the reliability of this approach depends heavily on the proper selection of the values. Moreover, the values belonging to different filters are correlated, because the addition or subtraction of one bright star would affect the cluster flux in all bands. This correlation is not reflected by our random models, as the fluctuations were added to the fluxes independently in each band. The proper treatment of all these effects would require full computation of detailed SSP models, taking into account the statistical population of the IMF, which is, however, beyond the scope of this paper.
Instead, we followed a simpler approach as a first approximation: a Salpeter IMF between 0.5 and 100 M⊙ was randomly populated with stars until the sum of their mass reached M⊙ (roughly the mass of S96). The luminosities of these stars in the bands were selected from Padova isochrones at a given age (between 4 and 100 Myr) and simply summed up to get an estimate of the cluster SED. One thousand such SEDs with the same cluster mass and age were generated and the standard deviations of the fluxes were computed at each wavelength.
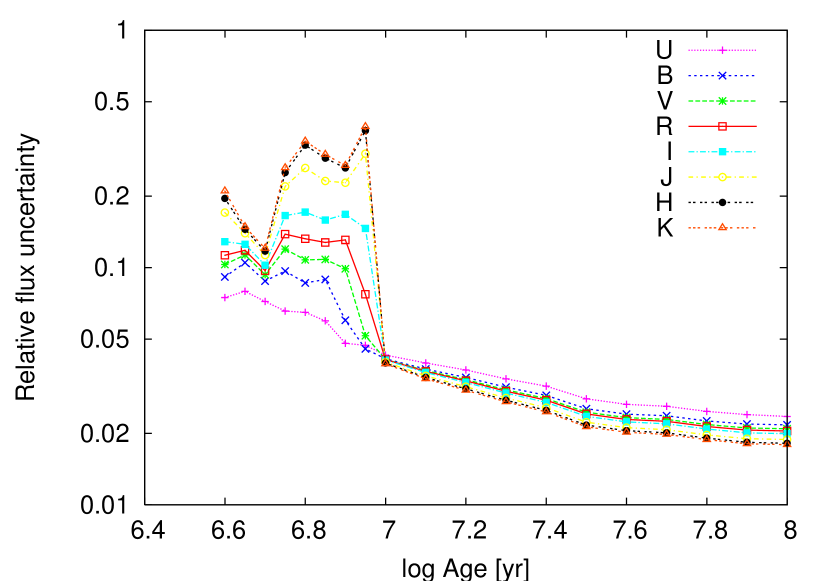
In Figure 7 the relative flux uncertainty (defined as , where is the mean flux of the SED at a given wavelength and is its standard deviation) for each band is plotted as a function of age for . The results are very similar in the case of and . It is apparent that the relative uncertainty drops below 5% for Myr, but it may reach up to 30% for younger clusters at certain bands. Generally, the and bands are less affected (the maximum uncertainty is 10%), but the scatter becomes higher toward the NIR. This means that the SED of such young clusters would fluctuate from cluster to cluster with amplitudes up to 30% of the flux values. The reason for the drop of the fluctuations above Myr is that the IMF fluctuations are most pronounced at M⊙ for a M⊙ cluster considered here, and the highest possible mass decreases quickly below this limit for Myr.
| Age | |||||||||||
|---|---|---|---|---|---|---|---|---|---|---|---|
| Myr | 0.05 | 0.05 | 0.05 | 0.08 | 0.10 | 0.10 | 0.15 | 0.20 | 0.25 | 0.30 | 0.30 |
| Myr | 0.03 | 0.03 | 0.03 | 0.03 | 0.03 | 0.03 | 0.03 | 0.03 | 0.03 | 0.03 | 0.30 |
The relative flux uncertainties () are listed in Table 6. These values were applied in the computations of the modified , as discussed above. The results of the minimizations are in Table 7. Note that in this case the interpolations between ages were not applied at all, and the fitting was computed only for those ages that were covered by the original models. However, when we used the simple average of the values as the final , instead of the likelihoods as in Eq. (2), the parameters of the best-fitting models did not change.
| Model | |||||
|---|---|---|---|---|---|
| ( yr) | ( M⊙) | (mag) | |||
| J04 | 0.004 | 8 | 34 | 0.11 | 1.802 |
| J04 | 0.02 | 20 | 94 | 0.04 | 2.511 |
| BC03 | 0.004 | 40 | 121 | 0.10 | 2.973 |
| BC03 | 0.02 | 20 | 86 | 0.14 | 0.629 |
| BC03 | 0.02 | 8 | 34 | 0.18 | 1.453 |
| BC03 | 0.02 | 10 | 41 | 0.15 | 1.492 |
| SB99 | 0.004 | 30 | 72 | 0.09 | 3.257 |
| SB99 | 0.008 | 14 | 30 | 0.08 | 3.018 |
| SB99 | 0.02 | 14 | 39 | 0.11 | 1.497 |
| SB99 | 0.02 | 28 | 72 | 0.09 | 2.666 |

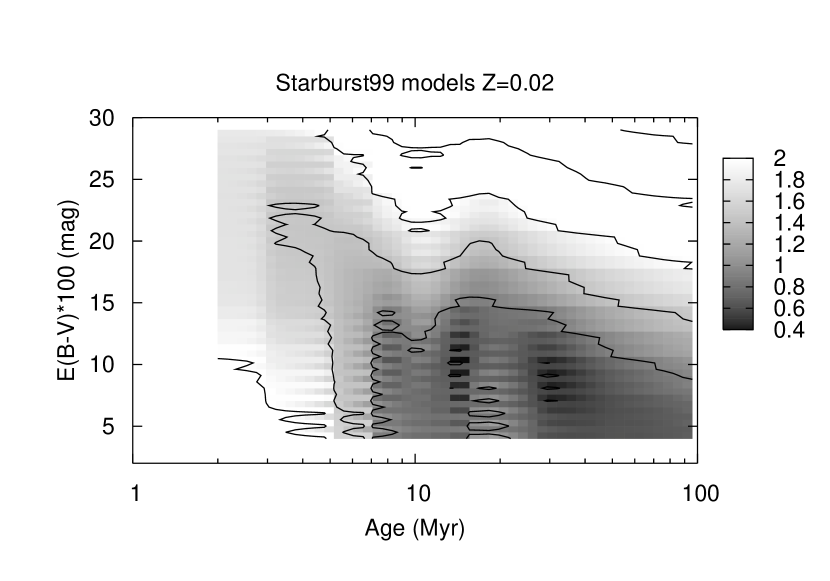


Figure 8 shows the results of the SED fitting with the IMF sampling effects taken into account (note that only the mean fluxes of the best-fitting models SEDs are plotted). The fitting of the unperturbed SEDs (i.e., ignoring the IMF fluctuations) resulted in very similar figures. In general, the models applied in this study give an adequate representation of the observed SED of S96 with the cluster parameters collected in Tables 5 and 7.
In many cases, the map (upper-right panel of Fig. 8) showed not one, but two distinct minima at two different ages, regardless of the presence or absence of IMF fluctuations. This was first noted by Maíz-Apellániz et al. (2004), and it is confirmed here. Maíz-Apellániz et al. (2004) found that their younger solution ( Myr) had the lower of the two minima. In the present case, it turned out to be model dependent. In the case of the BC03 models, the older solution has slightly lower , while for the SB99 models it is the younger one that has a deeper minimum.

Figure 9 shows the of the best-fitting models (i.e., those listed in Tables 5 and 7) plotted as a function of the cluster age . It is apparent that all the models with the lowest have solar metallicity () except one model by J04 which has . Also, the canonical model fits (without IMF fluctuations, open symbols) clearly show the two-age structure noted previously: a “young” solution with –10 Myr and an “older” one with –40 Myr, preferring the “young” solutions on the basis of . On the other hand, the models with IMF fluctuations (filled symbols) present a continuous distribution between the same age limits, also with a preference for the younger, solar-metallicity models. The disappearance of the bimodal distribution is mainly due to the fact that when random IMF sampling is taken into account, the younger, less massive models are more affected, which may increase their . (Though there might be a few models that fit the observations very well, this is probably not true for the majority of them.) This gives higher preference to the models that are less affected by random sampling, thus shifting the best-fitting models toward those with Myr.
Although the lowest- models have , this may be misleading, because the metallicity is a weakly constrained parameter in SED fitting. Additional information about the possible cluster metallicity may help strengthen the confidence of this parameter. Independent observations suggest that the average metallicity of NGC 2403 is below solar. The oxygen abundance in NGC 2403 at the position of S96 is [O/H] = , from spectroscopy of H II regions (Pilyugin et al., 2004). The distribution of red supergiants in the color-magnitude diagram of stars within the inner disk (Davidge, 2007) also suggests that the average metallicity of the whole population is . On the other hand, Maíz-Apellániz et al. (2004) preferred solar metallicity for S96 based on its galactocentric distance and the abundance gradient in NGC 2403 found by Fierro et al. (1986). There seems to be no clear consensus on the possible metallicity of S96. The fitting of the cluster SED as a whole suggests , but with high uncertainty. This problem is investigated further in the next section with the analysis of the resolved stellar population of S96.
Contrary to previous solutions (Paper I), the reddening parameter is much more tightly constrained in this case. Its average value is mag, while in previous studies values as high as mag were also proposed. Also, the age-reddening-metallicity degeneracy is much reduced in this case, owing to the increased wavelength coverage of the observed SED in the UV. This reddening value is in very good agreement with mag derived for SN 2004dj (Paper I). Although the SED of the whole cluster can, in principle, be much more affected by intracluster reddening than SN 2004dj itself if the position of the SN within the cluster is on the near side toward the observer, our new observations also strongly suggest that mag for all the stars resolved within the cluster (§3.2). We adopt mag for the rest of this paper.
Looking for additional constraints on the cluster parameters, we attempted to fit the high-resolution Keck spectrum (§2.1.2) with high-resolution SSP model spectra by González Delgado et al. (2005) that are based on the Geneva tracks. The motivation for this was the sensitivity of some spectral features on the cluster age and metallicity (Koleva et al., 2008). However, this analysis was complicated by the obvious presence of the SN nebular lines that dominate the red part of the integrated spectrum. Because H is in absorption, its origin should be mostly from cluster stars, but the contribution from SN 2004dj may be non-negligible. It is difficult to estimate the SN contamination at d, because very few observed SN spectra exist at this epoch. We examined three spectra of SN 1987A that were taken 700–1000 d past explosion (Pun et al., 1995), and found that there is an emission feature that may be attributed to H in these spectra. The amplitude ratio of these emission components, H/H, is found to be .
The SN 2004dj contamination at H in the Keck spectrum was estimated in the following way. First, a Lorentzian emission profile was fitted to the observed H line, taking into account the absorption component of the other cluster stars from the SSP models (note that the H emission due to SN 2004dj is so strong that the absorption component has only a minor effect on the fitted amplitude). Second, this profile was shifted to the rest wavelength of H with its amplitude divided by the H/H amplitude ratio (AR, using AR as default) and its damping parameter multiplied by (taking into account that the Lorentzian FWHM for pressure broadening scales with ). The fitting was recomputed using different amplitude ratios between and , to test the sensitivity of the results on this parameter.
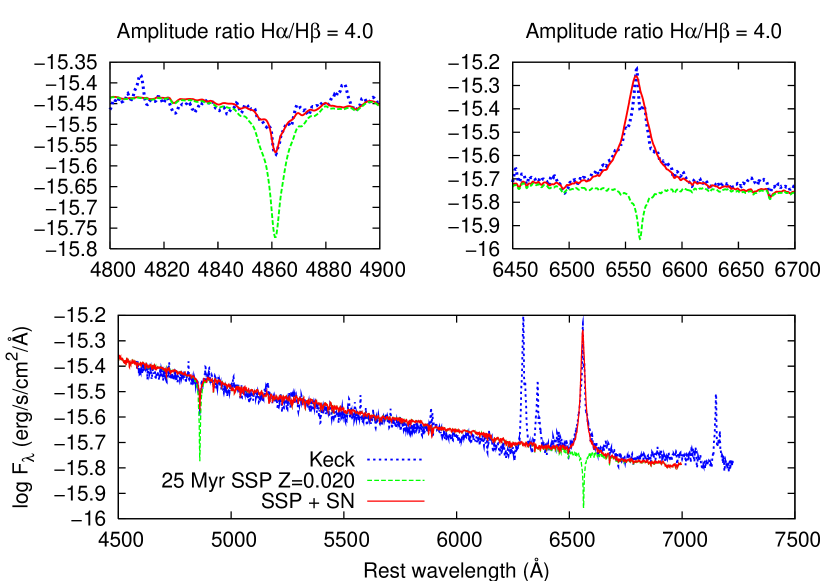
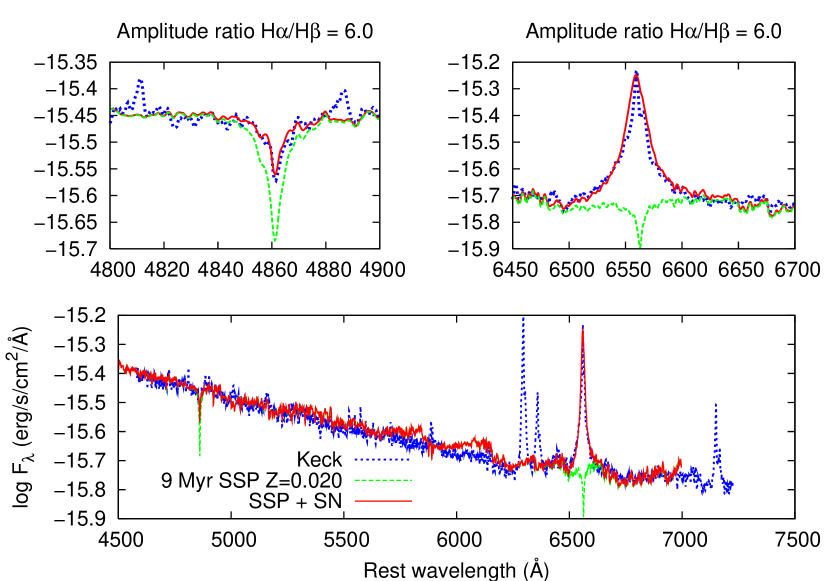
The fitting was computed so that the sum of the SSP model spectrum and the adopted H emission profile with fixed AR and was fitted to the observed spectrum by varying the age and the cluster mass. was fixed at mag and the model spectra were reddened using the same Galactic reddening law (Fitzpatrick & Massa, 2007) as for the SED fitting. We restricted the computation of in the vicinity of the H line, between 4820 Å and 4910 Å rest wavelengths.
It was found that the H profile can be fitted satisfactorily with a broad range of ages, depending on the chosen metallicity and H/H AR. Figure 10 shows two of the best-fitting models with and AR (left figure) and (right figure). The corresponding cluster ages are 25 Myr and 9 Myr, respectively. Assuming AR, the ages of the best-fitting models were found to be between 25 and 40 Myr depending on metallicity. However, they turned out to be 30 – 45 Myr for AR, and 9 – 25 Myr for AR. The results from SSP models based on Padova evolutionary tracks (González Delgado et al., 2005) showed very similar behavior, but resulted in higher cluster ages and poorer fits (i.e. higher ).
It is concluded that in general, the fitting of the high-resolution spectrum confirms that the cluster is probably younger than 50 Myr, but the H profile turned out to be mostly sensitive to the non-negligible contamination from SN 2004dj. As a result, the line-profile analysis could not lead to a unique solution for the cluster age and metallicity. Hence, at present, we cannot use the H line-profile analysis to further constrain the cluster age.
We have also examined the hypothesis that S96 may not be a SSP resulting from a single, rapid initial starburst. Although a single starburst is a more plausible mechanism for the formation of a massive, compact stellar cluster, continuous star formation is taking place within the disk of NGC 2403 (Davidge, 2007). We have checked whether the SED of S96 could be fitted by that of a SSP resulting from continuous star-formation rate (SFR); Starburst99 models were compared with Geneva tracks, Kroupa IMF, and different metallicities assuming continuous SFR. The SFR was simply scaled to match the -band observed flux of the cluster SED. Two of the models with metallicity are plotted in Figure 11. Regardless of age, these models are too bright in the UV and too faint in the NIR, which suggests that the observed SED cannot be described by continuous SFR. The same result has also been obtained using other metallicities, or applying the Padova evolutionary tracks. Note that the presence of a hypothetical dense, intracluster dust cloud may significantly alter the shape of the resulting SED, but a detailed study of such a model would require much better observational coverage of S96 at IR wavelengths.

3.2. Isochrone Fitting
The computed photometry of the /ACS frames (§2.1.3) was used to construct color-magnitude diagrams (CMDs) of S96 using either or as color. We have selected and examined all resolved stars within pixels ( pc) around the cluster center (green circle in Fig. 4) as possible cluster members. Note that the visible diameter of the unresolved inner part of the cluster is pixels, corresponding to pc at the distance of NGC 2403.


The CMDs are plotted in Figure 12, where the filled circles denote the possible cluster members, within the pixels radius (referred to as the “cluster region” hereafter), while crosses represents the other field stars. outside the cluster region.
Thirty stars have a measured color within the cluster region. There are 21 such stars with color. However, only 7 stars are common to the two samples, due to the reduced sensitivity of ACS in the blue.
The field-star contamination within this region was estimated by putting outside the cluster region an annulus having the same area as that of the cluster region, and counting the stars within this annulus. Using different inner radii for the annulus, but keeping its area fixed, the number of field stars was found to vary between and . Adopting its mean value, the expected number of field stars within the cluster region is . The relative contamination of projected field stars within the cluster region is %. Assuming that the positions of field stars follow a Poisson distribution with as the expected value, the probability of the occurrence of 8 field stars within the cluster region (i.e., % contamination) is %. This number strongly suggests a 99% probability that at least 22 stars found within the cluster region are indeed physically associated with S96, and not just a random concentration of unrelated field stars.
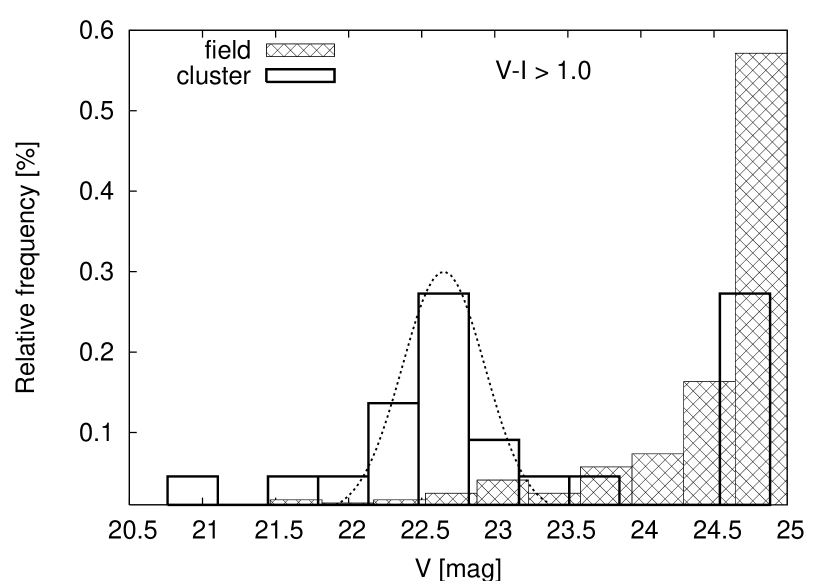
The separation of the cluster members and the field stars can also be illustrated in their magnitude histogram. In Figure 13 the relative frequency (i.e., the number of stars in a magnitude bin divided by their total number) of the field stars (filled bars) and those within the cluster area (open bars) that have mag is plotted as a function of the observed magnitude. The distribution of these red stars clearly indicates that in the cluster area there is a significant excess of stars at mag. Their magnitude distribution can be roughly approximated by a Gaussian, and it is markedly different from that of the field stars, being monotonically increasing toward fainter magnitudes.
Turning back to Figure 12, it also contains the latest Padova isochrones (Cioni et al., 2006a, b) including variable molecular opacities in the thermally pulsing asymptotic giant branch (TP-AGB) phase, assuming solar metallicity. The ages of the plotted isochrones (10, 16, 32, 63, and 100 Myr) are indicated in the legend. The isochrones were reddened with mag (§3.1) assuming the Galactic reddening law (Fitzpatrick & Massa, 2007), and shifted to the Mpc distance of the host galaxy. This reddening value seems to be a good estimate for the other field stars as well. The tracks were selected, because the fitting of the integrated cluster SED produced the best results using this metallicity (see §3.1). Comparing the CMDs with isochrones of and , it was found that these isochrones do not extend enough to the red (to mag) where some of the bright cluster stars reside. However, the age distribution of the observed stars (i.e., the concentration of stars along the computed isochrones) is the same as in the case of , so the age limits of the resolved population of S96 are found to be rather insensitive to the actual metallicity of the cluster.
It is interesting that in the CMDs the field stars follow roughly the same distribution as the cluster members. Note that the blueward distribution of all stars in the vs. diagram below mag, and the redward distribution in the other CMD below mag, are due to the decreasing sensitivity of the detector/filter combination in that color regime (that is, the incomplete detection of objects). The completeness limit (the magnitude limit above which all stars are detected regardless of their color) was estimated as () mag for the vs. diagram, and () mag for the vs. diagram. In order to have better statistics, in the following we analyze the vs. diagram.
From Figure 12 the age of each cluster star was determined as the age of the nearest isochrone. In some cases, when different isochrones ran very close to each other, only upper and lower limits (e.g., Myr) could be determined.
It is apparent that the brightest cluster stars are closest to the Myr isochrone consistently in both diagrams. However, there are only 2 or 3 such stars, so they may also be binaries consisting of older/fainter stars. Most of the bright resolved stars have mag and are distributed between the and Myr isochrones. These are in very good agreement with the ages of the SED fitting with the lowest (§3.1). Because these stars are expected to have the most significant contribution to the integrated cluster SED, this agreement gives further credibility to the age estimates found in §3.1.
On the other hand, 16 cluster stars out of 30 (50% of the resolved cluster population) are close to or below the 32 Myr isochrone. The detection becomes increasingly color dependent below 23 mag, so the actual number of such stars may be higher. There are a few very red stars at 25 mag, where we cut the observed sample, because the errors calculated by DOLPHOT started to exceed 1 mag (note that the real brightness uncertainties of these stars may be higher, but we used the errors given by DOLPHOT as a selection criterion).
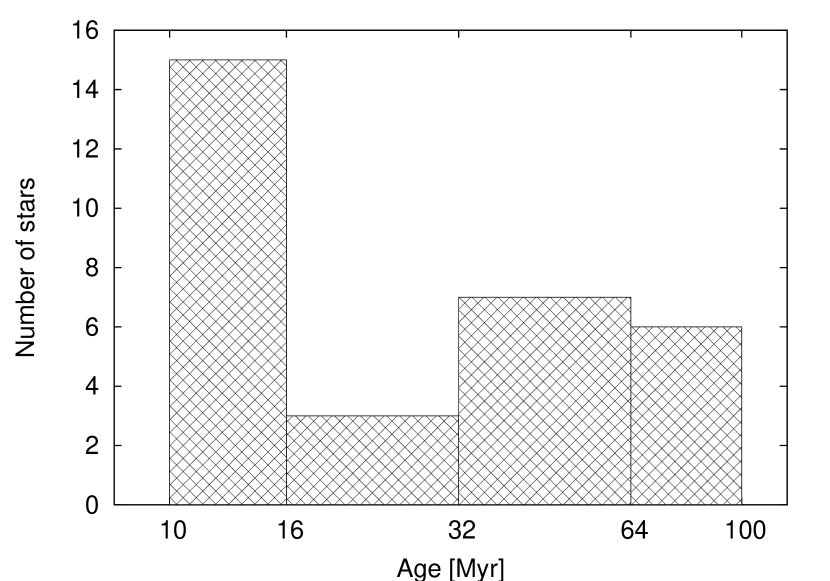
Fig.14 shows the histogram of the ages (the age resolution follows that of the isochrones). About half of the resolved cluster members fall into the 10–16 Myr age interval, while the other 50% have ages distributed between 16 and 100 Myr. These results suggest that the resolved population of S96 cannot be represented by a single age. Instead, a “young” population with an age of 10–16 Myr and an “old” population at 30–100 Myr seem to exist within the cluster area.

It is interesting to compare the spatial distribution of the “young” and “old” stars in the cluster area. This is shown in Figure 15, where the image coordinates of the resolved stars (in pixels) are plotted. Filled circles represent the “young” stars, and open symbols denote the “old” ones. The “young” (bright) stars appear to be concentrated around the cluster center, while the “old” stars are more scattered. This is illustrated further in Figure 16, where the magnitudes and the colors are plotted as a function of the radial distance from the cluster center (in pixels). Again, the “young” stars seem to dominate the inner area within pixels. On the other hand, the light from the unresolved part of the cluster is also strong here, making the detection of fainter stars very difficult in the central area. Thus, the lack of “old” stars in this area is surely affected by selection. The right-hand panel of Figure 16 suggests that the average color of the “young” population is somewhat redder than that of the “old” population.


Summarizing the results obtained in this section, we conclude that the resolved stars in S96 belong to two populations having ages of 10–16 Myr and 30–100 Myr. The “young” stars are brighter and somewhat redder that the “old” ones, and they are located closer to the central part of the cluster. The age limits of the “young” population are in good agreement with the lowest models in the SED fitting (§3.1), when the random population of the IMF was taken into account, but slightly higher than the age of the best-fitting canonical models ( Myr), i.e., those without random IMF population.
3.3. The Absence of H Emission Around S96
NGC 2403 is known to show intense star-forming activity (Davidge, 2007). From deep and imaging, Davidge (2007) found that the SFR during the past 10 Myr has been M⊙ yr-1 in the whole disk of NGC 2403. The SFR was highest in the region at galactocentric distances 2–4 kpc. The intense star formation in the inner disk may explain the existence of young (–10 Myr) compact clusters, such as S96 which is at kpc.
Young clusters are able to ionize the surrounding hydrogen clouds, showing up as large, bright H II regions. The measured H luminosity is known to correlate with the SFR of these complexes (Kennicutt, 1998; Pflamm-Altenburg et al., 2007). The ionizing UV photons come mostly from the young, massive OB stars located inside the clouds. Because the lifetime of such stars is short, the number of ionizing photons decreases rapidly after 7–8 Myr for clusters/associations that were formed after an initial starburst (Dopita et al., 2006). Thus, the presence/absence of H emission around S96 may give an additional, independent constraint on the age of the cluster.
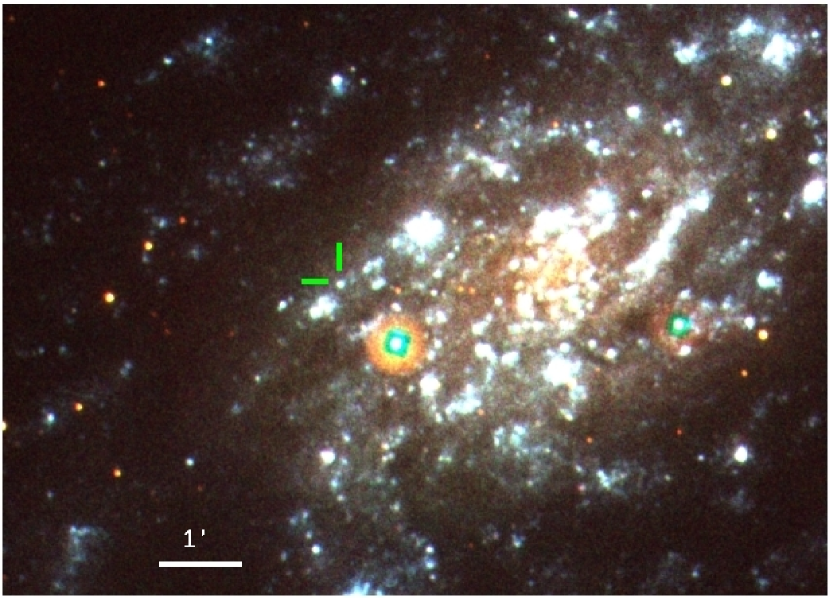
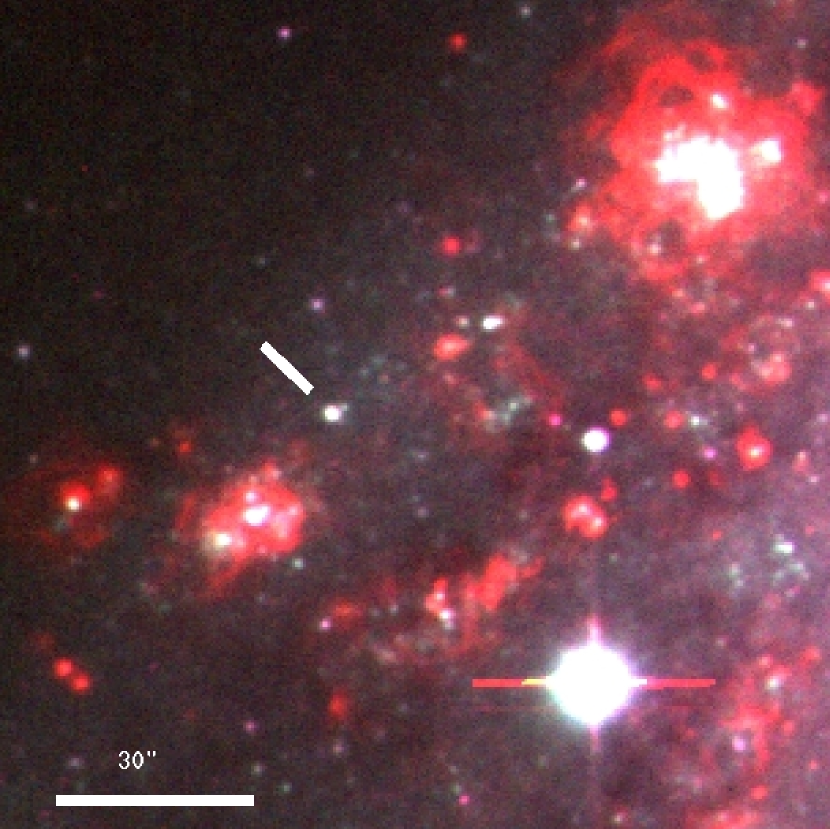
Figure 17 shows the color-combined image of NGC 2403 obtained with the 2.3 m Bok telescope at Steward Observatory (see §2) using , , and H filters for the blue, green, and red colors, respectively. It is apparent that there are a number of extended H II regions showing H emission in the vicinity of S96 (the marked object), as expected in a stellar field with ongoing star formation. Following the method applied recently by Ramya et al. (2007), the SFRs of these complexes were estimated to be 0.01–0.001 M⊙ yr-1, typical of such H-emitting regions. However, S96 appears stellar, without any indication for extended H emission. This suggests that the flux at H is coming entirely from inside the unresolved cluster. Indeed, it is very likely that the source of this emission is mostly from SN 2004dj (§2.1.2).
The lack of any extended H emission around S96 can be used to estimate a lower limit for the cluster age, as outlined above. The number of ionizing UV photons as a function of age was estimated by the Starburst99 code (see §3.1) applying Geneva tracks, Salpeter IMF (but neglecting random IMF sampling), and . The cluster mass was fixed at M⊙, between the cluster masses derived during the SED fitting (see Table 5). The calculated numbers of ionizing photons have been converted to the radius of the H II region applying the formula
| (3) |
where is the number of photons capable of ionizing hydrogen, is the number density of electrons (complete ionization was assumed: ), and is the effective recombination coefficient for H (Osterbrock, 1989). The value of was estimated using
| (4) |
assuming K (Moore et al., 2002).


In Figure 18 the radius of the ionization zone is plotted as a function of the cluster age. The continuous line shows the results for cm-3 (a typical electron density in bright H II regions), while the dashed and dotted lines illustrate the results if was an order of magnitude higher or lower. Note that changing the cluster metallicity down to caused only negligible alterations in these curves. It is apparent that at Myr the ionized cloud has pc radius, which is similar to the radius of S96 as seen by (§2.1.3). Above 10 Myr the radius quickly decreases. At Myr it is only pc, which is much less than the size of the cluster. This suggests that the Myr cluster age found in the previous sections is consistent with the lack of resolved H II region around S96.
For an age of Myr, which was proposed by the fitting of SEDs without random IMF fluctuations, pc, which is slightly larger than the visible cluster size. Thus, the Myr age may be less probable than the Myr ages found above. However, if cm-3 is allowed, can be easily reduced to pc at Myr.
It is concluded that using the absence of an H-emitting region around S96 results in a lower limit of the cluster age of 8–10 Myr. This is consistent with the age estimates of S96 found in the previous sections.
4. Discussion
In §3.1, §3.2, and §3.3, constraints on the age of S96 were derived with different techniques. The fitting of theoretical SEDs (§3.1) gave possible ages distributed between 8 Myr and 40 Myr depending on the cluster metallicity and the models applied. The most probable solutions turned out to be between 10 and 25 Myr.
The fitting of isochrones to the CMDs of the resolved stellar population in the vicinity of S96 (§3.2) resulted in two distinct populations with ages of 10–16 Myr and 30–100 Myr. The younger stars seem to be somewhat redder, and they are located closer to the cluster center than the members of the older population.
The absence of an H II region emitting in H around S96 is consistent with the lower age limit of Myr. As the simulations with Starburst99 indicate (§3.3), the predicted radii of such a cloud after Myr would decrease below pc, roughly the projected radius of S96.
How can we explain the existence of populations with two different ages within such a compact cluster? The most likely hypothesis is the capture of field stars by the massive stellar cluster during its formation, as discussed recently by Pflamm-Altenburg & Kroupa (2007a) for explaining the existence of stars with –18 Myr within the Orion Nebula cluster, where most stars have Myr. The age discrepancy is similar to the case of S96, but otherwise the situation is different, because S96 is much more massive than the Orion Nebula cluster, and the older population resides in the outer region of S96.
Following the argument of Pflamm-Altenburg & Kroupa (2007a), the collapsing pre-cluster cloud may capture nearby field stars during its collapse time, which is roughly equal to its free-fall timescale, , where is the initial radius of the cloud at the start of the collapse and is the total mass of the cloud. Adopting –20 pc and (25–100) M⊙, the estimated collapse time of S96 is –8 Myr. Note that this is an upper limit for the collapse time, since the mass of the cloud can be significantly higher than the final stellar mass of the cluster (which was used to estimate ). Assuming the number density of stars as pc-3, Pflamm-Altenburg & Kroupa (2007a) calculated the number of captured field stars within 2.5 pc of the Orion Nebula cluster center as if Myr. These results suggest that for S96, which is an order of magnitude more massive than the Orion Nebula cluster, the number of captured field stars should be substantial, even if the number density of the surrounding stars is lower than that around the Orion Nebula cluster. Moreover, we have studied the stellar content within pc from the center of S96, instead of 2.5 pc, which may also increase the number of captured stars.
If we interpret the higher age of the stars in the outer part of S96 as a result of field-star capture, the photometric data suggest that most of the stars resolved by ACS are captured, and the young (–16 Myr), brightest, most massive stars that mostly determine the shape of the integrated SED reside within the inner ( pc), unresolved cluster core. This configuration is roughly consistent with that of other young clusters, as the brightest, most massive members are generally found closest to the center.
There might be other mechanisms responsible for the age dispersion within clusters. A possible hypothesis could be continuous star formation within a Myr cloud. This scenario can certainly be ruled out, because the SED of such a stellar population is not compatible with the observations (see Fig. 11). However, as also suggested by the referee, there might be a rapid initial starburst that occurred within a region having continuous star formation. In this case the resulting SED would be a flux-weighted combination of the SEDs from a continuous SFR (Fig. 11) and from a starburst (Fig. 8). While this scenario would certainly be worth study in detail, the construction of such customized models is beyond the scope of this paper.
Pflamm-Altenburg & Kroupa (2008) discuss yet another possibility: gas accretion (and subsequent star formation) from the nearby interstellar medium (ISM) by a massive cluster. However, according to their simulations, this process is expected to work only for M⊙ cluster masses and have a characteristic timescale of a few Gyr. Thus, it is probably insignificant for S96, for which both the cluster mass and the considered timescale are an order of magnitude less.
The age of S96 is a key parameter in constraining the mass of the progenitor of SN 2004dj. The classical theoretical lower limit for the collapse of a stellar core is , but this can be 1 – 2 smaller depending on the treatment of core convective overshooting (Woosley et al., 2002). Recent direct identifications of Type II-P supernova progenitors typically have masses of –15 M⊙ (Maund et al., 2005; Li et al., 2006), and none of them clearly exceed M⊙.
The fact that SN 2004dj occurred close to the projected center of S96 (§2.1.3 and Fig. 4) strongly suggests that its progenitor was indeed a cluster member. Although S96 may contain a significant number of older stars captured from the field, it is more probable that a star is formed during or after the collapse of the pre-cluster cloud. Assuming this scenario, the limit implies Myr as an upper limit for the cluster, according to Padova isochrones. This is in good agreement with the ages of most of the resolved cluster stars inferred from isochrones, because even the members of the older population have ages comparable to or less than 60 Myr.
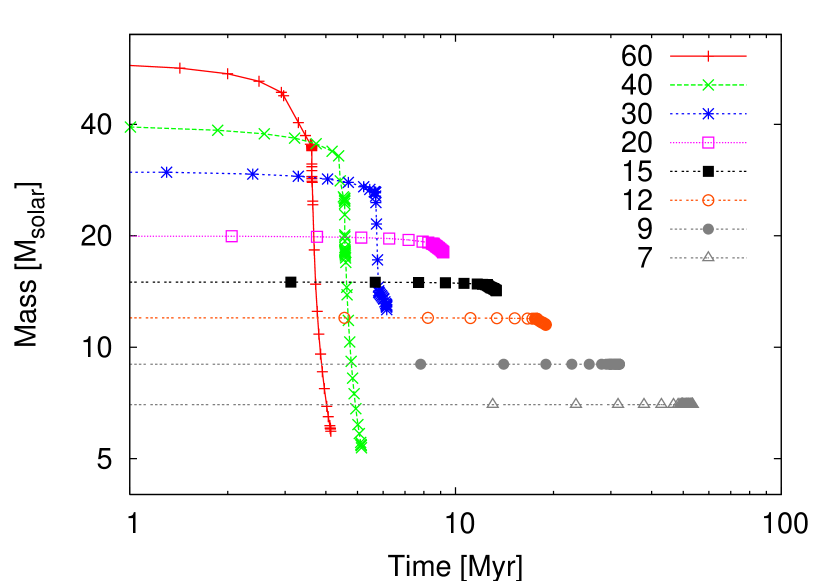
In Figure 19 the masses of stars are plotted as a function of age from the same Padova evolutionary tracks as above. The final ages of the curves correspond to the last theoretical model for a given initial mass. Note that the Padova evolutionary tracks do not extend up to the actual moment of core collapse, so the final ages for all masses are only lower limits, but an age excess as large as % is hardly expected. If we accept the Myr age for S96 as a lower limit inferred from both SED fitting and isochrones, this would imply M⊙ for the initial mass of the progenitor.
From fitting the pre-explosion SED, Maíz-Apellániz et al. (2004) and Wang et al. (2005) estimated –15 M⊙, which agrees very well with the most probable age of 10–20 Myr found in §3.1 and 3.2. On the other hand, Vinkó et al. (2006) obtained a significantly lower age and higher progenitor mass () from nearly the same observed data as Maíz-Apellániz et al. (2004), but using different model SEDs. This would require Myr, which is lower than most of the age estimates discussed above, but may not be ruled out entirely, because certain SED models indeed predict such young age. However, these earlier results were more affected by the age-reddening degeneracy (see §3.1), because of the restricted wavelength range of the observed SED.
There is yet another way to test the possible mass of the progenitor star via the effect of the SN explosion on the integrated cluster SED, as first suggested by Maíz-Apellániz et al. (2004). The explosion of SN 2004dj must have changed slightly the supergiant population of S96, because one bright (perhaps the brightest) star was missing after the SN faded away. This should be apparent in the cluster SED as well, altering both the overall flux level as well as the spectral shape of the post-explosion SED. The difference between the pre- and post-explosion SED is approximately the flux spectrum of the progenitor star just before explosion. If the progenitor is a red supergiant (RSG), then mostly the NIR region of the cluster SED will be depressed, while if it is a yellow supergiant (YSG), the change will be more pronounced in the optical.
Figure 20 shows a comparison of the observed pre- and post-explosion cluster SEDs with the predictions of this hypothesis. The lines represent the theoretical post-explosion cluster SED if a RSG or a YGS with a given mass is removed from the pre-explosion SED. , 20, and 15 M⊙ were selected, and their fluxes at different bands were determined from the Padova evolutionary tracks assuming .
It is apparent that the removal of a star would cause a strong flux decrease above 5000 Å that clearly exceeds the uncertainty of the observed flux levels. Such a massive progenitor is therefore unlikely. The lack of a 20 M⊙ RSG would also result in a similar flux depression in the NIR. Unfortunately, no post-explosion NIR photometry is at our disposal, so we could not verify this prediction. All of the other proposed progenitors do not cause the flux to drop significantly below the observed SED.
However, as our Keck spectrum suggests (§2.1.2), the nebular emission from the SN 2004dj ejecta may also have a non-negligible contribution to the observed fluxes in the and bands via emission lines from H, [O I] 6300,6364, [Fe II] 7155 and possibly [Ca II] 7291,7324 (Sahu et al., 2006). Also, the lack of post-explosion observations in the NIR SED makes the comparison between observations and model predictions uncertain at present. More observations, especially in the bands, would be very useful to clarify this issue. From Figure 20, it seems that the progenitor mass was probably M⊙, but a 15 M⊙ or even a 20 M⊙ star is a possible candidate.
Putting together all available information, we conclude that the new multi-wavelength observations favor a progenitor star with M⊙, if the progenitor was a member of the younger population within S96. This is consistent with, and perhaps somewhat higher than, typical measured SN II-P progenitor masses. However, because of the presence of stars belonging to an older ( Myr) population within S96, it cannot be ruled out that the progenitor was one of them, which would imply –8 M⊙, close to the lower limit for such SNe.
5. Conclusions
We have presented late-time photometry of SN 2004dj and the surrounding cluster S96, extending the time coverage of the observational sample up to d after explosion. In the optical, the continuum flux from SN 2004dj faded below the level of the integrated flux of S96 in 2006 Sep., d after explosion. The pre- and post-explosion SEDs of S96 show no significant differences in the range 2000–9000 Å. The nebular spectrum of SN 2004dj at d after explosion was dominated by the blue continuum from S96 shortward of 6000 Å, and by strong H, [O I] 6300, 6363, and [Fe II] emission line, characteristic of a typical nebular spectrum of a SN II-P.
We have examined the multi-wavelength observations of S96 by different methods, in order to derive constraints on the cluster age and evolutionary status. The fitting of the cluster SED (using the average of pre- and post-explosion fluxes) results in cluster ages distributed between and Myr, with the best-fitting solutions being within 10–20 Myr. The observed reddening is mag; its uncertainty is greatly reduced compared with previous studies, due to the inclusion of the UV fluxes from Swift and XMM-Newton.
S96 appears to be partly resolved in images obtained with /ACS on 2005 August 28 ( d after explosion), although the light from SN 2004dj was still very strong at that time. We have computed photometry of the ACS images obtained through the , , and filters, and combined the magnitudes of the detected stellar sources in color-magnitude diagrams. Theoretical isochrones fitted to the observed CMDs reveal that the resolved stars in the outskirts of the cluster have a bimodal age distribution. The younger population consists of stars with ages of Myr, while the members of the older one have Myr. The ages of the older population has a distribution that is similar to that of the field stars, not associated with S96. This similarity may suggest that about half of the cluster stars resolved by ACS were captured from the field population during the formation of S96.
The absence of a visible H-emitting cloud around S96 implies a lower limit for the cluster age of 8–10 Myr, in agreement with the other age estimates.
The 10 Myr age of S96 would imply a SN 2004dj progenitor mass of M⊙, while the mass limit for core collapse (7–8 M⊙) would mean Myr for the age of the progenitor. This latter limit is consistent with the age of the older population within S96, leaving the possibility of a low-mass progenitor open. The age of the younger population (10–16 Myr) corresponds to 12–15 M⊙, which seems to be the most probable mass estimate at present. We verified that even a 20 M⊙ progenitor would be consistent with the unobservable flux difference between the pre- and post-explosion SEDs. However, more observations, especially in the bands, would be essential to narrow the mass range of the progenitor.
References
- Brown et al. (2007) Brown, P. J., et al. 2007, ApJ, 659, 1488
- Bruzual & Charlot (2003) Bruzual, G., & Charlot, S. 2003, MNRAS, 344, 1000
- Buzzoni et al. (2007) Buzzoni, A., Bertone, E., Chavez, M., & Rodriguez-Merino, L. H. 2007, ArXiv e-prints, 709, arXiv:0709.2711
- Cerviño et al. (2002) Cerviño, M., Valls-Gabaud, D., Luridiana, V., & Mas-Hesse, J. M. 2002, A&A, 381, 51
- Cerviño & Luridiana (2004) Cerviño, M., & Luridiana, V. 2004, A&A, 413, 145
- Cerviño & Luridiana (2006) Cerviño, M., & Luridiana, V. 2006, A&A, 451, 475
- Cioni et al. (2006a) Cioni, M.-R. L., Girardi, L., Marigo, P., & Habing, H. J. 2006a, A&A, 448, 77
- Cioni et al. (2006b) Cioni, M.-R. L., Girardi, L., Marigo, P., & Habing, H. J. 2006b, A&A, 452, 195
- Crockett et al. (2007a) Crockett, R. M., et al. 2007a, MNRAS, 381, 835
- Crockett et al. (2008) Crockett, R. M., et al. 2008, ApJ, 672, 99
- Davidge (2007) Davidge, T. J. 2007, ApJ, 664, 820
- Dolphin (2000) Dolphin, A. E. 2000, PASP, 112, 1383
- Dopita et al. (2006) Dopita, M. A., et al. 2006, ApJ, 647, 244
- Faber et al. (2003) Faber, S. M., et al. 2003, Proc. SPIE, 4841, 1657
- Fierro et al. (1986) Fierro, J., Torres-Peimbert, S., & Peimbert, M. 1986, PASP, 98, 1032
- Filippenko (1982) Filippenko, A. V. 1982, PASP, 94, 715
- Filippenko (1997) Filippenko, A. V. 1997, ARAA, 35, 309
- Fitzpatrick & Massa (2007) Fitzpatrick, E. L., & Massa, D. 2007, ApJ, 663, 320
- Gehrels et al. (2004) Gehrels, N., et al. 2004, ApJ, 611, 1005
- González Delgado et al. (2005) González Delgado, R. M., Cerviño, M., Martins, L. P., Leitherer, C., & Hauschildt, P. H. 2005, MNRAS, 357, 945
- Hendry et al. (2006) Hendry, M. A., et al. 2006, MNRAS, 369, 1303
- Immler et al. (2007) Immler, S., et al. 2007, ApJ, 664, 435
- Jamet et al. (2004) Jamet, L., Pérez, E., Cerviño, M., Stasińska, G., González Delgado, R. M., & Vílchez, J. M. 2004, A&A, 426, 399
- Jimenez et al. (2004) Jimenez, R., MacDonald, J., Dunlop, J. S., Padoan, P., & Peacock, J. A. 2004, MNRAS, 349, 240
- Kaviraj et al. (2007) Kaviraj, S., Rey, S.-C., Rich, R. M., Yoon, S.-J., & Yi, S. K. 2007, MNRAS, 381, L74
- Kennicutt (1998) Kennicutt, R. C., Jr. 1998, ARA&A, 36, 189
- Koleva et al. (2008) Koleva, M., Prugniel, P., Ocvirk, P., Le Borgne, D., & Soubiran, C. 2008, MNRAS385, 1998
- Larsen (1999) Larsen, S. S. 1999, A&AS, 139, 393
- Leonard et al. (2008) Leonard, D. C., Gal-Yam, A., Fox, D. B., Cameron, P. B., Johansson, E. M., Kraus, A. L., Le Mignant, D., & van Dam, M. A. 2008, submitted (arXiv:0809.1881)
- Li et al. (2006) Li, W., Van Dyk, S. D., Filippenko, A. V., Cuillandre, J.-C., Jha, S., Bloom, J. S., Riess, A. G., & Livio, M. 2006, ApJ, 641, 1060
- Li et al. (2007) Li, W., Wang, X., Van Dyk, S. D., Cuillandre, J.-C., Foley, R. J., & Filippenko, A. V. 2007, ApJ, 661, 1013
- Maíz-Apellániz et al. (2004) Maíz-Apellániz, J., Bond, H. E., Siegel, M. H., Lipkin, Y., Maoz, D., Ofek, E. O., & Poznanski, D. 2004, ApJ, 615, L113
- Mason et al. (2001) Mason, K. O., et al. 2001, A&A, 365, L36
- Mattila et al. (2008) Mattila, S., Smartt, S. J., Eldridge, J. J., Maund, J. R., Crockett, R. M., & Danziger, I. J. 2008, ApJ688, L91
- Maund & Smartt (2005) Maund, J. R., & Smartt, S. J. 2005, MNRAS, 360, 288
- Maund et al. (2005) Maund, J. R., Smartt, S. J., & Danziger, I. J. 2005, MNRAS, 364, L33
- Moore et al. (2002) Moore, B. D., Hester, J. J., Scowen, P. A., & Walter, D. K. 2002, AJ, 124, 3305
- O’Connell (1999) O’Connell, R. W. 1999, ARA&A, 37, 603
- Osterbrock (1989) Osterbrock, D. E. 1989, Astrophysics of Gaseous Nebulae and Active Galactic Nuclei (Mill Valey, CA: Mill University Science Books), 21
- Pflamm-Altenburg & Kroupa (2007a) Pflamm-Altenburg, J., & Kroupa, P. 2007, MNRAS, 375, 855
- Pflamm-Altenburg & Kroupa (2008) Pflamm-Altenburg, J., & Kroupa, P. 2008, in IAU Symposium, 246, Dynamical Evolution of Dense Stellar Systems, ed. E. Vesperini, M. Giersz & A. Sills (Cambridge: Cambridge University Press), 71
- Pflamm-Altenburg et al. (2007) Pflamm-Altenburg, J., Weidner, C., & Kroupa, P. 2007, ApJ, 671, 1550
- Pilyugin et al. (2004) Pilyugin, L. S., Vílchez, J. M., & Contini, T. 2004, A&A, 425, 849
- Poole et al. (2008) Poole, T. S., et al. 2008, MNRAS, 383, 627
- Pun et al. (1995) Pun, C. S. J., et al. 1995, ApJS, 99, 223
- Ramya et al. (2007) Ramya, S., Sahu, D. K., & Prabhu, T. P. 2007, MNRAS, 832
- Renzini & Buzzoni (1986) Renzini, A., & Buzzoni, A. 1986, Spectral Evolution of Galaxies, 122, 195
- Roming et al. (2005) Roming, P. W. A., et al. 2005, Space Science Reviews, 120, 95
- Sahu et al. (2006) Sahu, D. K., Anupama, G. C., Srividya, S., & Muneer, S. 2006, MNRAS, 372, 1315
- Schlegel et al. (1998) Schlegel, D. J., Finkbeiner, D. P., & Davis, M. 1998, ApJ, 500, 525
- Sirianni et al. (2005) Sirianni, M., et al. 2005, PASP, 117, 1049
- Skrutskie et al. (1997) Skrutskie, M. F., et al. 1997, in The Impact of Large Scale Near-IR Sky Surveys, eds. F. Garzon et al. (Dordrecht: Kluwer Academic Publishing Company), 25
- Smartt et al. (2008) Smartt, S. J., Eldridge, J. J., Crockett, R. M., & Maund, J. R. 2008, MNRAS, submitted (arXiv:0809.0403)
- Van Dyk et al. (2003) Van Dyk, S. D., Li, W., & Filippenko, A. V. 2003, PASP, 115, 1
- Vázquez & Leitherer (2005) Vázquez, G. A., & Leitherer, C. 2005, ApJ, 621, 695
- Vinkó et al. (2006) Vinkó, J., et al. 2006, MNRAS, 369, 1780 (Paper I)
- Wang et al. (2005) Wang, X., Yang, Y., Zhang, T., Ma, J., Zhou, X., Li, W., Lou, Y.-Q., & Li, Z. 2005, ApJ, 626, L89
- Woosley et al. (2002) Woosley, S. E., Heger, A., & Weaver, T. A. 2002, Reviews of Modern Physics, 74, 1015