Shear Induced Structural Ordering of a Model Metallic Glass
Abstract
We report results of non-equilibrium molecular dynamics simulations of a one-component glassy system under the influence of a shear flow, with the aim of investigating shear induced ordering of this system. In spite of the very low temperature, the system transforms into a strained crystalline state through well defined nucleation events. Various characteristics of the observed ordering at different strain rates and temperatures are discussed. We also define and discuss the transition rates.
pacs:
46.35.+z, 05.70.Ln, 64.60.qe, 64.70.peNucleation, clustering and ordering processes in supercooled melts are a subject of considerable interest, both in soft matter and in hard materials such as metallic alloys or molecular glass formers. Crystal ordering is generally thought to proceed through nucleation events, which are described within the framework of classical nucleation theory (CNT) Farkas ; Becker ; Zeldovich ; Turnbull . In this theory, the nucleation is associated with the local crossing of a free energy barrier under the influence of thermal noise. The situation becomes more intriguing if, instead of a supercooled liquid, we consider a glassy system at very deep supercooling Schmelzer . The kinetic slowing down and high viscosity of a glass make the structural rearrangements, including those required for crystal nucleation, so slow that the corresponding transition is practically unobservable on the experimental time scales. Obviously, the devitrification can be accelerated through reheating of the glass. An interesting alternative, which is in fact commonly used in soft matter systems, is to utilize shear as an ordering tool rather than temperature. Crystal-crystal or amorphous crystal transformations are also known to take place in processes such as grinding and milling of molecular materials, which in general involve a complex combination of mechanical stresses and temperature variations willart .
Recent numerical studies provide the evidence of crystallization induced by external shear in an amorphous, single-component Lennard-Jones system Duff ; Mokshin/Barrat However, such single-component Lennard-Jones systems have a very weak glass forming ability and the transition to a crystalline state at low temperature proceeds through a spinodal, rather than nucleation, route Trudu ; Bartell_2007 .
In this study, we consider the case of a system with a much better glass forming ability than the Lennard-Jones system, but still keeping the simplicity associated with one-component systems. This system is made of particles interacting through the short ranged, oscillating Dzugutov potential Dzugutov_PRA ; Dz_link
| (1) | |||||
where and are the length and energy scales, respectively, the parameters , , , , , , are taken as described in Ref. Dzugutov_PRA and represents the Heaviside step function. So, the potential is characterized by a minimum located at and a maximum at . The presence of these oscillations can be considered as a simplified attempt to reproduce the screened Coulomb repulsion of ions in metals. The potential is tuned in such a way that it prevents the formation of the most common crystal phases at low pressure. At high pressures () and low enough temperaturesfootnote1 , the or crystalline structures can be formed, although the ground state of the system at zero temperature is a structure. A slow quench from a high-temperature state this model favors the formation of quasi-crystals including Frank-Kasper structures, whereas a faster cooling leads to a metastable amorphous state with a mode-coupling temperature estimated to be (see Ref. Dzugutov_PRL ). A remarkable property is that this is one-component good glass former shares many common features with much more complex metallic glasses. With only one component, however, the study of topological reorganization, which excludes such effects as chemical ordering or demixing, is facilitated Simdyankin .
The system consists of particles contained in a cubic simulation box of the volume with . The structural changes in such a rather large system is expected to be relatively insensitive to the boundary conditions imposed by the simulation cell Wedekinda1 . A set of well equilibrated independent samples is created at a temperature . These samples are cooled at a rate and the configurations corresponding to the temperatures , and are storedfootnote2 . To impose the shear we create two solid walls at the ends of the simulation box in the direction by freezing all the particles in the - plane over the range of three interparticle distances. The top wall moves in the direction with the instantaneous velocity at a constant strain rate and normal load ; is the distance between the walls. This value of the normal pressure is thermodynamically favorable to FCC crystalline forms and allows one to avoid the phase of quasi-crystals for the Dzugutov system Roth_PRE_2000 . Constant temperature conditions are ensured by rescaling the velocity component in the neutral direction perpendicular to the flow and the velocity gradient direction. The termostatting was implemented only if the temperature has changed more than of the considered value. Other details of the simulation protocol are identical to those described in Ref. Mokshin/Barrat .
The local order in the system can be characterized by parameters that probe the appearance of orientational order around each atom. In this work, we use both the local orientational Wolde bond-order parameter and its global Steinhardt counterpart :
| (2a) | |||
| (2b) |
Here are the spherical harmonics, denotes the number of the nearest “neighbors” of particle , and and are the polar and azimuthal angles formed by radius-vector and some reference system. The parameter is invariant under rotations. Nonzero values of for the different crystalline cluster structures including those with icosahedral symmetry appear for (see Ref. Steinhardt ). In this work we define “neighbors” as all atoms located within a sphere of radius around an atom . For a fully disordered system one has , whereas the ordered geometries are characterized by the next values of : , , , and (see Refs. Rintoul ; Wolde ).
By performing a cluster analysis for the detection of the “solidlike”particles (for details see Refs. Mokshin/Barrat ; Wolde ), we obtain the cluster size distribution and its moments as a function of time. The zeroth moment defines the total number of clusters, the first moment represents the total number of particles involved in an ordered phase (solidlike particles), the ratio of the second and first moments, , is associated with the average cluster size. In a finite sample we also obtain as the size of the largest cluster. The average spatial cluster size can be also estimated through the distance between maximally-separated particles within the same cluster.
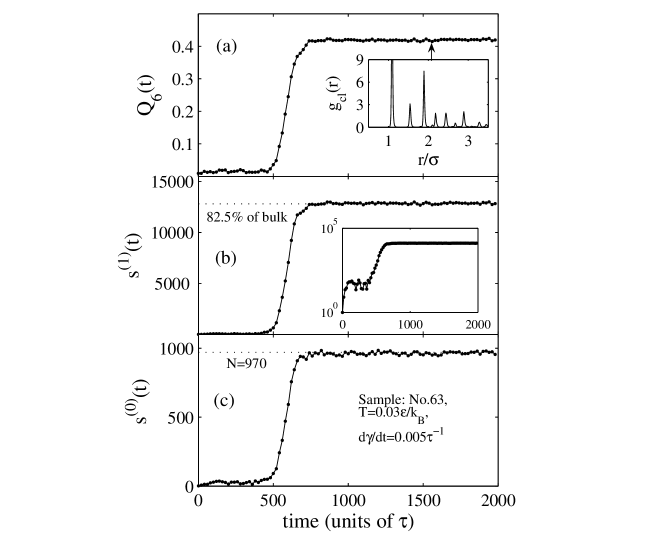
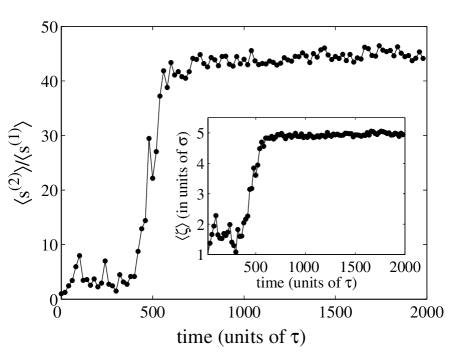
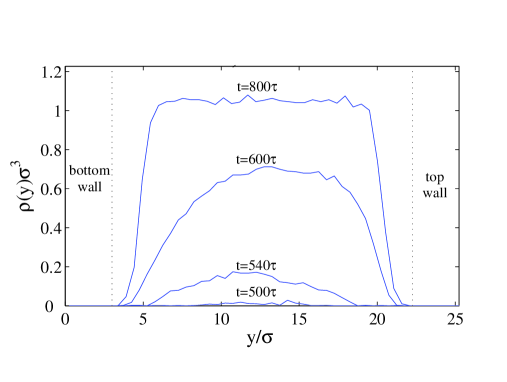
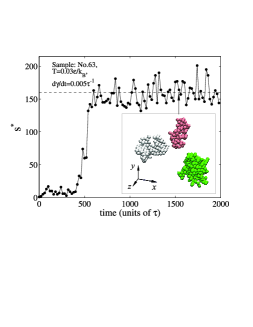
We begin the discussion of our results with Fig. 1, which represents the time evolution of the orientational order parameter , of the number of solidlike particles and of the number of clusters . These curves are computed from a single run in a sample sheared with the rate at the temperature . All these quantities are correlated and illustrate clearly the transition the initially amorphous system into an ordered state, which takes place rapidly after a system-dependent incubation time. Further, the transition is also seen from the growth in the average cluster size presented in Fig. 2. The clear transition from an amorphous phase to a strong crystalline order after an incubation time, during which the system stays amorphous, distinguishes this case from Lennard-Jonesium Mokshin/Barrat . Such a behaviour, in which the incubation time is a statistical, sample-dependent quantity, is typical for a nucleation process. After the transition, the system is transformed essentially into a FCC structure, as is clearly evident from the snapshots and from the radial distribution of particles constitutive of the ordered structures, (inset of Fig. 1(a)). Both the cluster size distribution and the structure of the clusters are essentially independent of shear rate after the transition is completed, indicating that the local structure is not shear rate dependent. It should be noticed that ordering takes place primarily away from the walls, as is seen from the density profiles of solidlike particles presented in Fig. 3. Similar profiles were observed for all considered samples under shear and for all considered strain rates and temperatures. Such a behavior points to the homogeneous scenario of the nucleation. The evolution of the largest nucleus as a function of time is shown in Figs. 4 and 5.
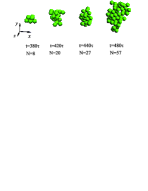
After the transition into an ordered phase, which is accompanied by the growth of amount of solidlike particles [see Fig. 1(b)], the total number of clusters [see Fig. 1(c)] as well as the size of the largest cluster presented in Fig. 5 become essentially stationary. The system achieves a high level of structural ordering, which is, however, far from perfect. When of the bulk becomes included into an ordered phase, no further ordering is observed. Remaining particles formative the disordered ranges are located mainly near the walls. Although the statistical properties remain essentially constant, the size of the largest cluster displays considerable fluctuations (Fig. 5). The system is made of nanocrystalline grains containing at most a few hundred particles (see inset of Fig. 5), which are prevented by the shear flow from growing further but still exchange particles under the influence of the mechanical noise generated by the shear flow.
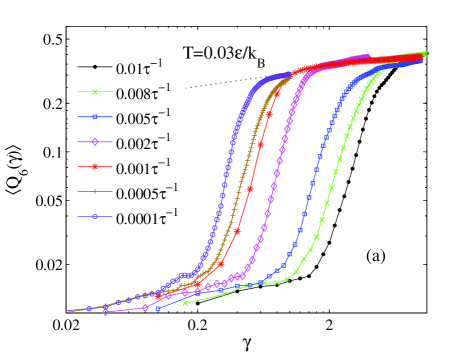
Until now we have discussed the strain history of a single, typical sample. We now turn to the consideration of the statistical properties of this strain history by collecting statistics on and more independent runs. The evolution of orientational bond-order parameter (with ) at the temperature and at various values of the strain rate is presented in Fig. 6(a). These curves display a marked transition at a well defined value of the strain, which increases with shear rate. Obviously, the transition can be characterized by a transition rate , which we evaluate using the mean first-passage time (MFPT) method. This method Hanggi ; Wedekinda1 ; Wedekinda2 focuses on the average time needed for the system to reach for the first time some state with a defined value of the reaction coordinate , where is the domain of states MFPT_th . As a rule, this allows one to evaluate the distribution of time over the reaction coordinate . For an activated process, the transition rate is simply determined by the inverse of the MFPT, at which a plateau is reached, i.e. , whereas the total can be fitted by
| (3) |
where is the ordinary error function, is the local curvature around the top of the barrier and corresponds to the critical value of reaction coordinate (for details, see Ref. Wedekinda1 ).
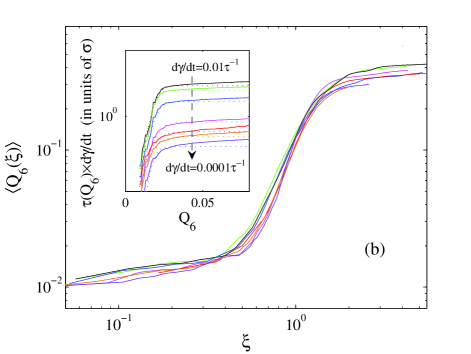
The transition rates calculated within the framework of the MFPT approach with the order parameter as the reaction coordinate, , were used to rescale the strain dependencies presented in Fig. 6(a). So, Fig. 6(b) shows the order parameter [same with Fig. 6(a)] with the rescaled argument , where is the transition strain. As can be seen, all curves collapse onto a single master curve, which is indicative of a common mechanism for the transition scenario. The transition takes place in three stages, which, in turn, reflect the influence of the external drive on the inherent dynamics of the system. The first initial stage, where the system remains mainly in an amorphous phase, is characterized by shear-induced “unjamming” of the system and by the fluidization of the glass Barrat_Kurchan . Due to the shear the diffusivity grows at this stage and the potential energy increases. The characteristic time scale associated with inherent dynamics is defined here by the relaxation time at a finite shear rate, (see Ref. Barrat_Kurchan ). The second stage corresponds directly to the transition of the amorphous system into an ordered state and is caused by cluster nucleation Mokshin/Barrat . Its appearance can be characterized by the transition time scale (or the transition strain ). During this stage the order parameter grows rapidly, following a power law . In the third stage, shear initiates rearrangements in the ordered structures and prevents the system from undergoing a complete crystallization, the order parameter increases only very slowly and probably saturates for large strains Allen/Frenkel ; Cerda .
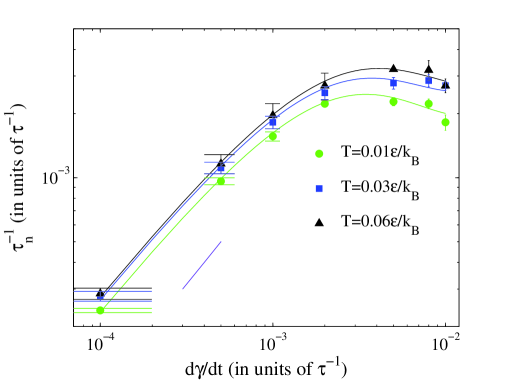
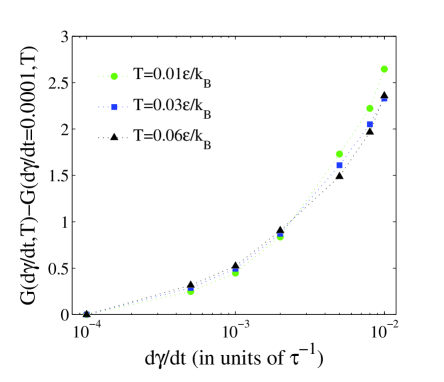
The extracted values of the transition rates at different strain rates and three temperatures are presented in Fig. 7. At small values of , the transition rates increase with strain rate in a manner close to a power law. Note that the rates are practically independent of temperature at these low values of . However, with the subsequent increase of the growth of transition rates becomes slower and temperature dependent. Eventually, starting with transition rates decrease with the strain rate .
To describe the transition of a system into an ordered phase, the ordinary practice is to use the Arrhenius-like equation
| (4) |
where is the attempt frequency (or kinetic prefactor) to overcome a barrier and is the inverse thermal energy; . Two time scales arise naturally in this equation, and . Identifying a rate with the nucleation rate Wolde and the barrier with the free energy cost to form a cluster of the critical size, Eq. (4) is the main equation of CNT. The use of Eq. (4) for systems near thermal equilibrium is straightforward: from the measured transition rates at different temperatures one can easily define the thermodynamic barrier as well as the kinetic term . However, the use of this equation for non-equilibrium cases that violate detailed balance is not generally justified, although there are some indications that a similar approach using an “effective temperature” could be relevant Ilg/Barrat ; Haxton_Liu .
Nucleation events in systems under shear have been identified in Ref. Blaak2 with the conclusion that the thermodynamic barrier is an increasing function of shear rate. We propose an interpretation of our results along the same lines by making a number of reasonable assumptions, namely:
(i) A formula similar to (4) can be used providing an unknown effective temperature , which is introduced to replace the usual bath temperature .
(ii) The kinetic prefactor is set by the time scale for relaxation in a system under shear, which is inversely proportional to the shear rate in this low temperature regime Varnik_private . Hence .
While the assumption (i) results in the generalization of the energy barrier height in Eq. (4) to the -dependent term Duff ; Blaak2 , , assumption (ii) is motivated by the fact that the kinetic processes that can be observed in a glass are dominated by the influence of the shear. As a result, Eq. (4) can be rewritten as
| (5) |
This is justified by the fact that the crystal nucleation in a glassy system free from any drive, e.g. , becomes at very deep supercooling extremely rare event, i.e. , practically unobservable within the time-scale of the experiment as structural rearrangements are inhibited by the very high viscosity Schmelzer .
These assumptions are not sufficient to determine independently the effective temperature and the barrier , both of which, as can be expected, depend on shear rate and on the actual, thermodynamic temperature. However, the variation of a thermodynamic factor with shear can be defined. A first clear observation from Fig. 7 is that must be typically of order unity. If we make the reasonable assumption that the barrier is of the same order of magnitude as in usual supercooled liquids (typically of order , where is the energy scale of the interaction), it appears that the usual activation at the temperatures under study () is unable to account for our observations. Moreover, any effective temperature , which would be used to explain the observed values of , should depend on shear rate only weakly.
| () | () | () | () | |
|---|---|---|---|---|
| 0.01 | 2.44 | 430 | ||
| 0.03 | 2.78 | 417 | ||
| 0.06 | 2.86 | 390 |
The shear rate dependence of is presented in Fig. 8. As the effective temperature can only increase with shear rate, the data clearly shows that the energy barrier must increase with shear rate. This is consistent with the findings of Ref. Blaak2 . However, we found that the parabolic fit (in the variable ) of , which was used in Ref. Blaak2 to treat the data, is not sufficient to describe our results. Instead we use a cubic dependence of shear rate:
| (6) |
where characterizes the limit of the energy barrier hight at zero shear rate and are the correction factors. Equation (6) is an expansion in powers of the dimensionless strain rate as a small parameter, , for about the equilibrium value . Then, Eq. (5) can be extended to the following form:
| (7) |
where characterizes the zero shear rate limit of the thermodynamic factor. The fits of Eq. (7) are shown as continuous lines in Fig. 7 and the obtained numerical values of all parameters involved in Eq. (7) are given in Table 1. Note that Eq. (7) should be considered as an attempt to extend the main equation of CNT for non-equilibrium case Blaak2 of a glassy system under shear at very deep supercooling, where the inherent structural rearrangements are extremely slow and the external shear affects the transport properties directly as was discussed in Refs. Blaak2 ; Butler . The fact that the coefficients are, in fact, almost independent of the temperature shows that the process is activated by shear, rather than by thermal fluctuations.
In order to obtain an independent determination of the effective temperature, it would be necessary to determine an energy barrier at zero temperature and zero shear rate for the formation of a crystalline nucleus, and to obtain as the ratio . Unfortunately no method is known to obtain directly. A possibility, which we have not pursued in this work, would be to extrapolate results from high temperatures. As a result, our expression for the nucleation rate involving an effective temperature cannot be seen as a direct validation of this concept, but rather as a plausible extrapolation of other results Haxton_Liu ; Ilg/Barrat .
Our results demonstrate that the formation of a nanocrystalline phase in a driven, low temperature system proceeds via a nucleation mechanism, not dissimilar to the one observed in the standard liquids at moderate undercooling. Nucleation theory in its classical form is not applicable, in view of the very low temperatures. However, our results are consistent with a nucleation approach that would involve an effective temperature and a nucleation barrier, which increases with shear rate, as already reported in supercooled liquids.
This work could be extended in several directions, in particular:
(i) Metallic glasses often have quasi-crystalline phases. For the Dzugutov system studied here, the quasi-crystalline phase can coexist with the liquid (or amorphous) and crystalline phases (see Fig. in Ref. Roth_PRB_2005 ), and the spontaneous growth of quasi-crystals in this system was recently investigated by Glotzer Glotzer . It could be interesting to study the competition between quasi-crystal formation and crystal nucleation under an external drive.
(ii) Glassy materials are characterized by a waiting time dependence of their properties, or aging, and a state that depends on the cooling rate. The cooling process and the waiting time could have an influence on the ordering of the system under an external driving.
(iii) Although the one-component system considered in this study is a good glass-former, bulk metallic glasses are, as a rule, multicomponent (five different kinds of atoms, at least). Therefore, it would be of interest to study the influence of structural inhomogeneity appeared from polydispersity on the induced structural ordering.
We acknowledge useful discussions with A. Tanguy, T. Biben, R. Khusnutdinoff and R. Yulmetyev and an interesting correspondence with J. Wedekind and F. Varnik. This work was supported by ANR project “SLLOCDYN” and partially by RFBR (Grant No. 08-02-00123-a).
References
- [1] L. Farkas, Z. Phys. Chem. 125, 236 (1927).
- [2] R. Becker and W. Döring, Ann. Phys. (Leipzig) 24, 719 (1935).
- [3] Ya. B. Zel’dovich, Zh. Eksp. Teor. Fiz. 12, 525 (1942).
- [4] D. Turnbull and J. C. Fisher, J. Chem. Phys. 17, 71 (1949).
- [5] Nucleation Theory and Applications edited by J.W.P. Schmelzer (Wiley, Weinheim, 2005).
- [6] J. F. Willart, V. Caron, M. Descamps, Journal of Thermal Analysis and Calorimetry 90, 125 (2007).
- [7] N. Duff and D. J. Lacks, Phys. Rev. E 75, 031501 (2007).
- [8] A. V. Mokshin and J.-L. Barrat, Phys. Rev. E 77, 021505 (2008).
- [9] F. Trudu, D. Donadio, and M. Parrinello, Phys. Rev. Lett. 97, 105701 (2006).
- [10] L. S. Bartell and D. T. Wu, J. Chem. Phys. 127, 174507 (2007).
- [11] M. Dzugutov, Phys. Rev. A 46, R2984 (1992).
- [12] http://physchem.ox.ac.uk/~doye/jon/structures/Dzugutov/potential.html
- [13] The next reduced units are used throughout this paper. Quantities corresponding to distances and energies are expressed in the units and of the Dzugutov potential. The reduced time unit is , where is a particle mass. The temperature is in units of , whereas the pressure is in units of .
- [14] M. Dzugutov, Phys. Rev. Lett. 70, 2924 (1993); M. Dzugutov, Eur. Phys. J. B 14, 449 (2000).
- [15] S. I. Simdyankin, M. Dzugutov, S. N. Taraskin and S. R. Elliott, J. Non-Cryst. Solids 293-295, 327 (2001).
- [16] J. Wedekind, D. Reguera, and R. Strey, J. Chem. Phys. 125, 214505 (2006).
- [17] This cooling rate corresponds to the fastest among the protocols tested by Shi and Falk in Ref. [18] to create glassy samples with this model system.
- [18] Y. Shi and M. L. Falk, Phys. Rev. B 73, 214201 (2006).
- [19] J. Roth and A. R. Denton, Phys. Rev. E 61, 1063 (2000).
- [20] P. R. ten Wolde, M. J. Ruiz-Montero, and D. Frenkel, J. Chem. Phys. 104, 9932 (1996).
- [21] P. J. Steinhardt, D. R. Nelson, M. Ronchetti, Phys. Rev. B 28, 784 (1983).
- [22] M. D. Rintoul and S. Torquato, J. Chem. Phys. 105, 9258 (1996).
- [23] P. Hänggi, P. Talkner, and M. Borkovec, Rev. Mod. Phys. 62, 251 (1990).
- [24] J. Wedekind, R. Strey, and D. Reguera, J. Chem. Phys. 126, 134103 (2007).
- [25] L. A. Pontryagin, A. Andronov, and A. Vitt, Zh. Eksp. Teor. Fiz. 3, 165 (1933); E. W. Montroll and K. E. Shuler, Adv. Chem. Phys. 1, 361 (1958); R. L. Stratonovich, Topics in the Theory of Random Noise (Gordon and Breach, New-York/London, 1963), Vol. I.
- [26] L. Berthier, J.-L. Barrat and J. Kurchan, Phys. Rev. E 61, 5464 (2000).
- [27] R. J. Allen, C. Valeriani, S. Tănase-Nicola, P. R. ten Wolde, D. Frenkel, J. Chem. Phys. 129, 134704 (2008).
- [28] J. J. Cerdà, T. Sintes, C. Holm, C. M. Sorensen, and A. Chakrabarti, Phys. Rev. E 78, 031403 (2008).
- [29] P. Ilg and J.-L. Barrat, Europhys. Lett. 79, 26001 (2007).
- [30] T. K. Haxton, A. J. Liu, Phys. Rev. Lett. 99, 195701 (2007).
- [31] R. Blaak, S. Auer, D. Frenkel, and H. Löwen, Phys. Rev. Lett. 93, 068303 (2004); J. Phys.: Condens. Matter 16, S3873 (2004).
- [32] F. Varnik and O. Henrich, Phys. Rev. B 73, 174209 (2006); F. Varnik (private communications).
- [33] S. Butler and P. Harrowell, J. Chem. Phys. 118, 4115 (2003).
- [34] J. Roth, Phys. Rev. B 72, 014125 (2005).
- [35] A. S. Keys, S. Glotzer, Phys. Rev. Lett. 99, 235503 (2007).