Studying the continuum spectrum of the parsec scale jets by multi-frequency VLBI measurements
Abstract:
Multi-frequency VLBI observations allow studies of the continuum spectrum in the different parts of the parsec scale jets of AGN, providing information on the physical properties of the plasma and the magnetic fields in them. Since VLBI networks cannot be scaled, the range of spatial frequencies observed differs significantly between the different observing frequencies, which makes it difficult to obtain a broadband spectrum of the individual emission features in the jet. In this paper we discuss a model-fitting based spectral extraction method, which can significantly relieve this problem. The method uses a priori knowledge of the source structure, measured at high frequencies, to allow at lower frequencies the derivation of the sizes and flux densities of even those emission features that have mutual separations significantly less than the Rayleigh limit at the given frequency. We have successfully used this method in the analysis of 5-86 GHz VLBA data of 3C 273. The spectra and sizes of several individual jet features were measured, thus allowing derivation of the magnetic flux density and the energy density of the relativistic electrons in the different parts of the jet. We discuss the results, which include e.g. a detection of a strong gradient in the magnetic field across the jet of 3C 273.
1 Introduction
Despite the large steps that have been taken in our understanding of the nature of relativistic outflows in active galactic nuclei during the last three decades, we still remain ignorant of many of the key issues of the subject: details of the launching mechanism, matter content and the origin of the high energy emission are among the hitherto poorly understood aspects of relativistic jets [6]. One of the reasons for slow progress in these questions is our poor ability to measure some of the key physical parameters of jets.
There are basically two ways to determine the energy of the relativistic particles in jets: one is to assume equipartition between the magnetic and particle energy densities, the other is to measure the size and spectral turnover of the synchrotron self-absorbed emission features. The latter gives magnetic flux density and the normalization factor of the electron energy distribution separately, but it requires a measurement of the 2-D spectrum of parsec scale jets using multi-frequency VLBI data [5]. Such measurements are possible, yet challenging. In this paper, we describe a new method for the extraction of the spectral information from a multi-frequency VLBI data set and apply this method to a set of six-frequency VLBA observations of the quasar 3C 273 (=0.158). Throughout the paper, we use a cosmology with = 71 km s-1 Mpc-1, = 0.27, and = 0.73. This corresponds to a linear scale of 2.7 pc mas-1 for 3C 273.
2 Model-fitting based spectral extraction method

There are several complications in the analysis of multi-frequency VLBI observations of extragalactic jets if the aim is to measure a 2-D spectrum of the jet [4]. Since the target sources are typically variable, measurements at different frequencies need to be (quasi)simultaneous. Fortunately, this is possible with the VLBA due to its frequency agility. Also, the flux density calibration should be accurate to 5-10%. This is typically the case with the VLBA at frequencies GHz, but at higher frequencies special care is required. Registering the images at different frequencies can be tricky, but there are methods to correct misalignments between the maps to an acceptable precision [2]. The most severe limiting factor, however, stems from the fact that VLBI networks are not reconfigurable like e.g. VLA. Therefore, the range of probed spatial frequencies differs significantly at different observing frequencies. When comparing VLBI data at two or more observing frequencies, the traditional solution has been to match the coverages either by discarding the data of the long spacings at high frequencies or by tapering the data to a common resolution. This has the consequence that a significant amount of data are not used and much of the attainable angular resolution is lost. A broad frequency coverage, which is needed to reliably measure the synchrotron self-absorption turnover, exacerbates the problem.
We propose a model-fitting based spectral extraction method to alleviate the above-described problem of the uneven coverage. The idea is to use a priori knowledge of the source structure, measured at high frequencies, to derive, at lower frequencies, the sizes and flux densities of even those emission features that have mutual separations significantly less than the beam size at the given frequency. The model of the source structure at high frequency is taken as a template of the source’s brightness distribution, and the visibility data at lower frequency is fitted with this template. If the data has high enough signal-to-noise ratio, it is possible to fit structures that are smaller than the Rayleigh limit [3]. This is equivalent to an out-of-band extrapolation of spatial frequencies, which is the basis of so-called “super-resolution” techniques.
In practice, our method can be described as follows (see also [8]): The visibility data at the frequency which gives the best angular resolution with good SNR, is fitted with a model consisting of a small number of two-dimensional Gaussian components. This model is our brightness distribution template, which we use to fit the visibility data at the next lower frequency. Before fitting, we align the model with the lower frequency data by assuming that optically thin features in the jet have frequency-independent positions. This is done in two steps: first-order alignment is done by using the cross-correlation method of [2], and fine-tuning is done by moving the whole model around this position in small steps and fitting the component flux densities at each step while keeping the mutual separations of the components fixed. The best alignment is found by comparing the post-fit merit functions. The next step is then to inspect the residual map and add new components to the model if significant emission, which is not accounted for by the transfered model, has emerged. Also, all the components that have mutual separations of less than 1/5 of the beam size are merged into one component. This is to ensure that we do not extrapolate in spatial frequencies beyond the radius that corresponds to the typical positional accuracy of the VLBA data. With these modifications to the model, one more round of fitting is run with component flux densities and sizes as free parameters. The obtained model is now the brightness distribution template for the next lower frequency and the above steps are repeated.
Finally, we apply another piece of a priori knowledge by assuming that the angular size of the component varies smoothly over the frequencies. The sizes are inspected as a function of frequency and fitted with either a constant value or a power-law. Then component sizes in the models are fixed to the values obtained from these fits and the last round of model-fitting is run with the component flux densities as the only free parameters. This gives the final spectra. The main error sources in the final spectra are: 1) inaccuracies in the alignment, 2) uncertainties due to spatial frequency extrapolation, and 3) errors in the calibration of the flux density scale. The effect of (1) can be estimated when the alignment is fine-tuned, (2) has to be addressed with Monte Carlo simulations, and (3) is best dealt by calibrating with a single-dish telescope.
3 Spectrum of the parsec scale jet of 3C 273
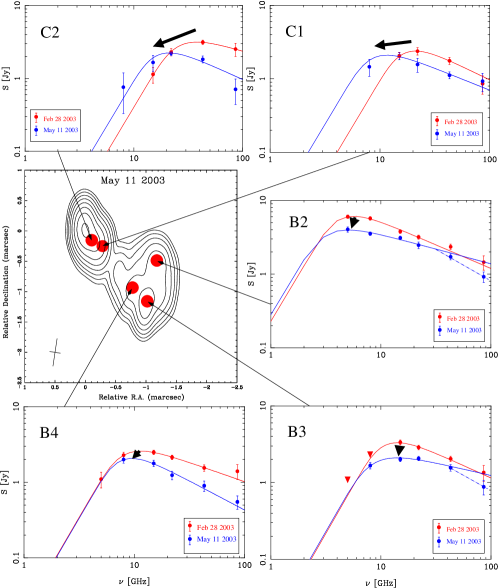
To illustrate the feasibility of the method described in Sect. 2, we present results from the spectral analysis of the multi-frequency VLBA observations of 3C 273 that were carried out at five epochs in 2003 [7, 8]. At every epoch, the source was observed at six frequencies (5.0, 8.4, 15.3, 22.2, 43.2 and 86.2 GHz) with individual scans at different frequencies interleaved to obtain practically simultaneous multi-frequency data set. An example of the obtained component spectra are shown in Fig. 1. As can be seen in the figure, the components located within 2 mas from the core have a spectral turnover in the observed frequency range. Therefore, we could fit them with a function describing self-absorbed synchrotron spectrum from an ensemble of electrons with a power-law energy distribution in a homogeneous magnetic field, and derive the turnover frequency, , the flux density at the turnover, , and the optically thin spectral index . Fig. 2 shows a comparison between the spectra observed at two consecutive epochs for some of the components. It is striking how consistent the spectra and their evolution are: and decrease with time as expected. This gives confidence in the reliability of the applied spectral extraction method. When more epochs are analyzed, the spectral evolution can be compared with the predictions of the shock-in-jet models (see [6] and references therein).
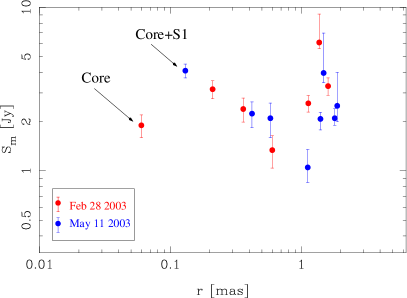
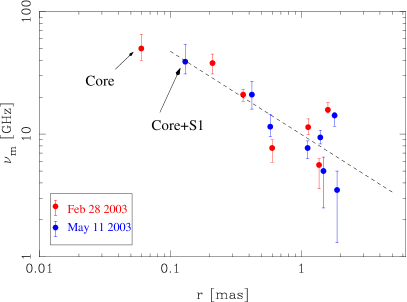
The turnover frequencies and flux densities are plotted against the distance from the core in Fig. 3. The peak frequency decreases with the distance as while the peak flux density does not seem to have any clear dependence on . This neatly confirms the compound nature of the flat radio-mm spectrum of 3C 273.
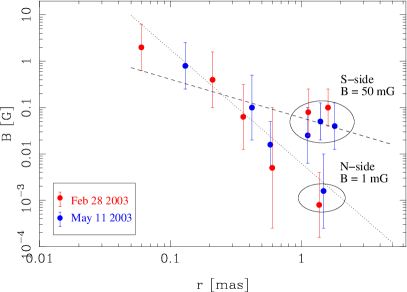
Since we had measured , , and as well as the sizes and Doppler factors (see [7]) of the components within 2 mas from the core, we were able to estimate their magnetic flux density, , and the normalization factor of their electron energy distribution, (without having to assume equipartition) [5]. The left panel of Fig. 4 shows as a function of . The core has magnetic flux density of Gauss, which is compatible with the values derived from infrared and optical variability [1]. At mas from the core, there is a large discrepancy in between the southern side (components B3 and B4; mG) and the northern side of the jet (component B2; mG). The strong gradient in the magnetic field density is coincident with the transverse velocity structure found in [7]: the components on the southern side of the jet have higher bulk velocity than components on the northern side. This may indicate a structured jet.
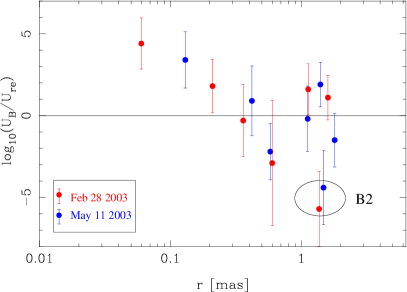
Based on the derived values of and , we calculated the ratio between magnetic and particle energy densities in the components. The right panel of Fig. 4 shows the results. The uncertainties are large, but some trends can be seen: the jet starts as magnetically dominated (mm-core) but quickly moves towards equipartition. Beyond the core, there is one component that is clearly out of equipartition: B2 is strongly particle dominated. Taking into account the slow velocity, weak magnetic field and position of component B2, we possibly see a mixing region where turbulence introduced by velocity shear converts kinetic and/or magnetic flux into electron energy.
Acknowledgments.
TS is a research fellow of the Alexander von Humboldt Foundation. This work was also partially supported by the Academy of Finland grant 120516. The VLBA is a facility of the National Radio Astronomy Observatory, operated by Associated Universities, Inc., under cooperative agreement with the U.S. National Science Foundation.References
- [1] T.J.-L. Courvoisier et al. Rapid infrared and optical variability in the bright quasar 3C273, Nature 335 (1988), 330
- [2] S.M. Croke & D.C. Gabuzda, Aligning VLBI images of active galactic nuclei at different frequencies, MNRAS 386 (2008), 619
- [3] Y.Y. Kovalev et al., Sub-Milliarcsecond Imaging of Quasars and Active Galactic Nuclei. IV. Fine-Scale Structure, AJ 130 (2005), 2473
- [4] A.P. Lobanov, Spectral distributions in compact radio sources. I. Imaging with VLBI data, A&AS 132 (1998), 261
- [5] A.P Marscher, Synchro-Compton emission from superluminal sources in Superluminal radio sources, Cambridge University Press (1987), 280
- [6] A.P. Marscher, Relativistic Jets in Active Galactic Nuclei in proceedings of Relativistic Jets: The Common Physics of AGN, Microquasars, and Gamma-Ray Bursts, AIP Conf. Proc. 856 (2006), 1
- [7] T. Savolainen et al., Multifrequency VLBA monitoring of 3C 273 during the INTEGRAL Campaign in 2003. I. Kinematics of the parsec scale jet from 43 GHz data , A&A 446 (2006), 71
- [8] T. Savolainen et al., Magnetic Field Structure in the Parsec Scale Jet of 3C 273 from Multifrequency VLBA Observations in proceedings of Extragalactic Jets: Theory and Observation from Radio to Gamma Ray ASP Conference Series, Vol. 386 (2008), 451