11email: curdt@mps.mpg.de 22institutetext: School of Earth and Space Sciences, Peking University, China 33institutetext: Institut d’Astrophysique Spatiale, Unité Mixte CNRS – Université de Paris XI, 91405 Orsay, France
The Ly profile and center-to-limb variation of the quiet Sun
Abstract
Aims. We study the emission of the hydrogen Lyman- line in the quiet Sun, its center-to-limb variation, and its radiance distribution. We also compare quasi-simultaneous Ly and Ly line profiles.
Methods. We used the high spectral and spatial resolution of the SUMER spectrometer and completed raster scans at various locations along the disk. For the first time, we used a method to reduce the incoming photon flux to a 20%-level by partly closing the aperture door. We also performed a quasi-simultaneous observation of both Ly and Ly at the Sun center in sit-and-stare mode. We infer the flow characteristic in the Ly map from variations in the calibrated 1206 Si iii line centroids.
Results. We present the average profile of Ly, its radiance distribution, its center-to-limb behaviour, and the signature of flows on the line profiles. Little center-to-limb variation and no limb brightening are observed in the profiles of the Ly line. In contrast to all other lines of the Lyman series, which have a red-horn asymmetry, Ly has a robust and - except for dark locations - dominating blue-horn asymmetry. There appears to be a brightness-to-asymmetry relationship. A similar and even clearer trend is observed in the downflow-to-asymmetry relationship. This important result is consistent with predictions from models that include flows. However, the absence of a clear center-to-limb variation in the profiles may be more indicative of an isotropic field than a mainly radial flow.
Conclusions. It appears that the ubiquitous hydrogen behaves in a similar way to a filter that dampens all signatures of the line formation by processes in both the chromosphere and transition region.
Key Words.:
Sun: UV radiation – Sun: transition region – Line: formation – Line: profile1 Introduction
Ly is by far the strongest line in the VUV spectral range and must play a dominant role in many – if not all – processes in the solar atmosphere. Irradiance at the line center excites atomic hydrogen in the cool material of our solar system by resonant scattering, playing an important role in planetary, cometary, and heliospheric physics. Despite its importance, high-resolution spectroscopic observations of this line are scarce and fundamental information is still missing or based on indirect methods. We present unprecedented observations of the solar emission in the Ly line of neutral hydrogen with a detailed analysis of line profiles at various locations on the solar disk.
Three decades ago, the calibrated line profiles over the full disk of Ly and Ly were obtained from OSO 8 data (Lemaire et al., 1978), while the Skylab ATM (Reeves, 1976) provided moderate resolution radiance maps at different locations on the disk. Basri et al. (1978) used Ly rocket flight spectra obtained by the HRTS instrument to investigate the network contrast and center-to-limb variation in the line profile. One decade later, Fontenla et al. (1988) reported observations of the Ly profile for various solar disk features obtained by the SMM/UVSP instrument. However, all of these measurements were hampered by the strong, narrow geocoronal absorption at the line center.
With the advent of SoHO, which offers uninterrupted and undisturbed observations of the Sun from its orbit around the Lagrangian Point L1, new attempts were made to study this line with unprecedented spectral resolution. Lemaire et al. (1998) could deduce the average line profile of the solar irradiance by observing off disk the scattered light from the primary mirror of the SUMER spectrometer. They found a Ly profile that had nearly no asymmetry. Lemaire et al. (2002) compared the profiles of Ly and Ly and report calibrated irradiances with 10% uncertainty. A few years later, Lemaire et al. (2005) investigated the variation in Ly during solar cycle 23. In contrast to Ly, which is generally too strong to be observed on disk by SUMER, Ly and the higher members of the Lyman series were repeatedly observed. Warren et al. (1998) completed a comprehensive analysis of these profiles. They found that (1) all lines from levels with main quantum number are self-reversed and have a shape that deviates substantially from Gaussian with a self-reversal that decreases with increasing ; (2) all lines are asymmetric, the red horn being higher than the blue horn; (3) interestingly, the red-horn asymmetry is more pronounced for the brighter network areas.
Emerich et al. (2005) established a new relationship between the line center H i Ly irradiance and the total line irradiance derived from the scattered light from the primary mirror of the SUMER instrument. This work superseded earlier work of Vidal-Madjar & Phissamay (1980), which used OSO 5 data and where the Ly line had to be corrected for geocoronal absorption.
Fontenla et al. (2002) published a model to describe the Ly line formation. They demonstrated that static models do not reproduce the observations and more reliable results can be obtained by assuming that flows and diffusion play a major role.
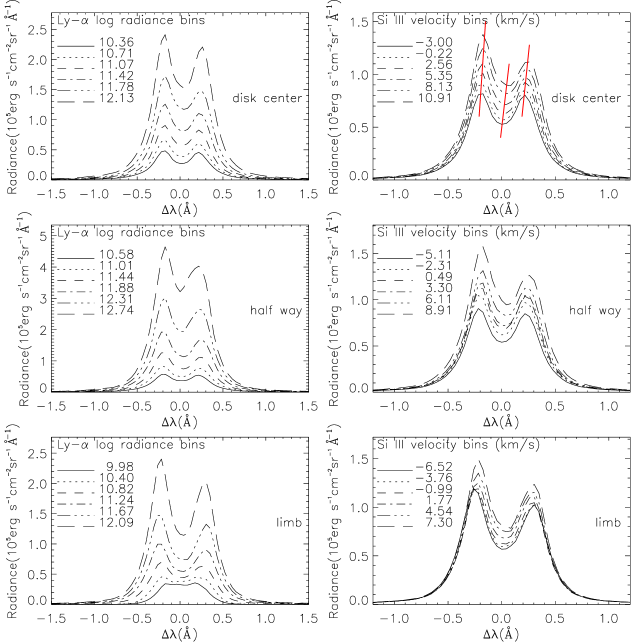
Right: The Doppler flow in km/s-1 for each pixel was established by the deviation of the 1206 Si iii line centroid from the rest wavelength and six equally spaced velocity bins were defined. Negative values correspond to upflows, and positive values to downflows. Here, we have excluded data points obtained off-disk. The different Ly profiles for these six velocity bins are shown.
The blue horn is always stronger than the red horn. The asymmetry increases significantly with the redshift. Near disk center, all line features (red horn, blue horn, central depresssion) are offset towards longer wavelenths with increasing downflows, as indicated by the red tracing lines. Close to the limb, the velocity bins are set up almost symmetrically relative to rest, and the variation in the radiance with velocity is significantly lower than on disk. This effect is expected for mostly radial plasma downflows in optically thin TR emission such as 1206 Si iii.
2 Method
SUMER can observe both the entire Lyman series and the wavelength range from 666 Å to the Lyman limit, which is dominated by the hydrogen recombination continuum. Due to its enormous brightness, the Ly line, however, inundates the SUMER detectors during observations. The high photon rate produces a gain depression in the microchannel plates (MCP) such that single pulses cannot be detected. To overcome this shortcoming, 1:10 attenuating grids above 50 pixels on both sides of the detectors were introduced into the optical design of the instrument (Wilhelm et al., 1995). It became clear, however, that the attenuation also exerts a modulation on the line profile, which makes it difficult to interpret these data, and the attenuators have therefore not been used here.
Several attempts were made to observe this line on the bare part of the detector, and to extrapolate the gain-depression correction to the high photon input rate attained during those exposures. However, this introduced a high uncertainty in the signal determination, in particular for the brighter pixel locations (Teriaca et al., 2005a, b, 2006).
For the first time, a new method and non-routine operation were applied, which employed the aperture door to reduce the incoming photon flux to a moderate level. The partial closing of the door – accomplished during a real-time commanding session prior to the observation and re-opening thereafter – reduced the input photon rate by a factor of . As a prologue for these observations, full-detector images in the Lyman continuum around 880 Å were obtained with open and partially-closed door. At this wavelength setting, the illumination of the detector is rather uniform, and no saturation effects had to be considered. In this way, accurate values for the photon flux reduction could be established. To date, four Ly observations with partially-closed door have been performed.
3 Observations
On June 24 and 25, 2008, we obtained 120′′ 120′′ rasters at the disk center, at a location close to the east limb, and at a position half-way to the limb in the equatorial plane. The limb scan extended to a position 10′′ above the limb. Two spectral windows were transmitted, 100 pixels (px) around Ly recorded on the bare photocathode of the detector, and 50 px around 1206 Si iii recorded on the KBr part of the photocathode, respectively. All observations were completed with the 0.3′′ 120′′ slit. With an exposure time of 15 s, both lines were observed with sufficient counts for a good line profile analysis.
A similar observation along the central meridian and including the South Pole was performed on June 26, 2008. On July 2, 2008, a sit-and-stare sequence was completed at disk center with a second wavelength setting for Ly . We monitored a projected area of 100 px around Ly on the KBr portion of the MCP and 50 px around 1032 O vi on the bare MCP. Each time, the back-and-forth movement of the wavelength mechanism between subsequent exposures lasted for seconds and led to a cadence of 50.5 s (15 s + 10.25 s + 15 s + 10.25 s). The eastern hemisphere of the solar disk was void of active regions on all four days.
All four data sets were processed with standard procedures of the SUMER-soft library. To complete the flatfield correction, we used a dedicated flatfield exposure, which was acquired close in time on June 28, 2008. The flatfield-correction matrix was obtained by applying a 16 px 16 px median filter to the flatfield exposure.
4 The Ly profile and radiance distribution
We sorted the pixels of all observed locations on the disk by the total line radiance and defined six equally spaced radiance bins. The profiles for these bins are displayed in the left portion of Fig.1, complementing the work of Warren et al. (1998). All profiles are self-reversed, show a blue-horn asymmetry and have a similar shape, independently of brightness and limb-distance. There is, however, a clear brightness-to-asymmetry relationship. Brighter features show a more asymmetric profile.
We now produce a Doppler map using the simultaneously recorded 1206 Si iii line. We assume that the Si iii emission observed in off-disk positions was free from systematic flows, which allowed us – after a correction of 1.8 km/s for the solar rotation – to establish a rest wavelength for Si iii. The rest wavelength may still have been affected by spicular activity above the limb. It would have been impossible, however, to achieve such an accurate absolute wavelength calibration from the self-reversed Ly line. In a similar way to the radiance case, we now define equally spaced velocity bins reaching from -3.0 km/s to 10.9 km/s for the scan at disk center. As displayed in the right section of Fig.1, this result is consistent with the well-known net redshift of TR emission (e.g., Brekke et al., 1997; Teriaca et al., 1999). The closer the approach to the limb, the more uniform the line strengths are when sorted into velocity bins; here, the velocities of the bins are almost symmetric relative to zero, an effect expected for radial downflows. It is obvious that the profiles, which are almost symmetric for locations with little or no downflow, but become increasingly asymmetric with increasing downflow. This result confirms and extends the observations of Fontenla et al. (1988). It is also interesting to see that all line features (red horn, blue horn, and central depression) are offset towards longer wavelenths with increasing downflow velocities. This is a clear indication that, at locations with downflows, the absorption in the red horn is increased, and that flows play a major role. These findings are consistent with the downflow model of Fontenla et al. (2002).
Motivated by the similarity between the results to date, we accumulated the
pixels of all disk center and half-way scans to derive a more robust statistic. The
distributions of the full line radiances, , of both Ly and 1206 Si iii
are shown in Fig. 2. They almost perfectly follow a log-normal distribution
f() = with coefficients
= (24.79, 1.623, 0.591, 1.284)
and = (24.54, 1.457, 0.746, 0.338).
Fontenla et al. (1988) obtained a similar but noisier result from UVSP data. Our result complements the work of Pauluhn et al. (2000), which was focussed on optically thin TR lines.

5 The Ly center-to-limb variation
For all observed locations, we determined descriptive parameters for the profile, namely the peak radiances of both horns, the minimum radiance of the central depression , and , and the corresponding wavelengths , , and . Polynomial fits were applied to achieve values with sub-pixel resolution. The scatter plots for these parameters versus limb distance (not shown here) are rather flat, since no parameter shows a significant trend. However, in the near-limb raster of the data set on 26 June, which includes the southern polar coronal hole, a clear trend is seen in the horn separation (lower right in Fig.3) and to a lesser extent in the construct (upper right). The trend in the ratio (lower left) is less significant still and the full line radiance (upper left) shows no trend. More observations of this type are needed to substantiate this result.

Our radiance data also allows us to test the relation of the central Ly spectral irradiance and the total Ly line irradiance published by Emerich et al. (2005). The scatter plots (not shown here) suggest an almost linear relationship with significant center-to-limb variation. We found ratios of line center radiance to full line radiance of 9.35 0.24 at disk center, 9.25 0.10 half-way to the limb, and 5.91 0.18 at the limb. This suggests a deeper self-reversal close to the limb.

It is most obvious that the asymmetries in the Ly and Ly lines are reversed, and there is a clear correspondence between asymmetry and downflows for both lines.
Our result is in agreement with Emerich et al. (2005) for a linear fit in their Fig. 6.
6 Ly and Ly comparison
To complete a pixel-by-pixel comparison of both lines we had to compensate for the small offset along the slit introduced by the movement of the wavelength mechanism. This was achieved by the delta_pixel routine of the SUMER-soft library. The data set was analyzed in similar steps as described in Sect. 4. The results of our analysis of both the Ly and Ly line profiles are presented in Fig.4. In a similar way to Fig.1, we show the profiles for various radiance bins and Dopplershift bins. Although there is an obvious correspondence between the asymmetry and downflows of both lines, it is also clear that the asymmetries in the Ly and Ly lines are reversed. This last, unexpected result is reproduced poorly by the model with the stronger downflow in Fontenla et al. (2002). However, the model (as discussed also by its authors) does not reproduce well the observed profiles (particularly that of Ly ), indicating that significant improvement is still required in modeling these lines and the solar structures in which they originate.
The relationship between asymmetry and downflows and the comparison with models would, thus, indicate the presence of a persistent downflow such as that observed in the optically thin TR lines. The apparent lack of a center-to-limb variation in the line asymmetry is consistent with a quite isotropic system of downflows. In the case of optically thin lines, the opposite flows cancel out at the limb as indicated by the disappearance of the average downflow of TR lines at the limb (Peter, 1999), while this is not necessarily true for the thick H i Lyman lines.
To characterise the line ratio, we prepared a scatter plot of the Ly line radiances versus Ly line radiances (not shown here). We found an almost linear relationship with a photon per line ratio of 188 1. Our value is considerably higher than those measured to be 121 and 85 by Vernazza & Reeves (1978) and Lemaire et al. (2005), respectively. The numerical uncertainty in our result is negligible if compared with other error sources. For the uncertainty introduced by the relative radiometry, we estimate a conservative value of 10% (the sensitivity curve of SUMER is rather flat in the range from 1020 Å to 1220 Å). The discrepancy between this new result and previous observations of ATM and OSO-8 may be due, at least in part, to the poorer quality of the photometry used in these earlier reports. It may also be because the selection of only 120 pixels provided a sample that was unrepresentative of the mean behavior of the Sun, and may therefore be resolved by completing similar observations but with a larger raster in both lines. We have initiated a dedicated project to investigate this issue further.
7 Summary and conclusion
We have presented the first on-disk SUMER observations of Ly with reduced incoming photon flux and some fundamental results derived thereof. Such observations are important in many respects as already demonstrated here. It is, however clear that this work can only be the starting point of greater efforts to understand the excitation and absorption processes responsible for the line formation, and eventually to constrain atmospheric models. From our work, we conclude that downflows must play a fundamental role in line profile formation. We plan further observations during the rise of solar cycle 24. These will reveal more details and indicate, whether there is an imprint of solar activity on the profile of this important line.
Acknowledgements.
The SUMER project is financially supported by DLR, CNES, NASA, and the ESA PRODEX Programme (Swiss contribution). SUMER is part of SOHO of ESA and NASA. HT is supported by China Scholarship Council for his stay at MPS. This non-routine observation was performed with the help of D. Germerott. We thank V. Andretta and an anonymous referee for valuable comments and suggestions.References
- Basri et al. (1978) Basri, G. S., Linsky, J. L., Bartoe, J.-D. F., Brueckner, G., & Van Hoosier. M. E. 1979, ApJ 230, 924.
- Brekke et al. (1997) Brekke, P., Hassler, D. M., & Wilhelm, K. 1997, Sol. Phys. 175, 349.
- Emerich et al. (2005) Emerich, C., Lemaire, P., Vial, J.-C., Curdt, W., Schühle, U., & Wilhelm, K. 2005, Icarus 178, 429.
- Fontenla et al. (1988) Fontenla, J. M., Reichmann, E. J., & Tandberg-Hanssen, E. 1988, ApJ 329, 464.
- Fontenla et al. (2002) Fontenla, J. M., Avrett, E. H., & Loeser, E. 2002, ApJ 572, 636.
- Lemaire et al. (1978) Lemaire, P., Charra, J., Jouchoux, A., Vidal-Madjar, A., Artzner, G. E., Vial, J.-C., Bonnet, R. M., & Skumanich, A. 1978, ApJ 223, L55.
- Lemaire et al. (1998) Lemaire, P., Emerich, C., Curdt, W., Schühle, U., & Wilhelm, K. 1998, A&A 334, L1098.
- Lemaire et al. (2002) Lemaire, P., Emerich, C., Vial, J.-C., Curdt, W., Schühle, U., & Wilhelm, K. 2002, in Proc. SOHO 11 From Solar Min to Max: Half a Solar Cycle with SOHO, ed. A. Wilson, March 2002, Davos, Switzerland, ESA SP-508, 219.
- Lemaire et al. (2005) Lemaire, P., Emerich, C., Vial, J.-C., Curdt, W., Schühle, U., & Wilhelm, K. 2005, AdSpR 35, L384.
- Pauluhn et al. (2000) Pauluhn, A., Solanki, S. K., Rüedi, I., Landi, E., & Schühle, U. 2000, A&A 362, 737.
- Peter (1999) Peter, H. 1999, ApJ 516, 490.
- Reeves (1976) Reeves, E. M. 1976, Sol. Phys. 46, 53.
- Teriaca et al. (1999) Teriaca, L., Banerjee, D., & Doyle, J. G. 1999, A&A 349, 636.
- Teriaca et al. (2005a) Teriaca, L., Schühle, U., Solanki, S. K., Curdt, W.,& Marsch, E. 2005a, in Proc. Chromospheric and Coronal Magnetic Fields, ed. Innes, D. E., Lagg, A., & Solanki, S. K., Sept. 2005, Katlenburg-Lindau, Germany, ESA SP-596, 66.
- Teriaca et al. (2005b) Teriaca, L., Schühle, U., Solanki, S. K., Curdt, W., & Marsch, E. 2005b in Proc. ESPM The Dynamic Sun: Challenges for Theory and Observations, ed. Danesy, D., Poedts, S., De Groof, A., & Andries, J., Sept. 2005, Leuven, Belgium, ESA SP-600,100.
- Teriaca et al. (2006) Teriaca, L., Schühle, U., Solanki, S. K., Curdt, W., Marsch, E. 2006, in Proc. 10 years of SoHO and beyond, ed. Lacoste, H. & Ouwehand, L., Giardini-Naxos, Italy, ESA SP-617, 77.
- Vernazza & Reeves (1978) Vernazza, J. E. & Reeves, E. M. 1978, ApJS 37, 485.
- Vidal-Madjar & Phissamay (1980) Vidal-Madjar, A. & Phissamay, B. 1980, Sol. Phys. 66, 259.
- Warren et al. (1998) Warren, H. P., Mariska, J. T., & Wilhelm, K. 1998, ApJS 119, 105.
- Wilhelm et al. (1995) Wilhelm, K., Curdt, W., Marsch, E., et al., 1995, Sol. Phys. 162, 189.