Geometrical indications of adsorbed hydrogen atoms on graphite producing starlike and ellipsoidal features in scanning tunneling microscopy images
Abstract
Recent scanning tunneling spectroscopy (STM) experiments display images with star and ellipsoidal like features resulting from unique geometrical arrangements of a few adsorbed hydrogen atoms on graphite. Based on first-principles STM simulations, we propose a new model with three hydrogen atoms adsorbed on the graphene sheet in the shape of an equilateral triangle with a hexagon ring surrounded inside. The model reproduces the experimentally observed starlike STM patterns. Additionally, we confirm that an ortho-hydrogen pair is the configuration corresponding to the ellipsoidal images. These calculations reveal that when the hydrogen pairs are in the same orientation, they are energetically more stable.
Hydrogen adsorption on graphite surface has been the subject of many theoretical and experimental studies, due to its fundamental importance in both science and technology roman (1, 2, 3, 4, 5, 6, 7, 8). The STM technique is known as one of the most powerful experimental tools for analyzing surfaces. Through this technique, for example, Hornekær et al. considered the atomic structures of various types of H(D) clusters on graphite hornekar1 (6, 7). In their latest experiments, they identified two types of clusters as the most abundant hydrogen species on graphite surface. The STM images of these clusters exhibit star and ellipsoidal like features, see FIG. 1(a) hornekar3 (8). The former includes six bright spots, three of which are relatively larger than the others hornekar3 (8). Considering the STM images observed at various bias voltages, Hornekær et al. concluded that the starlike feature originates from a particular arrangement of three or four hydrogen atoms adsorbed on graphite surface hornekar3 (8). For the ellipsoidal STM feature, using a set of STM simulations, Hornekær et al. proposed that it should represent a pair of hydrogen atoms adsorbed on two adjacent carbon atoms, so-called ortho-hydrogen pair. Although, the computed STM image by Hornekær et al. appears to be in agreement with experiment, the authors have not clarified how a pair of hydrogen atoms with H-H distance 2.1 Å can produce an elongated-ellipsoidal feature with a length of 7.0 Å hornekar1 (6, 8). In the present work we propose a model whose computed STM image perfectly matches with experimentally observed starlike STM images. Additionally, we confirm that the ortho-hydrogen pair is the configuration for the ellipsoidal images and explain how these pairs produced the elongated features in STM images. We further investigate the interaction of hydrogen pairs together. Our calculations show that when the pairs are oriented in the same direction, they are energetically more stable.
The electronic structure calculations are carried out within the context of density functional theory (DFT) using the spin-polarized PerdewBurkeErnzerhof (PBE) exchange-correlation functionals and the projected augmented wave (PAW) method, as implemented in the VASP code vasp (9). The adsorbed hydrogen atoms on graphite surfaces are simulated using a graphene sheet containing 96 carbon and appropriate number of hydrogen atoms (two, three, or four). The corresponding Brillouin Zone is sampled by a 551 Monkhorst-Pack mesh. The structures are fully optimized until the magnitude of force on each ion becomes less than 0.04 eV/Å. There is currently no simple way to apply the electric field in the VASP calculations. Accordingly, we use the SIESTA, which is a DFT code with localized basis sets soler (10), for the simulation of STM images. We performed a new set of spin-polarized single-point energy calculations for the structures, previously optimized by VASP, in the same level of theory (DFT/PBE) but at definite electric fields. A full description of our methodology for STM calculations can be found in Ref. khazaei1 (11, 12, 13).
To identify the geometrical positions of hydrogen atoms on graphite producing the starlike STM image, we first examine models with four H atoms (labeled as S1 and S2 ) and three H atoms (labeled as S3 and S4), proposed by Hornekær et al. hornekar3 (8), see FIG. 1(b). Figures 1(c-f) show the STM images computed for S1, S2, S3, and S4 under an electric field of 0.5 V/Å. From FIGs. 1(c-f), it is evident that none of the above models can reproduce the experimentally observed STM pattern. Interestingly, the computed STM images of S1 and S2 with four hydrogen atoms have only three bright spots while the S3 structure with three hydrogen atoms shows four bright spots in its STM pattern. This can be attributed to the fact that the computed current is substantially proportional to the electron tunneling and LDOS. For S1 and S2, our calculations show almost no LDOS at left turning points of the central hydrogen atom. As a result, the emitted current from the central hydrogen atom becomes negligibly small. On the other hand, for S3, both the electron tunneling and LDOS turn out to be significantly higher for H atoms and their central carbon atom. Accordingly, these four atoms contribute substantially to the total emitted current, as can be seen in FIG. 1(e).
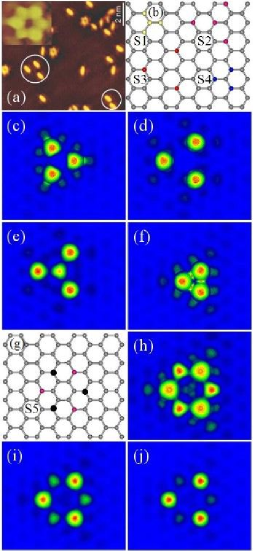
We propose a new model S5, in which three hydrogen atoms are symmetrically placed on the graphene sheet in an equilateral triangle encompassing a complete hexagon ring of carbon atoms, see FIG. 1(g). The configuration S5 has a large magnetic moment of 3.
The spin-polarized calculation shows that total energy is approximately 0.1 eV less than that estimated by non spin-polarized calculation. Therefore the S5 structure is expected to be magnetic even at room temperature. Figures 1(h-j) show the STM images of S5 computed at 0.7, 0.5, and 0.3 V/Å, respectively. The computed STM images all show a starlike feature similar to that observed in experiment. There are six bright spots, three of which look relatively larger than the other three. Comparing the position of the spots and the geometrical configuration of S5, the centers of the larger (smaller) spots turn out to be on the hydrogen atoms (the carbon sites indicated by black spots in FIG. 1(g)). In agreement with experimental results reported by Hornekær et al., our simulations demonstrate that when the strength of applied voltages decreases (here from 0.7 to 0.3 V/Å), the intensity of the small spots reduces. To explain the low intensity of small spots at low voltages, we have considered the patterns of total LDOS and total tunneling probability of S5 (not shown here). These results show that the LDOS patterns are almost the same under various applied voltages. At high-applied voltage 0.7 V/Å, the tunneling probabilities of electrons from both hydrogen and carbon atoms are large. At lower voltages, 0.3 and 0.5 V/Å, the tunneling probability of electrons from hydrogen atoms is relatively larger than that from carbon atoms. Such a difference can be attributed to the fact that the adsorbed hydrogen atoms create dipole moments on the graphene surface whereby the effective potential around the hydrogen atoms decreases and consequently, the tunneling probability of electrons from them increases. This explains the reason for high electron emission from hydrogen atoms in all ranges of applied voltages. It is worth mentioning that further calculations using a larger unit cell with a side length of 35Å reveals no change in the computed STM images and magnetic properties of S5.
To compare the stability of S5 with other structures, we summarize in Table 1, the respective adsorption energy values of hydrogen atoms for optimized S3, S4, S5 and S6 configurations (the latter is illustrated in FIG. 2). The adsorption energy is defined as = where , and are the total energies obtained for a graphene sheet with n adsorbed hydrogen atoms, a perfect graphene sheet and an isolated H atom, respectively. Overall comparison shows that the most stable structures, S3 and S5, are energetically isomeric. However, since the STM image of S3 is totally different from that observed in experiment, S5 appears to be practically preferable to S3. This implies that there should be a post-adsorption mechanism affecting the structure of initially adsorbed hydrogen clusters on graphite, otherwise, S3 and S5 should statistically have had the same population, in practice. Thus, the experimental conditions, within which the above STM images have been observed, need to be carefully taken into account. In the experiment, S5 is observed in samples which are annealed to 525K after a heavy deposition of H(D) atoms on the surface. Since the utilized H(D) beam is extremely hot (1600-2200 K), hydrogen clusters, in various configurations including S1-S6, are created hornekar2 (7, 8). However, by annealing the sample, many of these clusters are evaporated from the surface or change to other configurations. A statistical study by Hornekær et al. reveals that, the relative abundance of two specific H(D) species with starlike and ellipsoidal STM features dominantly increases, as the sample is further annealed to 570 K hornekar3 (8). The process, described above, suggests that after annealing the sample, many H(D) species initially deposited on the surface transform into S5 configuration. For such a transition, basically, species with similar symmetry but higher energy such as S6 are preferred.
| structures | E | structures | Ea (eV) |
|---|---|---|---|
| S3 | -2.63 | D1 | -2.8 |
| S4 | -2.61 | D2 | -1.65 |
| S5 | -2.62 | D3 | -2.75 |
| S6 | -2.43 | D4 | -1.59 |
| D5 | -2.18 | ||
| D6 | -1.67 | ||
| D7 | -1.83 |
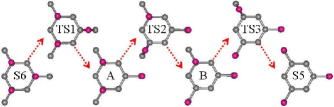
A possible transition pathway from S6 to S5 is depicted in FIG. 2. In this picture, The diffusion reactions S6A, AB, and BS5 are assumed to pass through the barriers , and whose saddle points are at the transition states, TS1, TS2, and TS3, respectively. Note that, above all terms include the zero-point energy correction. To find the correct transition paths and the corresponding energy barriers, we use the nudged elastic band method henkelman (15). As a criterion for determining the saddle points, the phonon eigenmodes of each TS are examined so that they have one and just one imaginary frequency. Accordingly, , and , are obtained to be 0.48 eV, 0.84 eV and 0.86 eV, respectively. The maximum influence of vibrational zero-point energy correction on barriers is less than 0.12 eV. For the sake of comparison, we have also calculated the energy barrier for desorbing each of hydrogen atoms, supposed to be displaced through S6A, AB, and BS5 reactions. The respective desorption energies are 0.67, 1.0, and 1.2 eV. Thus by annealing, the hydrogen atoms in S6 prefer to diffuse to S5 through the process described above rather than to be desorbed from the graphene surface.
To further asses the possibility of above reactions at different temperatures, we have estimated the rate of reactions at 300K and 500K within the transition-state theory vegge (16). In this approach, the rate of reaction is defined as = where and are the eigenmodes of initial state (IS) and transition state (TS), and as pointed out earlier is the energy difference between TS and IS after including zero point energy correction. On this basis, the respective values of at 300K and 500 K are expected to be S6A: and , AB: and , and BS5: , and . These results clearly verify that the proposed transition process is practically very feasible. It is necessary to note that S5 may not be the most stable configuration for adsorption of three hydrogen atoms on graphene. Rather, it is a metastable structure made in a particular experimental conditions.
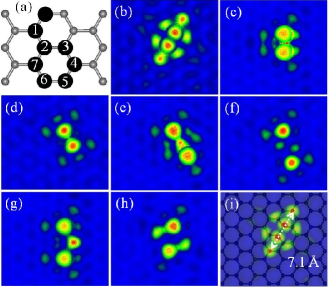
As mentioned earlier, the experimentally observed STM images include patterns with elongated-ellipsoidal features hornekar3 (8). Hornekær et al. proposed that such features originate from a pair of H atoms, adsorbed on two adjacent carbon atoms of graphite hornekar1 (6). Although their model, here labeled as D1, appears to reproduce the same ellipsoidal STM features, their calculations fail to explain, how a pair of hydrogen atoms with H-H distance of 2.1Å can produce a bright ellipsoidal feature as long as 7.0Å hornekar3 (8). To answer this question, we have computed the STM image for D1 and other possible H dimers. The structure of dimers and their corresponding STM images are illustrated in FIG. 3. Additionally, in Table 1, we have summarized the values of adsorption energies. According to FIG. 3, each dimer has a unique STM pattern. Reassuringly, D1, is the only dimer structure whose STM image represents ellipsoidal feature, similar to that observed in experiment. Interestingly, the bright ellipsoidal pattern obtained in our STM calculation for D1 has almost the same experimental length 7.0Å. For the sake of clarity, in FIG. 3(i) we have projected the D1’s STM image onto its geometrical structure. Evidently, not only the hydrogen atoms but also their neighboring carbon atoms contribute significantly to the total STM current. In other words, the creation of D1 on graphene changes the electronic structure of its surrounding carbon atoms such that their corresponding LDOS values become significantly large. Consequently, they contribute substantially to the STM current. D1 is nonmagnetic system and according to Table 1, it is energetically the most stable configuration in comparison to other dimer models. Experimental results also show that D1 is the most abundantly formed configuration.
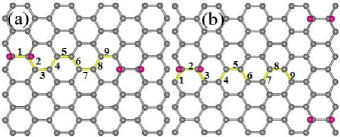
Interestingly, it appears that many of the H dimers absorbed on graphite, seems to be oriented in the same direction. This can be clearly seen in FIG. 1(a), see the bright spots discriminated by the white circles. To elaborate on this observation, we have carried out a set of calculations in which the adsorption energy is calculated for two and three H dimers when they have different orientations and distances in respect to each other. In our models as shown in FIGs. 4 (a) and (b), we keep the position of one or two of dimers fixed on the surface, while the other dimer is displaced so that for each calculation it is on one of C-C bonds, indicated by numbers 1-9. To minimize the interaction of dimers with their periodic images in the neighboring unit cells, for calculations with two (three) H dimers we have considered a very large unit cell 34.08Å14.76 Å (34.08Å29.52 Å), containing 192 (384) C atoms. The corresponding values of adsorption energies are summarized in Table 2. The results clearly indicate that dimers with same direction become energetically more stable, as they get closer to each other. On the other hand, the disorientation of H dimers results in an increase in the surface energy and, hence, in instability of whole structure. Consequently, the adsorbed H dimers prefer to diffuse on graphene surface so that they can stay in the same directions.
| Position of | Ea of two dimers | Ea of three dimers |
|---|---|---|
| displaced dimer | (eV) | (eV) |
| 1 | -5.58 | -8.18 |
| 2 | -5.49 | -8.21 |
| 3 | -5.69 | -8.19 |
| 4 | -5.54 | -8.18 |
| 5 | -5.66 | -8.22 |
| 6 | -5.39 | -8.16 |
| 7 | -6.17 | -8.12 |
| 8 | -5.64 | -8.27 |
| 9 | -5.71 | -8.18 |
In conclusion based on STM image calculations, we have identified the geometrical configurations of the most abundant species of adsorbed hydrogen atoms on graphite after a heavy dosing of H(D) atoms. The structures were shown to have two and three hydrogen atoms with STM images having elongated-ellipsoidal and starlike features, respectively. The former (latter) turned out to be nonmagnetic (strongly magnetic). In the case of hydrogen pairs, they are energetically more stable when oriented in the same direction.
M.K. and H.M. acknowledge their funding from the New Energy and Industrial Technology Development Organization (NEDO). The authors are grateful to Prof. M. Philpott and Prof. R. V. Belosludov for their helpful comments.
References
- (1) T. Roman et al., Carbon 45, 203 (2007).
- (2) D. W. Boukhvalov et al., Phys. Rev. B 77, 035427 (2008).
- (3) Y. Ferro et al., Phys. Rev. B 78, 085417 (2008).
- (4) O. V. Yazyev and L. Helm, Phys. Rev. B 75, 125408 (2007).
- (5) Y. Lei et al., Phys. Rev. B 77, 134114 (2008).
- (6) L. Hornekær et al., Phys. Rev. Lett. 96, 156104 (2006).
- (7) L. Hornekær et al., Phys. Rev. Lett. 97, 186102 (2006).
- (8) L. Hornekær et al., Chem. Phys. Lett. 446, 237 (2007).
- (9) G. Kresse and J. Furthmüller, Comput. Mater. Sci. 6, 15 (1996).
- (10) J. M. Soler et al., J. Phys.: Condens. Matter 14, 2745 (2002).
- (11) M. Khazaei et al., Phys. Rev. Lett. 95, 177602 (2005).
- (12) M. Khazaei et al., J. Phys. Chem. C 111, 6690 (2007).
- (13) D. R. Penn and E. W. Plummer, Phys. Rev. B 9, 1216 (1974).
- (14) A. Andree et al., Chem. Phys. Lett. 425, 99 (2006).
- (15) G. Henkelman et al., J. Chem. Phys. 113, 9901 (2000).
- (16) T. Vegge, Phys. Rev. B 70, 035412 (2004).