3D Genus Topology of Luminous Red Galaxies
Abstract
We measure the 3D genus topology of large scale structure using Luminous Red Galaxies (LRGs) in the Sloan Digital Sky Survey and find it consistent with the Gaussian random phase initial conditions expected from the simplest scenarios of inflation. This studies 3D topology on the largest scales ever obtained. The topology is sponge-like. We measure topology in two volume-limited samples: a dense shallow sample studied with smoothing length of 21Mpc, and a sparse deep sample studied with a smoothing length of 34Mpc. The amplitude of the genus curve is measured with 4% uncertainty. Small distortions in the genus curve expected from non-linear biasing and gravitational effects are well explained (to about 1- accuracy) by -body simulations using a subhalo-finding technique to locate LRGs. This suggests the formation of LRGs is a clean problem that can be modeled well without any free fitting parameters. This bodes well for using LRGs to measure the characteristic scales such as the baryon oscillation scale in future deep redshift surveys.
Subject headings:
large-scale structure of universe – cosmology: observations – methods: numerical1. Introduction
Topology of large-scale structure in the universe has been studied over the years through analyses of large-scale distribution of galaxies in three dimensions. The genus statistic was used to characterize the topology (Gott, Melott, & Dickinson 1986; Hamilton, Gott, & Weinberg 1986; Gott, Weinberg, & Melott 1987; Gott, et. al. 1989; Vogeley, et. al. 1994; Park, Kim, & Gott 2005; Park et. al. 2005). Measuring the genus as a function of density (Gott et al. 1986, 1987) allows us to compare the topology observed with that expected for Gaussian random phase initial conditions, as predicted in a standard big bang inflationary model (Guth 1981; Linde 1983) where structure originates from random quantum fluctuations in the early universe.
At large scales where fluctuations are still in the linear regime, growing in place without changing topology, topology at the median density level is expected to be sponge-like (Gott et al. 1986, 1987). Small deviations from the random phase curve give important information about biased galaxy formation and non-linear gravitational clustering as shown by perturbation theories and large -body simulations (Matsubara 1994; Park, et al. 2005). Previous models of galaxy clustering suggested either a meatball topology, isolated clusters growing in a low density connected background (Press & Schechter 1974; Soneira & Peebles 1978), or a Swiss cheese topology, isolated voids surrounded on all sides by walls (Einasto, Joeveer, & Saar 1980). But studies of many observational samples have shown in every case a sponge-like median density contour as expected from inflation (Gott et al. 1986, 1989, 2008; Moore et al. 1992; Vogeley et al. 1994; Canaveses et al. 1998; Hikage et al. 2002, 2003; Park et al. 2005).
We have previously measured the 3D topology of the nearby Main galaxies (Strauss et al. 2001) of the Sloan Digital Sky Survey (York et al. 2000; Stoughton et al. 2002; Gunn et al. 2006) data at smoothing lengths ranging from 3.5 to 11 Mpc (see Park et al. 2005 for details). The overall agreement with the best-fit Gaussian random phase genus curve and the mock surveys in a CDM is remarkable, strongly supporting the predictions of inflation. Small deviations from the Gaussian random phase distribution are expected because of non-linear gravitational evolution and biased galaxy formation, and these can now be observed with sufficient accuracy to do model testing of galaxy formation scenarios. In this paper we will analyze the 3D distribution of the luminous red galaxys (LRGs; Eisenstein et al. 2001) observed by the SDSS to study the genus topology at very large scales. The results will be compared with those from the nearby galaxies and with those from N-body simulations of the inflation-based CDM universe.
2. Luminous Red Galaxies
The LRG galaxies in the SDSS have already proven useful in refining cosmological parameters (Tegmark et al. 2006). Measuring the genus topology of the LRGs is of particular importance because it allows us to observe topology on the largest scales, and because the LRGs are expected to play an important role in characterizing dark energy, i.e. through the ratio of dark energy pressure to energy density (cf. Bessett et al. 2005; Eisenstein et al. 2005; and Perceival et al. 2007 for a review).
We use the LRG sample from the SDSS. The sky coverage of the sample is similar to that of SDSS data Release 5 (Adelman-McCarthy et al. 2006). The angular selection function is based on the spherical polygon description of LSS-DR4plus catalog (Blanton et al. 2003, 2005). To maximize the volume-to-surface ratio we trim the DR4plus sample (see Figure 1 and the text of Park et al. [2007]). These cuts leave 68,203 LRGs over about deg2 in the survey region.
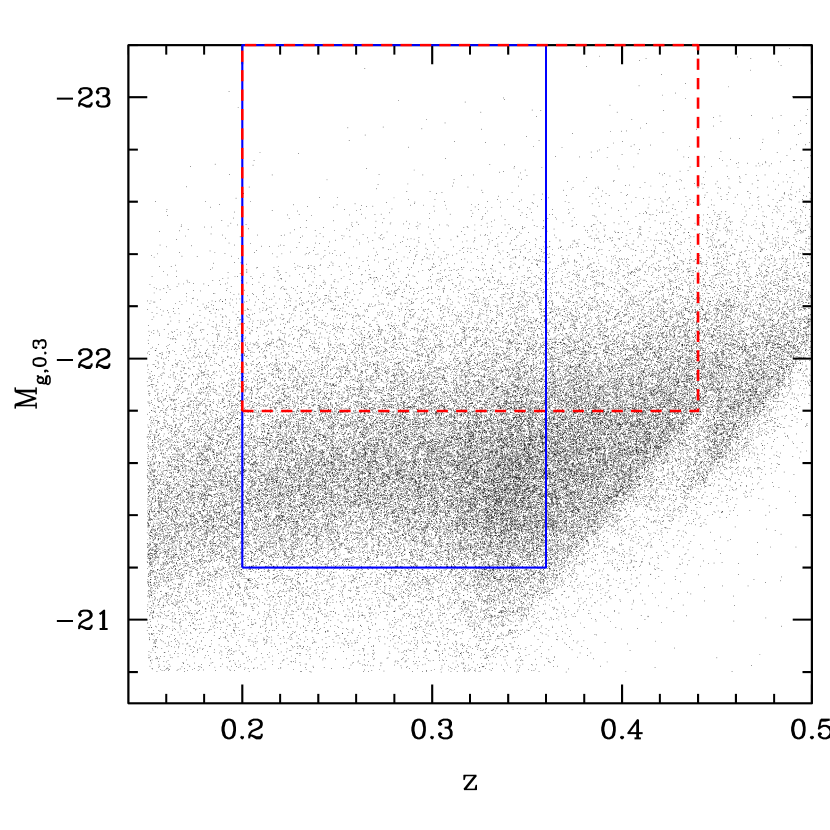
We constructed two volume-limited subsamples of LRGs in passively evolved luminosity and redshift ranges. The subsamples are with , and with , where we have applied -corrections and passively evolved the galaxies to a fiducial redshift of 0.3. We label them “SHALLOW”and “DEEP”, respectively. Both subsamples are selected to reduce the artifacts caused by the LRG selection cuts. The resulting comoving number density of LRGs are approximately constant. (see Zehavi et al. 2005 for details). The sample DEEP (SHALLOW) contains 32,067 (14,968) galaxies. The absolute magnitude and redshift limits of these samples are illustrated in Figure 1. We will measure the genus topology of the DEEP (SHALLOW) sample with a smoothing length of 21 (34) Mpc. The smoothing lengths chosen are large enough to avoid unwanted shot noise effects (c.f. Gott, Melott & Dickinson 1985)
3. -body simulation
We completed a particle Mpc size Cold Dark Matter Simulation adopting the WMAP 3-year parameters (Spergel et al. 2007); , and , where are the density parameters due to matter, cosmological constant, and baryon, respectively. is the slope of the power spectrum at large scales, and is the rms density fluctuation at Mpc scale. The simulation is run by a PM+Tree N-body code (Dubinski et al. 2004) and has a force resolution of 0.24 Mpc.
We identify the most massive dark matter subhalos as LRGs. The subhalos are the gravitationally bound halos not subject to tidal disruption (Kim & Park 2006), and having more than 30 member particles. To compare with the observational data we saved the particle positions and velocities along the past light cone of 12 well-separated observers who are making mock SDSS DR4plus LRG surveys. The subhalos are found on the past light cone surface. The minimum halo masses matching the observed number densities of the SHALLOW and DEEP LRG samples are found as a function of redshift and applied to the subhalos data on the past line cone when mock surveys are made. In each mock survey we pick the most massive subhalos when the mean number density of the LRGs is matched. At small non-linear scales the genus depends sensitively on the method by which galaxies are identified within the simulation. Park et al. (2005a) and Gott et al. (2008) have extensive studies on this question.
4. The Genus and Related Statistics
To measure the genus we smooth the LRG number density distribution with a Gaussian smoothing ball of radius . To remove the small radial variation of LRG number density in our samples, we divide the density by the radial selection function in the Appendix of Zehavi et al. (2005). Then the iso-density contour surfaces of the smoothed galaxy density distribution are searched to calculate the genus. The contour surfaces are labeled by , which is related with the volume fraction on the high density side of the density contour surface by
| (1) |
The contour corresponds to the median volume fraction contour (). For Gaussian random phase initial conditions the genus curve is:
| (2) |
where the amplitude and is the average value of in the smooth power spectrum (Hamilton, Gott, & Weinberg 1986; Doroshkevich 1970)
The shape of the genus curve can be parameterized by several variables. First, there is the amplitude of the genus curve as measured by fitting the amplitude of the best fitting Gaussian random phase curve from Equation 2. This gives information about the power spectrum and phase correlation of the density fluctuation. Deviations of the genus curve from the theoretical random phase case can be quantified by the following three variables:
| (3) |
| (4) |
where is the genus of the best-fit random phase curve (Eq. 2). Thus measures any shift in the central portion of the genus curve. The Gaussian curve (Eq. 2) has . A negative value of is called a “meatball shift” caused by a greater prominence of isolated connected high-density structures which push the genus curve to the left. () measure the observed number of voids (clusters) relative to those expected from the best-fitting Gaussian curve.
5. Results
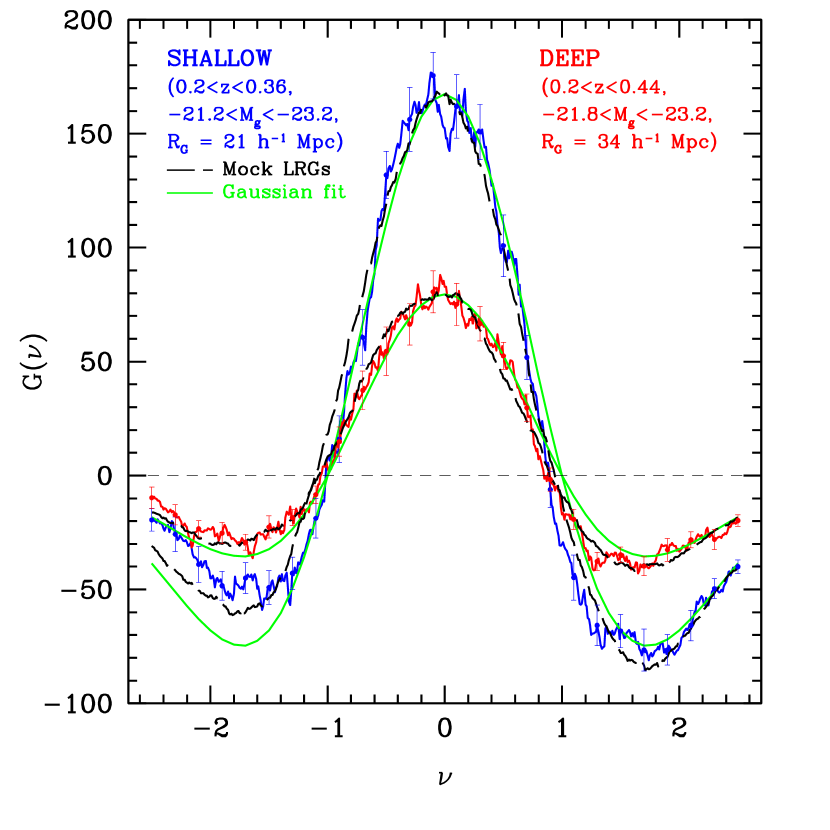
We have measured the 3D genus topology of the LRGs in the SHALLOW and DEEP samples with the smoothing lengths described above. The genus curves are shown in Figure 2. The maximum value of the genus curve reaches about 170, and the amplitude is measured with only 4% error at Mpc scale. This compares with the previously smallest error of 9.4% at 5 Mpc scale for the genus obtained from the Main Galaxy Sample of the SDSS (Park et al. 2005). The data for each sample is shown as the jagged line. Each genus curve is compared with the best-fit Gaussian random phase curve from Equation 2 (smooth solid lines). The observational data agree well with the Gaussian curves, but there are small differences between them due to the non-linear biasing and gravitational effects (Park et al. 2005).
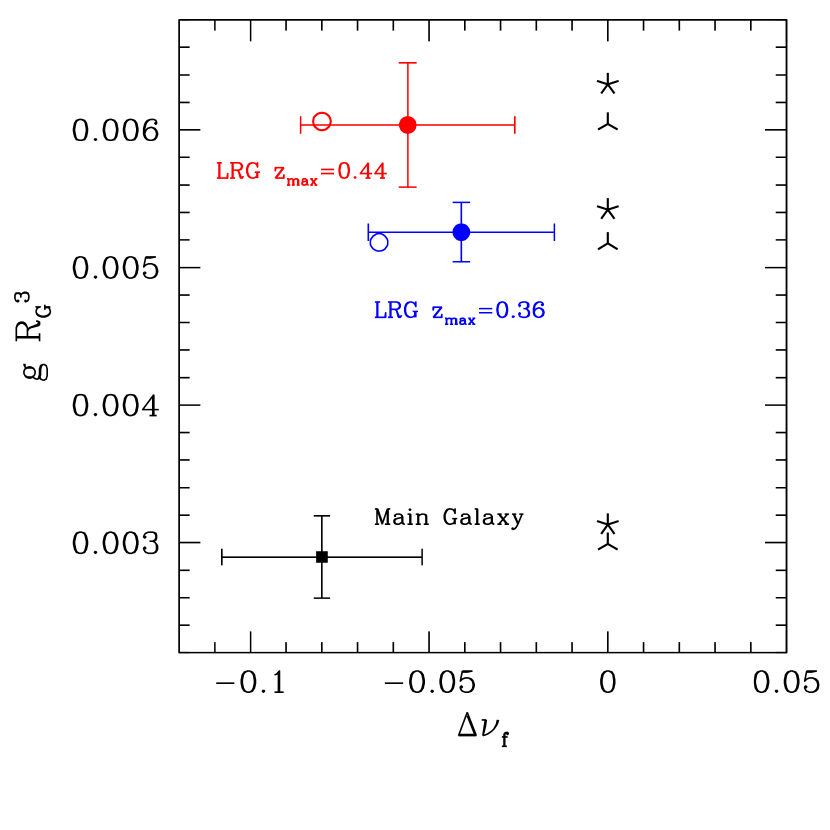
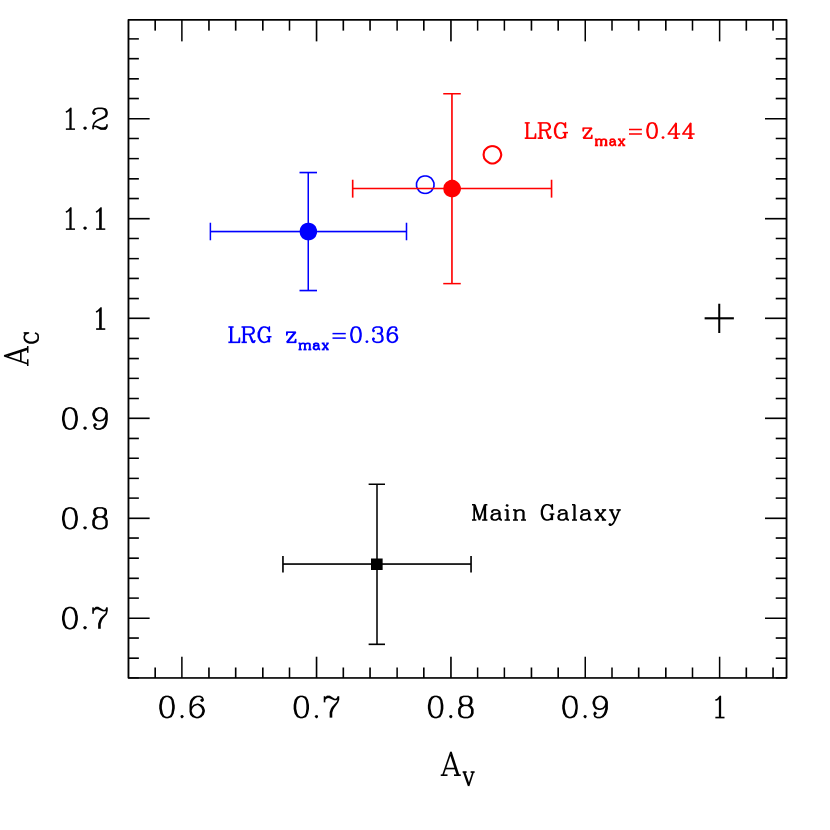
The dashed lines show the mean of 12 mock SDSS Surveys constructed from our particle simulation. Although our two volume-limited samples contain galaxies typically with different absolute magnitude and redshift, the genus curves measured from them show a very good overall agreement. Moreover, there is a remarkable agreement between observations and the mock surveys. The number of voids (the depth of the valley at ), is less than the number of clusters (the depth of the valley at ). The phenomenon that clusters outnumber voids is reproduced by the simulations extremely well. The amplitude of the genus curve agrees well between observations and simulations, showing that the non-linear power spectrum and degree of phase correlation of the LRG distribution smoothed at Mpc and 34Mpc are also modeled well. The small deviations of the genus curves from the Gaussian cases are quantified by our distortion parameters , , and . These statistics for the observed LRG distribution are within approximately 1 of those expected from the 12 mock catalogs as shown in Figures 3 and 4.
| Name | Magnitude | Redshift | s | Amplitude | |||||
|---|---|---|---|---|---|---|---|---|---|
| SHALLOW | 22.1 | 21 | 7 | ||||||
| DEEP | 35.0 | 34 | 11 |
Note. — Cols. (1) Name of samples, (2) Rest-frame -band absolute magnitudes, (3) Redshift, (4) Mean separation of galaxies in units of , (5) Smoothing length in units of Mpc, (6) pixel scale in units of Mpc, (7) The amplitude of the observed genus curve, (8) The shift parameter, (9) and (10) are the cluster and void abundance parameters, respectively. Uncertainty limits are estimated from mock surveys in redshift space.
In Figure 3 the predictions for random phase curve (Eq. 2) are shown by stars with three and five legs for the cosmological parameters estimated from WMAP 3-year (Spergel et al. 2007) and 5-year maps only (Dunkley et al. 2008), respectively. In Figure 4 the random phase curve is indicated by a point where and . The mock catalogs are indicated by open circles. The observational data are indicated by filled circles with 1 error bars showing the variation from mock survey to mock survey. Importantly, there is no free fitting parameter here for any of these quantities. So it is noteworthy that in and the data are within about of the predicted values. The statistic showing the maximum difference between observation and simulation is ; the observed voids are somewhat larger and fewer relative to those found in mock SDSS LRG surveys.
This suggests that finding the objects corresponding to LRGs is a relatively clean problem. Our genus topology study shows that -body simulation together with identification of LRGs with the most massive dark subhalos can produce robust results in very good agreement with the observational data. Our results here show that the CDM model we adopted in the -body simulation is a close approximation of the real universe. The results also suggest that it will be possible to model well the formation of LRGs in the future Sloan III survey by using large -body simulations to check and correct for any small systematic effects due to non-linear gravitational effects and biasing without needing free fitting parameters.
6. CONCLUSIONS
We measured the 3D genus topology of large scale structure using the LRG galaxies in the Sloan Survey. The amplitude of the genus curve is now measured within about 4% error at 21 Mpc smoothing scale. The results are consistent with the predictions of the CDM model with WMAP cosmological parameters, and with Gaussian random phase initial conditions expected from standard inflation. The topology is sponge-like. Small distortions from the random phase curve expected from non-linear gravitational effects and biasing are observed. These are modeled well (at the level) by -body simulations that pick the largest gravitationally bound halos not subject to tidal disruption as the sites for LRG galaxies to form. The data on topology, including the number of voids and clusters, the location of the peak in the genus curve and its amplitude are all fit well without any free fitting parameters. Thus, the formation of LRGs appears to be a relatively clean problem that can be modeled well using cold dark matter and gravity alone, and this bodes well for using -body simulations to calibrate measurement of baryon oscillations using LRGs.
References
- (1) Adelman-McCarthy, J. K., et al. 2006, ApJS, 162, 38
- (2) Blanton, M. R., et al. 2005, ApJ, 129, 2562
- (3) Blanton, M. R., Lin, H., Lupton, R. H., Maley, F. M., Young, N., Zehavi, I., and Loveday, J. 2003, AJ, 125, 2276
- (4) Canaveses, A., et al. 1998, MNRAS, 297, 777
- (5) Doroshkevich, G. 1970, Astrophysika, 6, 320
- (6) Dubinski, J., Kim, J., Park, C., & Humble, R. 2004, New Astronomy, 9, 111
- (7) Dunkley, K., et al. 2008, arXiv:0803.0586
- (8) Einasto, J., Joeveer, M., & Saar, E. 1980, MNRAS, 193, 353
- (9) Eisenstein, D. J., et al. 2005, ApJ, 633, 560
- (10) Eisenstein, D. J., et al. 2001, AJ, 122, 2267
- (11) Gott, J. R., Melott, A. L., & Dickinson, M. 1986, ApJ, 306, 341
- (12) Gott, J. R., Weinberg, D. N., & Melott, A. L. 1987, ApJ, 319, 1
- (13) Gott, J. R., et al. 1989, ApJ, 340, 625
- (14) Gott, J. R., Hambrick, D. C., Vogeley, M. S., Kim, J., Park, C., Choi, Y.-Y., Cen, R., Ostriker, J. P., & Nagamine, K., 2008, ApJ, 675, 16
- (15) Gunn, J. E., et al. 2006, AJ, 131, 2332
- (16) Guth, A. H. 1981, Phys. Rev. D., 23, 347
- (17) Hamilton, A. J. S., Gott, J. R., & Weinberg, D. W. 1986, ApJ, 309, 1
- (18) Hikage, C., Suto, Y., Kayo, I., Taruya, A., Matsubara, T., Vogeley, M. S., Hoyle, F., Gott, J. R., Brinkmann, J., & the SDSS Collaboration 2002, PASJ, 54, 707
- (19) Hikage, C., Schmalzing, J., Buchert, T., Suto, Y., Kayo, I., Taruya, A., Vogeley, M. S., Hoyle, F., Gott, J. R., & Brinkmann, J. 2003, PASJ, 55, 911
- (20) Kim, J., & Park, C. 2006, ApJ, 639, 600
- (21) Linde, A. D. 1983, Ph.L.B., 129, 177
- (22) Matsubara, T. 1994, ApJ, 434, L43
- (23) Moore, B., et al. 1992, MNRAS, 256, 477
- (24) Park, C., Kim, J., & Gott, J. R. 2005, ApJ, 633, 1
- (25) Park, C., Choi, Y.-Y., Vogeley, M. S., Gott, J. R., Kim, J., Hikage, C., Matsubara, T., Park, M. G., Suto, Y., Weinberg, D. H., & the SDSS Collaboration 2005, ApJ, 633, 11
- (26) Park, C., Choi, Y.-Y., Vogeley, M. S., Gott, J. R., & Blanton, M. R. 2007, ApJ, 658, 898
- (27) Press, W. H. & Schechter, P. 1974, ApJ, 187, 425
- (28) Soneira, R. M. & Peebles, P. J. E. 1978, AJ, 83, 845
- (29) Spergel, D. N., et al. 2007, ApJS, 170, 377
- (30) Stoughton, C., et al. 2002, AJ, 123, 485
- (31) Strauss, M. A., et al. 2002, AJ, 124, 1810
- (32) Tegmark, M., et al. 2006, Phys. Rev. D.
- (33) Vogeley, M. S., Park, C., Geller, M. J., Huchra, J. P. & Gott, J. R. 1994, ApJ, 420, 525
- (34) York, D. G., et al. 2000, AJ, 120, 1579
- (35) Zehavi, I., et al. 2005, ApJ, 621, 22