Star Formation in the Orion Nebula I: Stellar Content
Abstract
The Orion Nebula is one of the most frequently observed nearby ( kiloparsec) star forming regions and, consequently, the subject of a large bibliography of observations and interpretation. The summary in this chapter is bounded spatially by the blister HII region, with sources beyond the central nebula that are part of the same dynamical clustering covered in other chapters in this book. Herein are discussed panchromatic observations of the massive OB stars, the general T Tauri population, the sub-stellar sources and variable stars within the Orion Nebula. First, a brief history of 400 years of observation of the Nebula is presented. As this history is marked clearly by revelations provided in each age of new technology, recent ultra-deep X-ray surveys and high resolution multi-epoch monitoring of massive binary systems and radio stars receive special attention in this review. Topics discussed include the kinematics, multiplicity, mass distribution, rotation, and circumstellar characteristics of the pre-main sequence population. Also treated in depth are historical and current constraints on the distance to the Orion Nebula Cluster; a long standing 10-20% uncertainty has only recently begun to converge on a value near parsecs. Complementing the current review of the stellar population is a companion chapter reviewing the molecular cloud, ionized HII region and the youngest protostellar sources.
Harvard-Smithsonian Center for Astrophysics
60 Garden Street, Cambridge, MA 02138, USA
Department of Astronomy and Astrophysics, Pennsylvania State University,
525 Davey Laboratory, University Park, PA 16802, USA
Department of Astronomy, California Institute of Technology,
Mail Code 105-24, Pasadena, CA 91125, USA
Max-Planck-Institut für Radioastronomie, Auf dem Hügel 69,
D–53121 Bonn, Germany
Universitäts-Sternwarte München, Scheinerstr. 1, D-81679 München, Germany
Introduction
An interesting hypothesis drawn from our knowledge about the Orion Nebula is that years ago it was invisible to the naked eye. The ionizing photons of the massive O and B type stars, whose projected arrangement yield the namesake Trapezium, had not yet burned away the layers of natal molecular gas out of which they had formed. While bright blue stars were visible along the Sword of Orion, having formed continually over the previous few million years, there were, on a scale perhaps much grander than the present, thousands of smaller stars hidden from view. In the relatively short interim a blister HII region created by a newborn K O type star expanded into the molecular cloud, uncovering a large portion of this embedded star clustering. Nonetheless, star formation continues vigorously in the remaining molecular cloud today.
Because of the richness of this star clustering and its relative proximity , the Orion Nebula is easily the most frequently observed nearby ( kpc) star forming region, providing an large bibliography of observations and interpretations111The introductory sketch of the recent history for the Orion Nebula is but one hypothesis taken from the breadth of observational and theoretical studies of the Nebula. A more complete summary of such models for this history are presented in a companion chapter (O’Dell et al).. Moreover, the properties of the Orion Nebula stars, e.g., their masses, evolutionary status, spatial and velocity distributions, outflows and circumstellar disk properties, all provide critical tests for theories of molecular cloud evolution and star formation.
Region Overview
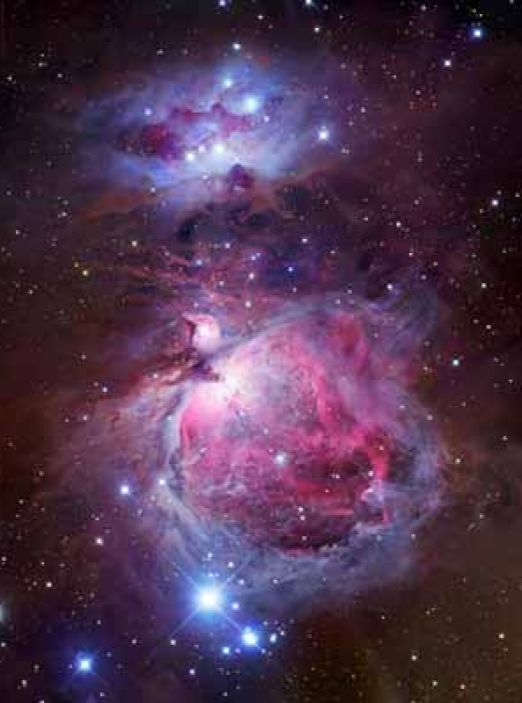
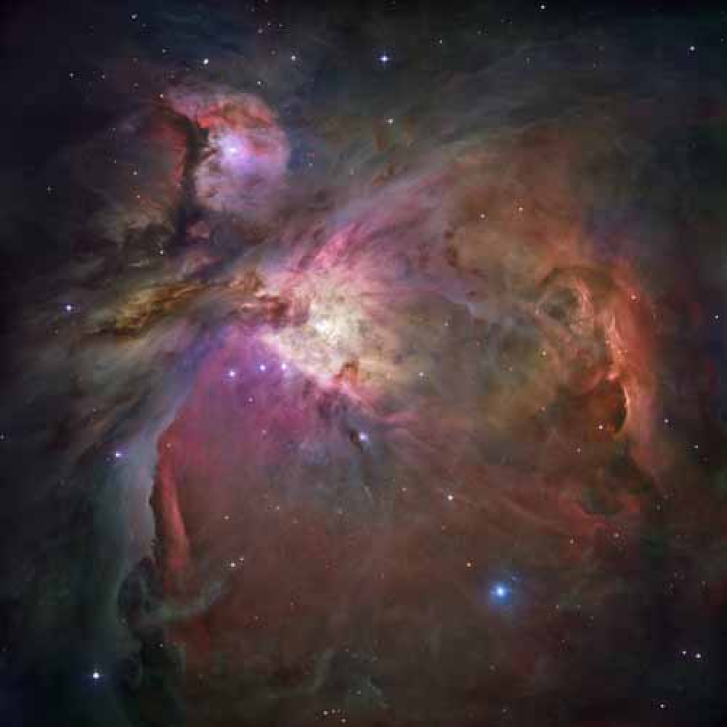
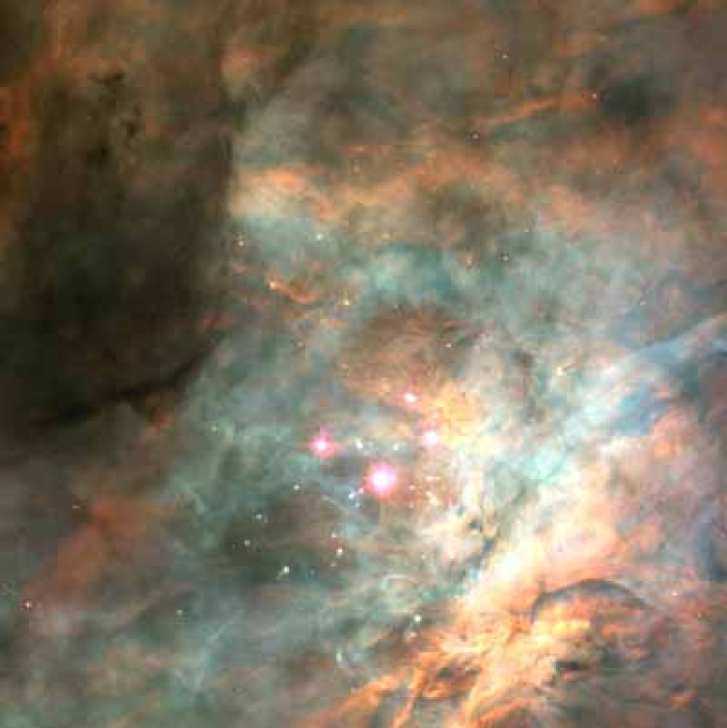
Inspecting a magnificent modern large scale visual image of the Orion Nebula (Figure 1) reveals the major physical features of this region. From North to South there are a series of bright emission nebulae, interspersed with dark bands and small clusterings of bright stars. The Orion Nebula HII region222Additional common catalog entries for this region include Messier 42, NGC 1976. is central to this image and appears to expand to the southwest from an apex at the location of the O and B stars. These apparent alternating nebulae and clusterings have led to a system of names or designations with boundaries that deserve some explanation.
| Adopted Name | Parenago | Blaauw | M & L | Walker | W & H | G & L |
|---|---|---|---|---|---|---|
| 1954 | 1964 | 1966 | 1969 | 1978 | 1998 | |
| Upper Sword | I | Orion Ic | Upper Sword | Group 1 | C1 | A? |
| NGC 1977 | II | Orion Ic | — | Group 2 | C2 | A |
| OMC 2/3 | III | Orion Ic | — | Group 3 | C3 | B |
| ONC | IV | Orion Id | — | Group 4 | D/D1 | C,D |
| Ori | V | Orion Ic | Ori | Group 5 | C4 | E |
As listed in Table 1 the stars along the Sword of Orion have traditionally been segregated into 4 or 5 regions; as shown in the tabulation the “names” for these regions have changed over time although no new divisions have been made since the 1950s. Subsequently, the numeral ordering (I,II,…) from Parenago (1954) is adopted and paired with more descriptive names, e.g., Region II corresponds to the NGC 1977 HII region.
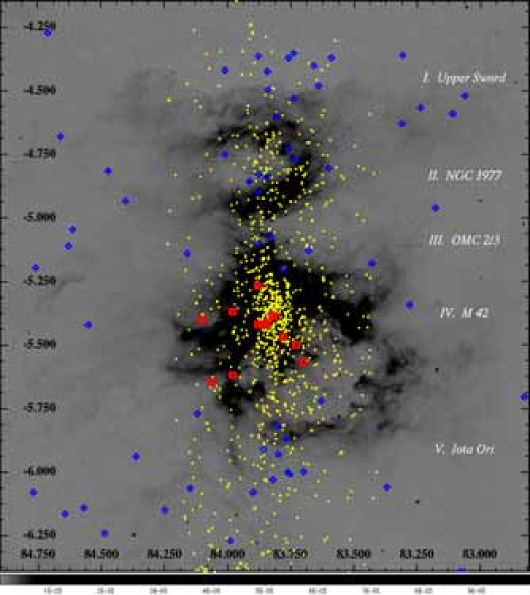
While at optical wavelengths these features seem apparent (and perhaps some such as NGC 1977 are significant) when one views the Sword of Orion at near-IR wavelengths , which are much less sensitive to variations in extinction, no boundaries are apparent between these regions. Figure 2 presents a map similar in extent to the previous optical image but where the Nebula is traced by mid-IR emission as observed by the Midcourse Space Experiment (MSX) (Kraemer et al. 2003). Infrared variable stars (Carpenter et al. 2001) extend across all these groups without clearly demarcating any of them except for the strong concentration of sources at the apex of the Orion Nebula. Another set of frequently used designations concern the OB stars of the Sword; Blaauw (1964) segregated the Sword OB stars in the Ic and Id associations, ordered in part by apparent youth, while Warren & Hesser (1978) expanded the Ic association on the sky but segregated the Sword OB stars into subregions (C1, C2, C3, C4), which are referred to in this review by the collective designation Ic*. While the Orion Id OB “members” coincide with the stellar density maximum in Figure 2, the spatial division of Ic* and Id members appears rather arbitrary.
Another naming system deserves clarification. The terms “Trapezium” cluster (Trumpler 1931), which refers to stars immediately surrounding the asterism that is the arrangement of 4 bright OB stars in the center of the Nebula, and “Orion Nebula Cluster (ONC),” which dates to Haro (1953), suggest perhaps that these are separate entities. This survey of the literature does not reveal any physical reason to suppose that the Trapezium stars represent anything distinct about star formation in the Nebula beyond their mass. While the study by Hillenbrand (1997) arbitrarily divided the region into three “radial zones:” Trapezium Cluster (r parsec); ONC (r parsec); Orion Ic association, only slight age gradients between them were found (see also Ramírez et al. 2004). It is therefore a secure inference that the entire region is a single contiguous star forming event that requires complete description.
Topical Scope of the Review
This chapter summarizes current knowledge regarding those stars which sit within and surround the Orion Nebula HII region. A review of the cold molecular cloud, the hot HII region and the characteristics of the very youngest stars is presented in a subsequent chapter (O’Dell et al.). Further outlying regions in Figure 2 e.g. to the North (OMC 2-3; NGC 1977, Upper Sword) and South (LDN 1641) of the Nebula are discussed in other chapters in this volume (i.e., Peterson & Megeath and Allen & Davis, respectively). The focus here is on those surveys that provide constraints on the physical properties of the revealed high mass, T Tauri and substellar objects.
The review is organized as follows. First, a brief history of important or previously broad reviews of research on the Orion Nebula is presented (Sect. 1.), followed by an overview of distance determinations to the Nebula in the past 70 years (Sect. 2.). Individual sections are reserved for reviewing the T Tauri members with a focus on summarizing the many broadband CCD and spectroscopic studies that have occurred during the past two decades (Sect. 3.), the O and B type members of the Nebula with detailed reviews of each of the Trapezium stars (Sect. 4.), and the variable stars (Sect. 5.).
1. History of Study of the Orion Nebula
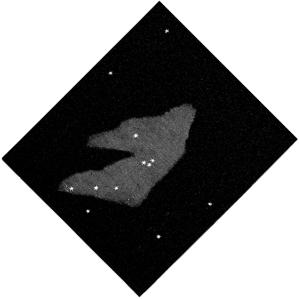
During the fifty years after the development of the telescope in 1608 the nebular nature and stellar content of Orion Nebula were independently discovered by a handful of observers. The observing logs of Nicolas-Claude Fabri de Peiresc (1610) and of Johann Baptist Cysat (at the latest 1618) (Wolf 1854; Holden 1882) represent the earliest written records that the Sword of Orion contained a “fog” or “milky nebulosity,” which here borrows the words used by W. Herschel (1802) to describe the region. The first hand drawn charts of the region include those of Galileo (1617), who did not distinguish the Nebula, of Giovanni Battista Hodierna (drawn sometime before 1654), who did, and the more famous 1656 drawing by Huyghens, which is the most widely known. His accurate rendition of the central nebula surrounding the Trapezium provides an origin for the term “Huyghenian region” (Figure 3).
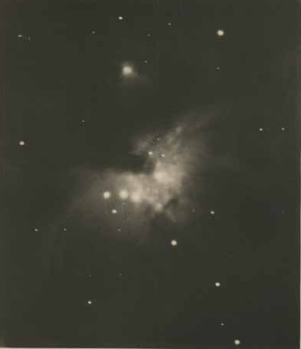
A nearly complete journal of 273 years of telescope aided visual observation of the Nebula is provided in Edward S. Holden’s The Monograph of the Central Parts of the Nebula of Orion (1882). Holden’s monograph includes the reproduction of dozens of hand drawn sketches as well as observing logs each in their original language. Variation in the reproduction of the Nebula is remarkable. The first photographic plates of Orion made by Henry Draper between 1880 and 1882 were included as an addendum to Holden’s work as well as a discussion of the processes of obtaining these images. Figure 4 is a reproduction of that image and is captioned with Holden’s description.
The next years of photographic observation of the Nebula included quantitative studies of its variable stars, the discovery of a cluster of faint stars in the Nebula’s core, very broad censuses and an expansion in the role of the Nebula as a testbed for new observing techniques. Numerous variable star studies were performed using the Harvard Plates by H. Leavitt (published by Pickering) or confirmed by M. Applegate (published by Shapley). In the 1930s, deep red photographic plates revealed that the Nebula contained a substantial cluster of fainter stars in addition to the brightest members (Trumpler 1931; Baade & Minkowski 1937). The broad surveys of Brun (1935) and Parenago (1954a) provided excellent photographic updates to the Bond (1867) visual census of stars in the Nebula.
Parenago, a Russian astronomer, published a major, lengthy analysis of the region in 1954. A translation of sections of this publication was undertaken for this review and it indicates that he relied on prior and concurrent work of female Russian astronomers (e.g., Barkahatova, Uranova, Kirillova) some of whose names do not reappear in the literature outside of his book. His analysis extended to the topics of parallax, proper motions, astrometry and photometry, covering all of the Sword of Orion. Most important he found a clear evidence for a “cloud” of members lying above the main sequence. Perhaps because of the Cold War and the lack of translations from his work from Russian to other languages, his work is extremely poorly cited in the literature. The disparaging of his work by Walker (1956) was not unnoticed by the author as revealed in the posthumous publication, Parenago & Sharov (1961). Nevertheless, this work was not considered seriously in most subsequent studies, not appearing, for example, in the otherwise meticulous study by Goudis (see below). Even today this significant work has garnered a mere 59 citations333Derived via the NASA Astrophysical Data Service circa May 2008 by merging the results of citations to Parenago (1954a) and Parenago (1954b).. His valuable data tables were converted to machine readable formats by Malkov (1992) and ingested into an electronic format in 1997 (Parenago 1997).
In 1982, approximately one hundred years after the Holden monograph and the first photographic images by Draper, two useful summarizing publications appeared. C. Goudis’s The Orion Complex: A Case Study of Interstellar Matter, focused on the structure and nature of the Nebula itself, details previous approaches to studying the Nebula and its content, including infrared, radio and spectroscopy, and provides useful tables of past observations and results. Second, a conference was held on the Orion Nebula and honoring Henry Draper (Glassgold et al. 1982); the conference proceedings include 32 articles on all current aspects of study of the Nebula and records of the participants discussion about each contribution. In addition there are a number of articles that provide a history, more detailed than that of Holden, about Draper’s photographic work obtaining these images of the Nebula as well as his subsequent scientific legacy after his death in late 1882.
Reviews of the literature over the subsequent years of CCD observations of the Nebula include Genzel & Stutzki (1989) and O’Dell (2001). The Nebula was also included in a review that encompassed all of the Orion star forming region by Brand & Wouterloot (1991). Its recent study has also been the focus of a book, O’Dell (2003).
| Author Name | Year of | Region | Distance | Error | Stellar | Method | Data | Number |
|---|---|---|---|---|---|---|---|---|
| Pub. | Desig. | Modulus | Types | of Stars | ||||
| Pickering | 1917 | Id+Ic* | 11.5 | B3 | ZAMS | pg | ? | |
| Kapteyn | 1918\al@1918ApJ….47..104K,1918ApJ….47..146K,1918ApJ….47..255K; \al@1918ApJ….47..104K,1918ApJ….47..146K,1918ApJ….47..255K; \al@1918ApJ….47..104K,1918ApJ….47..146K,1918ApJ….47..255K | Ic | 6.34 | B | PM | pg | ? | |
| Pickering | 1919 | Id+Ic* | 8.5 | B3 | ZAMS | pg | ? | |
| Pannekoek | 1929 | all | 7.6 | B | ZAMS | pg | ? | |
| Trumpler | 1931 | Id | 8.5 | O9-A2 | ZAMS | pg | 17 | |
| Minkowski | 1946 | Id | 7.38 | O7-B1 | ZAMS | pg | 3 | |
| Markowitz | 1949 | Id | 8.58 | 0.35 | B1-B3 | ZAMS | pg | 17 |
| Sharpless | 1952,4 | Id+Ic | 8.5 | 0.30 | B Stars | ZAMS | pe | 190 |
| 1952 | Id | 8.6 | 0.30 | B Stars | ZAMS | ? | ||
| Parenago | 1954 | Id | 8.0 | ZAMS | pg | ? | ||
| Johnson & Hiltner | 1956 | Id | 8.0 | B8-A0 | ZAMS | ? | ||
| Strand | 1958 | Id | 8.6 | O6-K2? | PM / RV | plate | 20 | |
| Sharpless | 1962 | Id | 8.2 | B Stars | 180 | |||
| Borgman & Blaauw | 1964 | Id | 8.33 | 0.11 | ZAMS | 7-filter | 5 | |
| Johnson | 1965 | Id | 7.9 | PM / RV | 21 | |||
| Morgan & Lodén | 1966 | Ic* | 8.1 | ZAMS | ? | |||
| Lesh | 1968 | Ic* | 8.5 | 0.1 | ZAMS | 14 | ||
| Walker | 1969 | Id+Ic* | 8.37 | 0.05 | B2-B9 | ZAMS | 51 | |
| Penston | 1973 | Id | 7.8 | 0.15 | B stars | ZAMS | 15 | |
| Penston et al. | 1975 | Id | 8.1 | 0.13 | B stars | ZAMS | ? | |
| 1975 | Id | 7.71 | 0.21 | B stars | ZAMS | ? | ||
| 1975 | Id | 7.98 | 0.12 | B stars | ZAMS | ;SpT | ? | |
| Warren & Hesser | 1977 | Id | 8.42 | 0.53 | B stars | 6 | ||
| 1977 | Ic* | 8.16 | 0.49 | B stars | 44 | |||
| Mermilliod | 1981 | Id+Ic* | 8.20 | 0.15 | ZAMS? | ? | ||
| Genzel et al. | 1981 | K-L region | 8.41 | 0.40 | H20 masers | stat. parallax | VLBI | |
| Breger et al. | 1981 | Id+Ic | 8.0 | 0.5 | ZAMS | ? | ||
| Anthony-Twarog | 1982 | Ic | 7.87 | 0.09 | B stars | ZAMS | 41 | |
| 1982 | Id+Ic* | 8.19 | 0.10 | B stars | ZAMS | 15 | ||
| Wolff | 1990 | Ic | 7.7 | 0.50 | B Stars | ZAMS | co- | ? |
| 1990 | Id | 8.2 | 0.03 | B Stars | ZAMS | co- | 2 | |
| Brown et al. | 1994 | Ic | 8.0 | 0.49 | B Stars | ZAMS | 34 | |
| 1994 | Id | 7.9 | 0.25 | B Stars | ZAMS | 3 | ||
| 1994 | cloud | 8.1 | 0.48 | B Stars | Red. | |||
| Brown et al. | 1998 | Ic | 8.32 | 0.17 | B Stars | trig. parallax | Hipparcos | 34 |
| de Zeeuw et al. | 1999 | Ic | 8.52 | 0.25 | B Stars | trig. parallax | Hipparcos | 34 |
| Stassun et al. | 2004 | Ic* | 7.96 | 0.10 | ec. binary | Radius | - | 1 |
| Hernández et al. | 2005 | Ib+Ic | 8.23 | 0.08 | B5-F Stars | trig. parallax | Hipparcos | 121 |
| 2005 | Ib+Ic | 7.97 | 0.10 | B5-F Stars | ZAMS | /Hipparcos | 111 | |
| Wilson et al. | 2005 | Id+Ic | 8.34 | 0.32 | Stars | Red. | CO/Hipparcos | ? |
| Stassun et al. | 2006a | Ic* | 8.19 | 0.30 | ec. binary | Radius | - | 1 |
| Jeffries | 2007a | Id | 8.22 | 0.16 | G6-M2 | Various | 74 | |
| 2007a | Id | 7.97 | 0.17 | G6-M2 | Various | 34 | ||
| Kraus et al. | 2007 | Id | 8.19 | 0.06 | O | dyn. parallax | binary orbit | 1 |
| 2007 | Id | 7.94 | 0.06 | O | dyn. parallax | binary orbit | 1 | |
| Hirota et al. | 2007 | K-L region | 8.20 | 0.09 | H2O masers | trig. parallax | VERA | 1 |
| Sandstrom et al. | 2007 | Id | 7.95 | 0.13 | radio star | trig. parallax | VLBA | 1 |
| Menten et al. | 2007 | Id | 8.08 | 0.03 | radio stars | trig. parallax | VLBA | 4 |
| Mayne & Naylor | 2008 | Id | 7.96 | 0.06 | B1-A0 | MS Fitting | 20 |
2. Distance
Minkowski (1946) opens his re-analysis of the Trumpler (1931) derivation of the distance to Orion with a sentence still applicable today, “All published values of the distance of the Orion Nebula are open to some criticism.” At the time, the range in quoted distances was a factor of 10. While the spread in acceptable values has decreased over time, uncertainty in the distance to the stars in or near the Orion Nebula at the 10-15% level remains today.
The difficulty in estimating distances is due in part to the complex geometry and kinematics of the region as a whole, and in part to characteristics of the youthful member stars themselves. Several stellar subgroups were identified by Blaauw (1964), each covering several degrees on the sky. These groups, which appear to have different ages, overlap along the line of sight with a total depth of more than 100 pc. This renders membership boundaries and hence distances to the individual subgroups (as well as ages) difficult to distinguish. The molecular cloud containing the Orion Nebula Cluster (ONC) is behind most of the optically visible early type stars in the larger association. Depending on the sub-group within the association, the O and some of the B stars are slightly evolved from the ZAMS while the A and/or later stars may be still in the pre-ZAMS phase. Reddening is spatially variable and significant, especially towards the Nebula. Further, the vast majority of nebula stars are photometrically variable and have other signatures of circumstellar activity in their photometry and spectra.
Table 2 contains relevant distance determinations to the Orion Nebula Cluster and records, where possible, the method used to derive the distance and if error estimates were documented. Authors were found to have often included some mix of Id, Ic*, and Ic stars in their distance estimates; occasionally authors provided estimates derived for the outer parts of the Id association but applied to the inner region. Therefore Table 2 includes all Ic and Id distance estimates; because it is well established that Ic members experience less line of sight extinction than their Id counterparts it is secure to infer that Ic distances provide lower limits to the distance to the cluster.
Four basic methods provide most of the distance estimates to the Orion region: zero-age main sequence fitting or similar stellar evolutionary status methods that provide distance moduli, kinematic methods that assume a specific dynamical model for the cluster, parallax estimates, and reddening analyses. Most authors have used B stars as distance probes since they are bright (enabling good data to be obtained) and close to the ZAMS (enabling distance modulus determination). Below, each distance estimation method is discussed in turn, followed by a synopsis of the best current constraints on the ONC distance, and finally a survey of commonly cited references for the ONC distance that, in fact, do not contain actual analyses of the ONC distance.
2.1. Distances Based on Stellar Evolution
Assumption of Zero-Age Main Sequence Stars
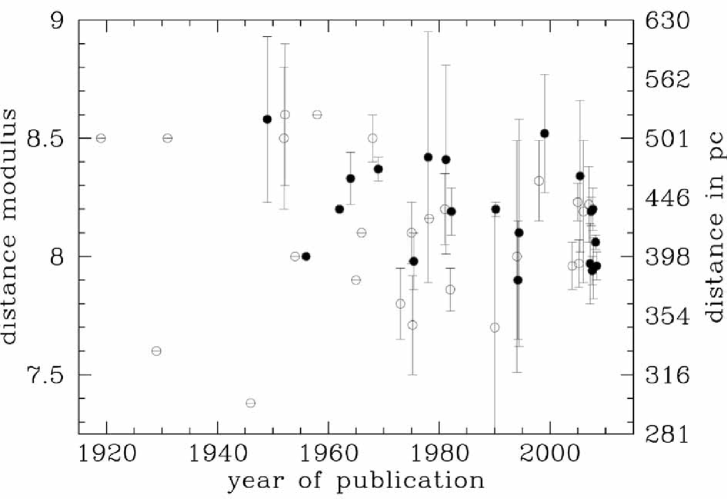
Spectroscopic parallax distance estimates involve comparison of (de-reddened) apparent magnitudes with absolute magnitudes, which are assumed based on stellar evolutionary status, to derive a distance modulus. Several early works (see Table 2) reported distances ranging from 185 to 2000 pc (falling off the range of distance versus publication year shown in Figure 6). In the first modern set of distance estimates to the Orion Nebula region, Trumpler derived a distance modulus (DM) of 8.5 magnitudes by comparing absolute magnitudes (from Trumpler 1930) along the main sequence with the de-reddened apparent magnitudes of B stars in the cluster.444The result of a second method based on the angular diameter of the cluster was also reported. He assumed the Orion cluster had a size typical of other open clusters. His method would be repeated by numerous authors in later studies, Minkowski re-calculated the total absorption towards the three brightest stars in the Trapezium, used a different absolute magnitude relation (that of Wilson 1940), and derived a much smaller distance modulus, 7.38 magnitudes. These first two modern distance estimates are the extremes in distance found in Table 2.
In later work, Markowitz (1949) similarly studied early B stars, used yet another absolute magnitude relation (that of Blaauw 1946), and found a distance modulus of 8.57. Sharpless (1952) performed the most extensive survey yet of early type stars throughout the entire Orion region with special focus on stars within a few degrees of the Trapezium. He found a distance modulus of 8.5 for the ensemble and a slightly further 8.6 for stars near the Nebula. Using the “Q-method” of photometric dereddening, rather than spectroscopy, and the Johnson & Morgan (1953) main sequence, Sharpless (1954) reported the same distance modulus of 8.5. Parenago (1954a) derived a distance modulus of 8.0 from his vast photographic catalog; he used A stars rather than the B stars typical of other authors.
Johnson & Hiltner (1956) recognized that some luminosity evolution away from a zero-age main sequence will occur between clusters of different ages and that this may be the case for the B stars in the ONC. Using a re-calibration of the Johnson & Morgan (1953) main sequence, they calculated a distance modulus of 8.0 by de-reddening the data of Sharpless (1954) for stars below the assumed upper MS turnoff. However, their assertion that A stars are on the main sequence rather than in the pre-main sequence phase of stellar evolution is likely not correct for the young Orion Nebula Cluster, leading to an underestimate of the distance. Sharpless (1962) used photoelectric data to revisit and revise the Sharpless (1952, 1954) distance downward to 8.2 magnitudes by considering the evidence for stellar evolution. Additional applications of traditional or zero-age main sequence fitting include Borgman & Blaauw (1964), Morgan & Lodén (1966), Lesh (1968), Walker (1969) and Penston (1973) – revised by Penston et al. (1975). Hernández et al. (2005) used Hipparcos photometry and the main sequence of Cox (2000). These authors contended with reddening in different ways and selected to varying extents samples free of binaries or variable stars.
Warren & Hesser (1978) first applied narrow band Strömgren photometry of B stars to the Orion distance problem, deriving a frequently cited distance to the Ori Id region of 435 pc, as well as distances to the other subgroups and newly defined sub-divisions of the subgroups. Anthony-Twarog (1982) revised the Warren & Hesser distance using the same data but a different calibration and different combinations of subgroups. In general, the Anthony-Twarog distance estimates are 40-80 pc closer those of Warren & Hesser. Wolff (1990) used and the Balmer discontinuity to determine , surface gravity and the absolute bolometric magnitude of B stars in Orion, also deriving distance estimates to all four subgroups in Orion.
Brown et al. (1994) used photometry and interpolated grids of Kurucz models to derive stellar parameters from which ZAMS fitting techniques could be applied. Distances to each OB association sub-group were derived and these results display a systematic 0.3 mag shift (closer) than those derived by Warren & Hesser (1978). More recently, Mayne & Naylor (2008) used the photometry and effective temperatures of Hillenbrand (1997), the Mathis (1990) extinction law, and Geneva-Bessell isochrones to derive 391 pc; this is closer than previous estimates using main sequence fitting techniques but consistent with contemporaneous distance estimates using other techniques.
In summary, distance estimates derived using assumed constraints on the evolutionary status of the Orion OB stars are widely scattered. The primary uncertainties arise from sample selection, reddening corrections, assumptions about the evolutionary state of the early type stars, and the adopted main sequence which can vary by several tenths of a magnitude between authors.
Stellar Rotation
A characteristic of young stars is their relatively rapid rotation, which is measured using time-series observations that track the periodicity of cool spots on a star’s surface or through spectroscopic measurement of the velocity broadening of absorption line features. Coupling these two observations yields a distance independent measure of a star’s radius convolved with the inclination of the star’s rotational axis on the sky. Comparing the radii derived from the cluster stars’ rotational properties to that derived from placing the stars on the HR diagram, one can derive the distance to the cluster if one assumes that as an ensemble the stars in a cluster have randomly oriented rotation axes the sky. This technique was first developed by Hendry et al. (1993) and has been applied to the Pleiades (O’Dell et al. 1994), and Taurus (Preibisch & Smith 1997). Jeffries (2007a) applied this method to the ONC, using the large database of periodic stars with measured rotational properties. The fact that the canonical distance (480 pc) to the ONC did not yield a randomized distribution was first shown by Rhode et al. (2001), who did not, however, estimate the amount that the cluster’s distance would have to decrease. Jeffries cataloged 74 young stars in the Nebula having all of the requisite observations and used them to derive a distance of pc. After showing that the accreting stars appear to have systematically underestimated luminosities (and thus a biased distribution), Jeffries derived a distance of pc using a subset of 32 non-accreting young stars in the Nebula.
2.2. Distances Based on Kinematics
Proper Motions
Kinematic distance estimates involve radial velocity and proper motion data combined with kinematic assumptions. In the simplest model of random motions, the distance is directly proportional to the ratio of the radial velocity and proper motion dispersions. More complex models such as expansion, contraction, or rotation can be employed as well. Strand (1958) derived the first distance to the ONC using this method. He combined proper motion data with only a few radial velocities and used an expansion model to estimate a distance of 520 pc to the ONC region. Johnson (1965) presented new radial velocities and used the Strand (1958) proper motions of the same stars to derive a smaller distance of 380 pc, assuming random motions. Finally, Walker (1983) presented new radial velocity data and computed both a radial velocity dispersion and a proper motion dispersion for the same stars from the data of Parenago (1954a) but did not carry the analysis through to a distance estimate.
The most frequently cited distance to the Orion Nebula Cluster comes not from study of stellar motions, but from proper motions and radial velocities of H2O masers in the Kleinmann-Low (K-L) nebula by Genzel et al. (1981). The K-L nebula is embedded in the Orion Molecular Cloud behind the Orion Nebula, though it is thought to be within 1 pc of the front edge of the cloud (e.g. Zuckerman 1973). Maser velocities were compared with a kinematic expansion model for the outflow to derive a distance of pc. That expansion model has undergone subsequent changes in its inferred orientation on the sky (Greenhill et al. 1998, 2004b) but the impact of these model changes on that distance estimate have not been quantified.
The primary uncertainties in these kinematic methods lie with sample selection, with assumptions of the kinematic models, e.g. random motion versus expansion, contraction, or rotation, and with their use over stellar groupings large enough to be considered unbound associations rather than bound clusters. The scatter in distances derived from kinematic methods is comparable to that in distances derived from zero-age main sequence fitting.
Double-line Eclipsing Binary Systems
Further distance estimates can be derived from kinematic analysis of double-line eclipsing binary systems, which provide empirically constrained values of the stellar radii. In the Orion Nebula plus Ic* association there are currently two such systems that have refined results. Stassun et al. (2004b) derived a distance of 419 21 pc (or 390 pc adopting a more conventional value for the bolometric magnitude of the Sun) for V1174 Ori, an M-type pre-main sequence solar analog system. Partly based on this distance and partly based on age arguments, these authors consider this star a member of Orion Ic*. A similar, remarkable analysis of the brown dwarf - brown dwarf eclipsing binary 2MASS J05352184-0546085 yielded a distance of parsecs (Stassun et al. 2006a); both stars are projected against the southern reaches of the Nebula. One systematic that is not constrained by the dynamics of these systems is the line of sight extinction; in these cases increasing the inferred line of sight extinction acts to move the star’s inferred distances to smaller values. Additional eclipsing binaries (Irwin et al. 2007; Cargile et al. 2008) will, eventually, lead to further fundamental distance constraints.
2.3. Direct Parallax Determinations
Hipparcos
Hipparcos trigonometric parallax distances to the individual Orion subgroups were first provided by Brown et al. (1998; unpublished preprint; see also discussion in Brown et al. 1999) who found that Orion Ia is 50-100 pc in front of the other associations (Orion Ib, Ic), consistent with the spectroscopic parallax analyses of Brown et al. (1994) and Warren & Hesser (1978). A distance of pc (DM = 8.32) was quoted for the Ic group, and cited as preliminary. The difficulties in interpreting Hipparcos parallax data in the Orion region of the sky include 1) mostly radial motion of both members and field stars due to location towards the solar antapex, which causes 2) significant membership biases, while 3) Orion is located close to the upper limit (500 pc) of Hipparcos sensitivities.
The Brown et al. (1998) results were revised by de Zeeuw et al. (1999) who also acknowledged the astrophysical difficulties of Orion and found a distance of pc (DM = 8.52) to the Ic group, using the same stars as Brown et al. (1998). Reasons for the different results for the Ia,b,c groups are not explained. Brown et al. (1999) restated the de Zeeuw et al. results but also noted them as preliminary.
Finally, Hernández et al. (2005) recalculated parallax distances to Orion subgroups using a revised B star membership list selected according to kinematic and color criteria and partially revised sub-group designations. These authors find a distance of 443 16 pc to the combined Orion Ib and Ic regions, in agreement with Brown et al. and de Zeeuw et al. within errors. However, the distances to these two subgroups are derived together rather than independently and so the implications for the distance to Orion Id is unclear.
The primary uncertainty with existing Hipparcos parallax estimates of the Orion distance is its limited precision at such a large distance combined with the astrophysical circumstances regarding Orion kinematics. Future missions should redress the first of these issues and possibly overcome the second.
Interferometric Observations of Radio Sources
Very long baseline radio interferometry provides the astrometric precision necessary to measure and separate the combined proper motion and parallax reflex motion for compact objects at a distance of 500 pc. Recent results have utilized the fact that the strong magnetic fields of pre-main sequence objects cause them to be excellent radio targets for parallax determinations (Sandstrom et al. 2007; Menten et al. 2007), while another group has derived the annual parallax of water masers in the Kleinmann-Low nebula (Hirota et al. 2007).
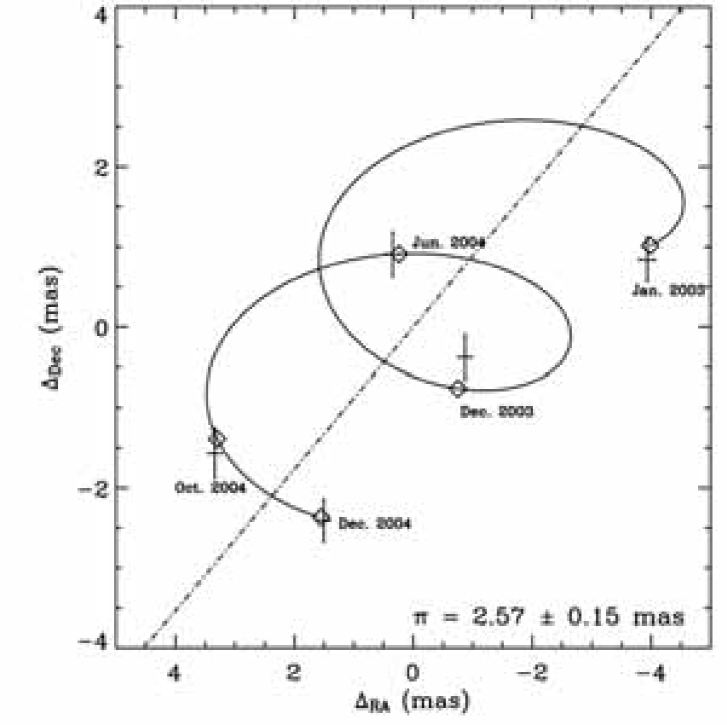
Four radio stars in the Orion Nebula have been used to derive distance estimates: GMR A, F, G and 12 (GMR: Garay et al. 1987). Sandstrom et al. (2007) used the star GMR-A, observed it with the Very Long Baseline Array (VLBA) during the 2003-2004 epoch and found a parallax of mas or a distance of pc (Figure 5). GMR-A is optically obscured by the molecular cloud associated with the Nebula, and should, thus, provide an upper limit on the distance to the Nebula. During the 2006-2007 epoch Menten et al. (2007) used the VLBA to measure the trigonometric parallax of GMR-A and three additionial variable non-thermal radio sources. They found a parallax of for GMR-A, and a joint solution for all four sources of . The precision of the source positions for such observations are affected by the time variability of the targets’ flux and the fact that these sources are sometimes resolved (i.e., not concurrently point sources, e.g., GMR-A). In addition these two VLBA studies used different calibration techniques.
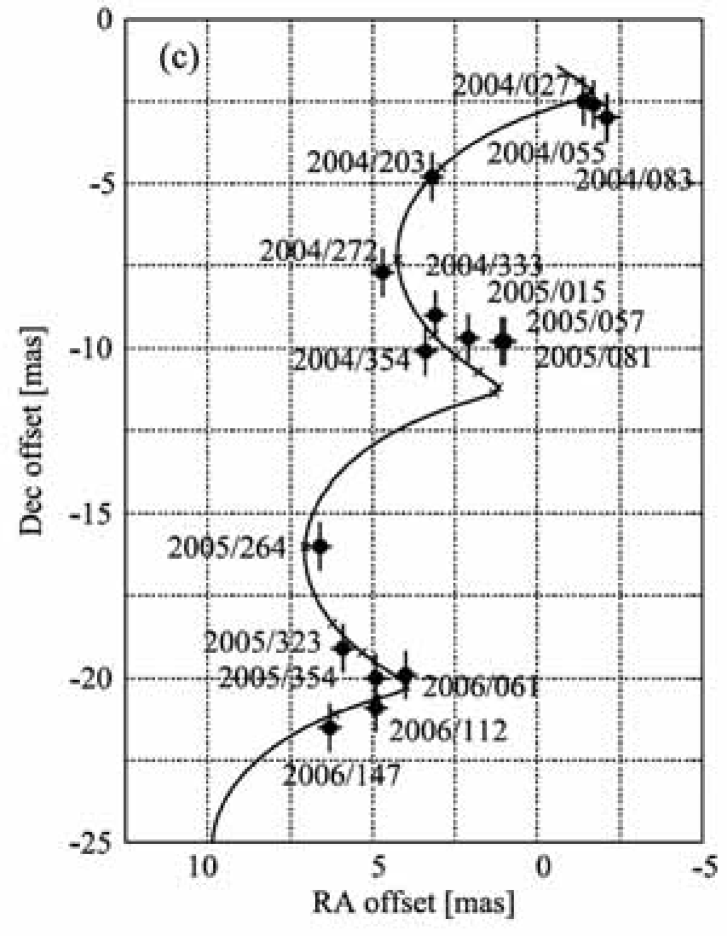
Hirota et al. (2007) observed water masers in the Orion K-L region during the 2004-2006 period using the VLBI Exploration of Radio Astrometry (VERA) system in Japan. Filtering the observed set of water masers based on signal-to-noise and on , they chose 1 maser spot for which they derived positions at 16 epochs during this 2 year period (Figure 5). They derive a parallax of for this maser spot, corresponding to a distance of . Their result does assume that the space velocity of the maser is constant and is not being accelerated in an outflow or disk. Similar to the issue for radio stars, resolvable variations in source structure could impact the precision of such distance determinations.
2.4. Distances Based on Reddening
Brown et al. also considered the results of their data in a traditional distance modulus plot to estimate a distance to the Orion A Molecular cloud. In a finding repeated by the work of Wilson et al. (2005), Brown et al. find that the near edge of the cloud begins to increase the measured values at a distance modulus of 32070 mag. From a comparison of emission from IRAS, Brown et al. find that the far edge of the cloud is at 50030 pc.
Wilson et al. (2005) report on the work of Wilson (2001) who studied the variation in color excess of the Hipparcos stars toward the Orion A cloud as a function of their Hipparcos distance. Finding the distance at which reddening increases substantially is interpreted as the distance to the cloud. These authors report an apparent distance gradient, ranging from the northern part of Orion A where the ONC is located to the southern filaments, which correlates with a gradient in cloud radial velocity.
2.5. Papers Often Cited Inappropriately as Distance References
This section addresses two issues: first the citation of distances to the ONC which have no traceable scientific source, and second the citation of papers in which no distance is quoted or in which the distance is taken directly from another source.
A variety of distances falling within the observed scatter in measured distances (Table 2) have been assumed in recent studies of the ONC. While perhaps valid as estimates guided by previous literature, it should be pointed out that there are no formal distance estimates which correspond to often quoted values such as 440 pc (DM = 8.22 as assumed by Herbig & Terndrup 1986), 450 pc (DM = 8.27, as asserted by Genzel & Stutzki 1989, seemingly an average of the Ic and Id distances from Warren & Hesser 1978), 470 pc (DM = 8.36 as cited by Genzel & Stutzki 1989, for the result of Genzel et al. 1981, though not what is quoted in the original paper).These distances appear to be either round number estimates of bona fide published values, ad hoc averages of some sub-set of published values, or unpublished revisions or restatements.
Often cited, but inappropriate, references for the distance to the ONC are the following. The original paper segregating the Orion associations Ia,b,c,d according to morphology, by Blaauw (1964), quotes a distance of 460 pc (distance modulus 8.3 mag) which is directly referenced to a work by Borgman & Blaauw (1964) making the Blaauw paper not an original source. Next, the well-cited comparison of open cluster color-magnitude diagrams and main sequences performed by Mermilliod (1981) provides a distance to Orion with no explicit sample, methodology, or error. In general distances in this work are from zero age main sequence fitting; Orion is placed into a group with NGC 6231 and NGC 2264 for this purpose. Finally, the extremely valuable proper motion study of Jones & Walker (1988) was not, however, a distance estimate to the Orion Nebula Cluster. These authors simply showed that the distance of Walker (1969) was consistent with the rejection of the number of foreground objects expected based on luminosity function analysis via the proper motions distribution; a similar analysis and conclusion was drawn by van Altena et al. (1988).
2.6. Final Distance Thoughts
As evidenced in Table 2, there is not only a large range in the distance estimates to the ONC region, but most measurements are accompanied by a large error bar, 15-20%. It is interesting to illustrate the scatter in measured distances to the ONC region by plotting the derived distance modulus and error as a function of time, as in Figure 6. Those distance estimates that are the most reliable (filled symbols) are distinguished from the others that either are not exclusively derived from Id members or use less robust techniques. A notable feature of this figure is that beyond 1950 the scatter in distance estimates is relatively unchanged in time. While there is a clear upper bound to the distance measurements at , there seems to be some emerging convergence at 400 pc from the many varied techniques used in recent years.
A problem that persists in more accurately separating the distance to the Orion Nebula Cluster from that to the Orion Ic* association is that the two subgroups are projected along the same line of sight, where the Ic* group is concentrated primarily along and parallel to the Orion A Molecular cloud, which contains the slightly younger ONC and Trapezium (See, for example, Figure 1). In general, there appears to be consistency in the relative distances between the Orion subgroups amongst those authors quoting values for various of the Ia, Ib, Ic, Id regions. Although the absolute distances have systematic offsets between authors and techniques, Orion Id is typically found to be the furthest.
Indeed, the Id and Ic* subgroups are so aligned that a review of the membership statistics from the Hillenbrand (1997), Rebull (2001), and Carpenter et al. (2001) wide-field studies of this region reveals no morphological signatures that can separate the two entities. Distributions of infrared excess stars are more or less continuous from the NGC 1977 HII region down to the NGC 1999 clustering south of the ONC. Sub-clustering as seen by eye, and in H surveys are probably the result of extinction rather than well segregated clusters. The only significant physical difference between the Ic* and more embedded stars appears to be differences in their typical ages. The ages of these subgroups are not included in this discussion, but the historical age estimates among the spatially defined subgroups do seem to distinguish themselves (e.g. Blaauw, Warren & Hesser, Brown et al.) with Id the youngest.
3. Characterizing the T Tauri Population
3.1. Optical to Infrared Imaging Surveys
Photographic and Photoelectric Surveys
There have been a significant number of photoelectric surveys published before the CCD era that include tables of source photometry that could have utility in variability studies. Table 3 was created for the purpose of documenting these sources of literature photometry. It is supplemented with details from a few very large photographic surveys, e.g., Andrews & Grossie (1981) with . Data from some papers, such as that data listed in Warren & Hesser (1977)’s primary table, are a merger of a very large number of published data sources (in that case 35 separate papers), and the references in these amalgamations are generally not reproduced here.
| Paper | Data | Epoch | Filters | |
|---|---|---|---|---|
| Parenago (1954a) | pg | 2982 | ||
| Sharpless (1952) | pe | 1951 | 190 | |
| Sharpless (1954) | pe | 1951 | 184 | |
| Johnson (1957) | pe | 1954-1955 | 49 | |
| Sharpless (1962) | pe | |||
| Kopylov & Straizys (1963) | pg | 1952? | ||
| Morgan & Lodén (1966) | pe | 36 | ||
| Lee (1968) | pe | 196 | ||
| Walker (1969) | pe | 1958-1967 | ||
| Penston (1973) | pe | 1970-1971 | 51 | |
| Penston et al. (1975) | pe | 1972-1973 | 48 | |
| McNamara (1976b) | pe | 51 | ||
| Warren & Hesser (1977) | pe | 526 | ||
| — | pe | 1968 | ||
| — | pe | 1972 | ||
| Shevchenko (1981) | pe | 1978-1979 | 117 | |
| Andrews & Grossie (1981) | pg | 1979 | ||
| Isobe & Sesaki (1982) | pg | 1970-1971 | 413 | |
| Rydgren & Vrba (1984) | pe | 1982-1983 | 41 |
H Surveys
Slitless optical grism surveys of young star forming regions can be valuable tools for identifying young stars (e.g. Herbig & Bell 1988). This is because young stars frequently show strong H line emission, which is related to their active chromospheres as well as circumstellar accretion; however, the very strong hydrogen line emission background of the Orion Nebula probably result in a significant underestimate of the true membership if based upon H statistics alone. Haro (1953) documented 255 H stars within a 3.5 degree region around the Trapezium while Parsamian & Chavira (1982) cataloged 534 H stars in a 5 degree region. The Kiso Orion surveys (Wiramihardja et al. 1989; Kogure et al. 1989; Wiramihardja et al. 1991, 1993; Nakano et al. 1995), while valuable for their coverage of most of the Orion constellation, appear to be very incomplete in the ONC as evidenced by the lack of a strong peak in the stellar density within the Nebula as found by the subsequent analysis of Gomez & Lada (1998); Jones & Walker (see also 1988). In their review of the Orion association, Brand & Wouterloot (1991) collated the existing H star catalogs into a single list, including 87 new stars from Wouterloot & Brand (1992).
Modern Optical Surveys
A review of modern optical CCD surveys of the Orion Nebula begins with the work of Herbig & Terndrup (1986). Their CCD observations were taken with the 40 inch Nickel telescope at Lick Observatory, had a pixel resolution of and consisted of a mosaic of small fields. The authors used narrowband interference filters to minimize nebular contamination but final photometry was reduced to and reported in the Johnson-Cousins system. Their Table 1 contains photometry for 98 of the 140 sources detected and uses the Parenago (1954a) number system except for 30 sources that are labeled “anonymous.” The authors used these new data to construct color-magnitude diagrams and explore the age and age spread for the cluster, finding most stars to be Myr or younger (Section 3.4.).
The first ONC photometry from the Hubble Space Telescope was published by Prosser et al. (1994). This survey consisted of 11 irregularly mosaicked Planetary Camera fields in the F547M and F875M filters. Their Table 4 contains aperture photometry for 326 objects, using an aperture beam of and converted into the passband system. Cross references from their “PC” identifier system to that of Jones & Walker (JW) and Parenago (P) are given. Unfortunately, they report their astrometry to be quite poor . The high resolution of these data provided excellent new statistics on visual binaries in the cluster, identifying 35 sub-arcsecond pairs (their Table 6). Additional HST observations were obtained, reduced and analyzed by Robberto et al. (2004). Their results include observations in the F336W, F439W filter passbands as well as data from archived F547M, F791W images. They tabulate the resulting data for 40 sources with spectral types from Hillenbrand (1997).
The comprehensive survey of the Orion Nebula Cluster by Hillenbrand (1997) included new photometry in addition to a large corpus of spectroscopy (Section 3.3.). Hillenbrand cataloged 1578 sources including 332 new detections with approximate completeness limits of and . Her tabulation was constructed from new data (3 epochs) and literature sources (7); photometry of sources appearing in multiple catalogs was chosen based on the angular resolution of the survey (e.g., the Prosser et al. HST results were given preference). Their numbering system is a merger of Jones & Walker (JW; #1-1053), Parenago (32 sources, e.g. Parenago 1891 = Hillenbrand 1891 = Ori C), Prosser et al. HST sources (9000+PC#) and new detections: 3000+N for epoch 1993 data, 5000+N for epoch 1995 data and 6000+N for epoch 1996 data. Most of the global stellar properties of the Orion Nebula members are derived from this comprehensive study.
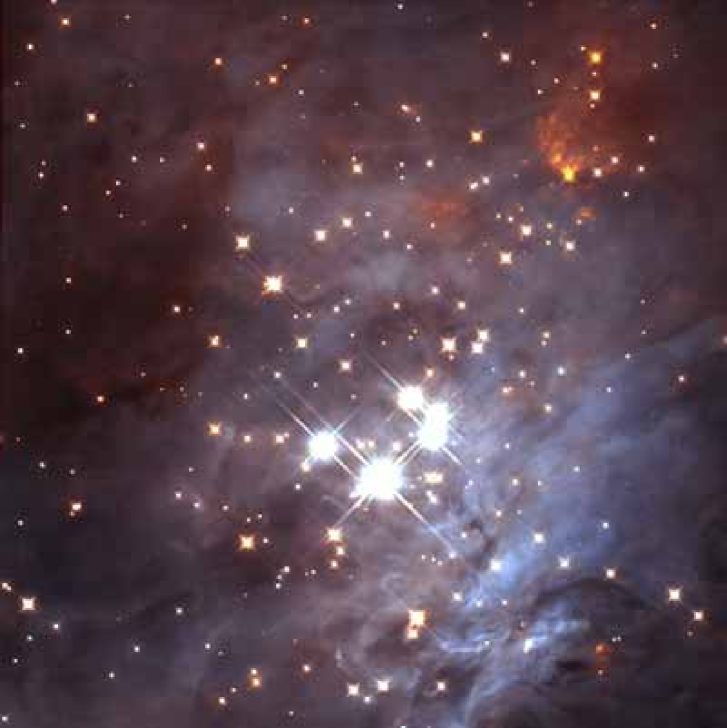
In addition to these published surveys modern telescope archives contain large quantities of publicly available optical data. The most significant of these is the 104 orbit Cycle 13 Hubble Space Telescope Treasury Program (PID 10246; PI. M. Robberto) that surveyed a region of the Orion Nebula with the Advanced Camera for Surveys (ACS). Observations took place between October 2004 and April 2005 and the surveyed filters included F435W, F555W, F658N, F775W and F850LP. Parallel observations were also obtained with the Wide-field Planetary Camera 2 (F336W, F439W, F656N, F814W) and NICMOS (NIC3: F110W, F160W); all these data can be obtained via the Multimission Archive at STScI. Figure 7 is from their ACS mosaic (Press release STScI-PR06-01). A similarly large set of ground-based optical data (PID 273.C-5042(A)) is publicly available from the ESO archive. It was observed during January 2005 with and filters (Da Rio et al., in preparation).
Optical Variability Surveys
Occasionally, multi-epoch variability surveys publish calibrated time-averaged photometry for their sources. Sources for such photometry in the Orion Nebula include Stassun et al. (1999) and Herbst et al. (2002). The former provides data for their 254 periodic stars in the passband while the latter provides narrowband photometry for 1562 objects time averaged over 45 days. The narrowband filter used by Herbst et al. was centered at 815.9 nm. In both cases the reported peak to peak variation of 0.2 magnitudes is probably a good measure of the typical uncertainty inherent in a single epoch optical survey of a young cluster. Note that Herbst et al. (2002) adopted the same numbering system of Hillenbrand (1997) in their Table 1, extending it to N10000. The optical photometry for variable and periodic stars surveyed in the outer ONC by Rebull et al. (2000) and Rebull (2001) is single epoch.
Rebull et al. (2000) and Rebull (2001) presented photometry of the “flanking fields” of the ONC. The Rebull flanking field surveys cover an area from degree from Ori C out to the limits of the Orion A cloud to the north (see chapter by Peterson & Megeath) and south of Ori and the OMC-4 clumps. The Tables 1 and 2 of Rebull et al. (2000) include a total of 4792 (1620) sources (candidate members) that were found in or near the locus of confirmed Orion sources on the optical color-magnitude diagram. A total of 1564 sources (726 candidate members) have valuable wide-field band data in Rebull et al. (2000).
Near-Infrared Data
Near-Infrared observations are necessary to explore embedded populations in young regions like the Orion Nebula and are sensitive to re-radiated thermal emission from circumstellar disks. Penston (1973) performed an optical+infrared survey of 51 Parenago stars over a region. These observations included the first and essentially only wide-field photometry for Orion Nebula members until the year 2000. Additional data for 35 stars were presented in Penston et al. (1975). Lonsdale et al. (1982) expanded the census of sources near the B-N object. Although they tabulate only sources within of the B-N object, larger maps including the Trapezium are referenced and shown, including a source map from Becklin et al. (1976), who surveyed at and but did not tabulate any point source photometry. Hyland et al. (1984) produced a non-chopped map that covered the entire OMC-1 molecular ridge (both B-N/K-L and OMC-1S) and tabulated 88 sources with cross-references to Lonsdale et al. and Parenago.
A crucial near-infrared survey of the Orion Nebula was performed by McCaughrean & Stauffer (1994). These authors obtained two complementary sets of data, covering a total of and centered on the Trapezium stars. The higher resolution tip-tilt corrected images had a final spatial resolution of and the authors quote an astrometric precision of . Their Table 1 lists 123 detections (48 new stars), including photometry even for the brightest OB stars and extending to a quoted completeness limit of . This tabulation is the origin of the “TCC” or Trapezium Cluster Catalog identifiers and provides cross-references of their near-IR data to the catalogs of Jones & Walker (1988), Parenago (1954a) and Prosser et al. (1994) sources, as well as a detailed and valuable cross-referencing of known VLA radio sources from Felli et al. (1993b), the proplyds (e.g., O’Dell & Wen 1994), H sources from Laques & Vidal (1979), mid-IR sources and structures from Hayward et al. (1994) and their Table 1 of optical/near-IR sources.
Subsequent near-IR surveys can be divided into those which covered very large areas of the Nebula and those that concentrated on the central around the Trapezium. Wider field surveys that provide large tabulations of near-IR photometry include Ali & Depoy (1995), Hillenbrand et al. (1998) (multi-epoch) and Carpenter et al. (2001) (time series). Concerns about questionable and probably nebular extractions should be applied to the results of almost any survey for sources against the bright, background Nebula. Hillenbrand et al. (1998) and Hillenbrand & Carpenter (2000) suggested a large percentage of false and duplicate detections in the Ali & Depoy data, while Hillenbrand & Carpenter also noted 1 or 2 nebular knots among the sources listed in the optical catalog of Hillenbrand (1997). Similarly, in a field centered on the Trapezium, Getman et al. (2005c) found 1145 sources in the 2MASS point-source catalog that lacked Chandra X-ray detections; however, only of these are good quality 2MASS detections; the rest lack detection in multiple bands and most are probably spurious. The catalog of Hillenbrand et al. (1998) avoids this problem because it tabulates near-IR photometry only for those 1578 optical sources listed in Hillenbrand (1997); this tabulation includes new bolometer and array observations supplemented by literature results. Similarly, the Carpenter et al. (2001) 2MASS near-infrared variability survey tabulates photometric results for those 1235 variables (out of 17,808 sources) found in a region. Variable stars in this catalog were typically observed 16 times over a 2 year period.
Narrow field, deeper surveys of the region immediately around the Trapezium have included the -only AO survey of Simon et al. (1999), the Keck survey by Hillenbrand & Carpenter (2000), the HST-NICMOS survey by Luhman et al. (2000), UKIRT observations by Lucas & Roche (2000), a multi-telescope survey by Muench et al. (2002) and a Gemini survey by Lucas et al. (2005). A comparison of the regions surveyed by most of these authors was given by Muench et al. (2002). Additional near-IR data are included in the COUP catalogs and include previously unpublished photometry derived by McCaughrean. As mentioned previously, archival NICMOS observations obtained in parallel to ACS imaging of the Nebula provide a non-contiguous but as yet unpublished data set for future use. Additionally, the CFHT archive contains a large WIRCAM/UKIRT data set of a large field surrounding the Orion Nebula.
Thermal and Mid-Infrared Data
Initial mid-IR scale maps were limited by a combination of the very strong nebular background and the poor angular resolution of early mid-IR cameras. Works by Ney & Allen (1969); Lemke et al. (1974); Fazio et al. (1974); Gehrz et al. (1975), which span the wavelength regime from , tell us little about the overall stellar content or properties of the members of the star cluster although they do reveal many details about the structure of the photodissociation region, e.g. the modern study by Kassis et al. (2006). Even today the flux from the Nebula overwhelms all but a few bright protostars and, for example, renders the inner of the Nebula saturated at with the Spitzer Space Telescope.
There is a multitude of mid-IR surveys (e.g., Rieke et al. 1973; Beichman et al. 1978; Lee et al. 1983; Wynn-Williams et al. 1984; Gezari et al. 1998; Shuping et al. 2004; Greenhill et al. 2004a) that have focused only on small embedded regions like the B-N/K-L. Full discussion of the stellar content of these embedded regions is reserved for a subsequent chapter (O’Dell et al.; Part II). The image of the Ney-Allen region (Ney et al. 1973) of the central Trapezium from McCaughrean & Gezari (1990) was the first modern mid-IR array observation, revealing many narrow arcs and details of the prominent structures in this region. Hayward et al. (1994) published 8.8 and SpectroCam (SC) images of the central region, including fluxes for 13 sources. Hayward (1994) present additional 10 and maps of the central Trapezium.
Thermal infrared data for sources in a region were analyzed by Lada et al. (2000), who used these data to estimate the disk fraction as a function of source mass and to identify a large sample of protostars throughout the OMC-1 cloud. The data tables used in that work were presented in Muench et al. (2002). Deeper, higher resolution data of sources in a smaller region were published by Lada et al. (2004); these data extended measurements of the disk fraction into the brown dwarf regime and provided new results on the protostellar population.
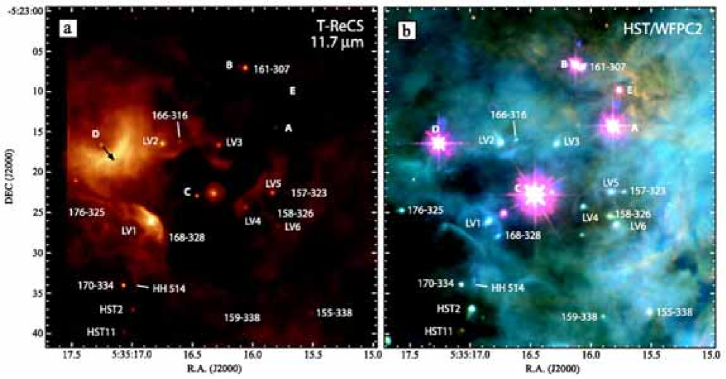
Recent longer wavelength observations with the spatial resolution necessary to detect individual sources against the bright background include Robberto et al. (2005) (10 & ; ; resolution; 177 sources) and Smith et al. (2005) (; ; resolution; 91 sources), see Figure 9. These works focused their study on the proplyds, jets and emission structures in the PDR, which are a focus of the following chapter (O’Dell et al., Part II). Publications that include Spitzer observations, which are much lower resolution than any of the ground based mid-IR observations, include Rebull et al. (2006) and Cieza & Baliber (2007); both of these works focused on the relationship between the rotational properties of the young stars and their disk excess properties (Sect. 3.6.).
3.2. X-ray Observations of the Nebula
The birth of stars takes place in thermodynamically cold and neutral media with characteristic energies of eV per particle. Paradoxically, those processes associated with star formation produce and are subject to violent high energy processes with characteristic energies of eV. The principal evidence for this is X-ray emission from stars throughout their pre-main sequence (PMS) evolution. The ONC was the first cluster of PMS stars to be detected in the X-ray band (Giacconi et al. 1972) and non-imaging studies soon found that the X-ray emission is extended on scales of a parsec or larger (Bradt & Kelley 1979). Early explanations for the Orion X-rays included winds from the massive Trapezium stars colliding with each other or the molecular cloud, and hot corona or magnetic activity in lower mass T Tauri stars. The (Ku & Chanan 1979), (Gagné et al. 1995) and (Yamauchi et al. 1996) imaging X-ray observatories established that both the massive Trapezium stars and many lower-mass T Tauri stars contribute to the X-ray emission.
The ONC was intensively studied during the first year of the mission with several instrumental setups: the Advanced CCD Imaging Spectrometer (ACIS) in imaging mode (Garmire et al. 2000; Feigelson et al. 2002a, b, 2003) and as detector for the High Energy Transmission Grating Spectrometer (Schulz et al. 2000, 2001, 2003a, 2003b), and with the High Resolution Imager (HRI; Flaccomio et al. 2003a, b). While many valuable results emerged from these early studies, it was recognized that more would be learned from a deeper and longer exposure of the Orion Nebula region. During the fourth year of its mission performed an unprecedented day (net exposure) nearly-continuous observation of the Orion Nebula, nicknamed the Chandra Orion Ultradeep Project (COUP).
Chandra Orion Ultradeep Project
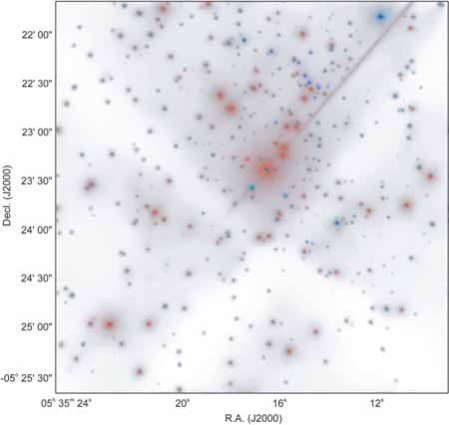
The COUP study detected more than 1600 X-ray sources, of which are young stellar objects (Getman et al. 2005c). Figure 10 shows a “true-color” X-ray image of the central Trapezium region centered on the larger field of -ACIS-I. Absorbed COUP sources appear blue and unabsorbed sources appear red. X-ray studies are particularly effective in uncovering heavily obscured low-mass cloud populations (X-rays penetrate up to hundreds of magnitude of absorption into the cloud) and in discriminating cloud PMS populations from unrelated older stars (X-ray emission from PMS stars is times elevated above main sequence (MS) levels). Most of the non-PMS contaminants in the COUP field are extragalactic active galactic nuclei (AGNs), which can be confused with non-flaring YSOs. (Only 16 probable field stars with discrepant proper motions and NIR colors are present in the COUP source list, which are available through Getman et al. 2005b). But the long exposure improves the opportunity for capturing powerful X-ray flares which are characteristic of YSOs and not AGN. Based on the variability analysis of heavily absorbed COUP sources without optical/NIR counterparts and detailed simulations of the extragalactic background population, Getman et al. (2005a) argue that 75 COUP sources are previously unknown embedded cloud members, of which forty-two are confirmed by the detection of powerful X-ray flares. These X-ray discovered stars are spatially clustered within the two well-known OMC-1 cores and the dense molecular filament, which extends northwards from OMC-1 to OMC-2/3.
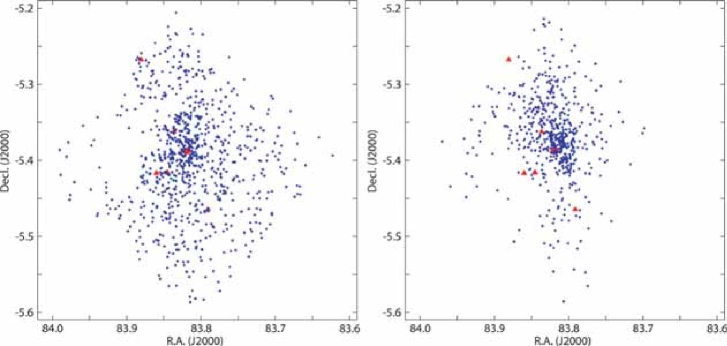
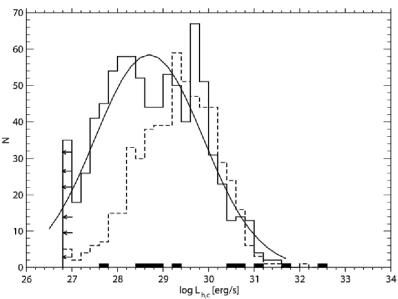
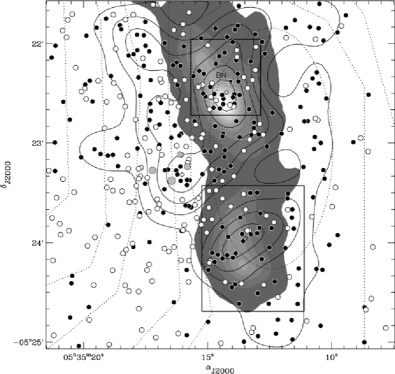
The census of COUP sources with confirmed Orion membership includes 1315 stars with known optical/NIR counterparts, 75 new embedded stars, 16 unidentified likely new lightly obscured members of ONC (Getman et al. 2005c), and two faint X-ray sources associated with the Herbig-Haro object HH-210 (COUP # 703 and # 704; Grosso et al. 2006). Three classes contribute roughly equally to the integrated X-ray luminosity in the hard keV band: 10 unobscured hot Trapezium stars earlier than B4, 839 cool (later than B4) lightly-obscured COUP sources with cm-2 ( mag), and 559 heavily-obscured stars (Feigelson et al. 2005). The spatial source distribution for the cool unobscured (Figure 11 left), and heavily obscured populations (Figure 11 right) show a spatial asymmetry – a deficit of stars to the east on pc scales – consistent with violent relaxation in the stellar dynamics (see, however, Fűrész et al. 2008) and the concentration of obscured sources around both OMC-1 molecular cores. The X-ray luminosity function (XLF) of the unobscured cool population is complete down to and complete down to . The XLF shape is roughly log-normal in shape and the obscured population is deficient in lower-luminosity stars due to localized circumstellar material (Figure 12). One-third of the Orion Nebula region hard-band emission is produced by the bright O star Ori C, and half is produced by lower mass pre-main sequence stars with masses (Feigelson et al. 2005).
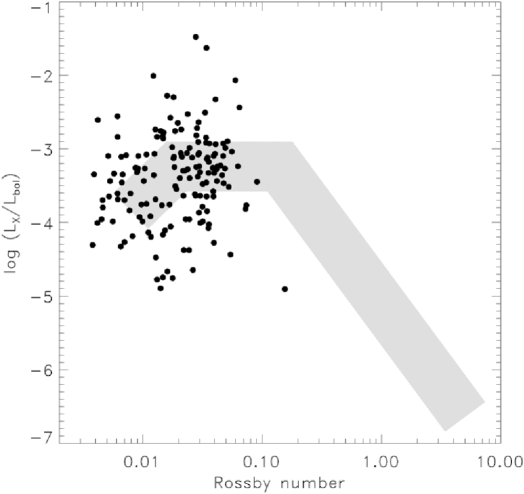
With the detection limit of ergs/s for the unobscured COUP population, X-ray emission was detected from more than of the optically visible late-type (spectral types F-M) T Tauri stars (TTS) in the ONC, demonstrating that there is no “X-ray quiet” population of late-type stars with suppressed magnetic activity. Preibisch et al. (2005a) show that TTS with known rotation periods lie in the saturated or super-saturated regime in a diagram comparing X-ray activity with the stellar interior Rossby number (Figure 13 left). But the TTS show much larger scatter in X-ray activity than main sequence stars. This scatter is partly attributable to accretion: while the X-ray activity of the non-accreting TTS is consistent with that of rapidly rotating MS stars, the accreting stars are less X-ray active (by factors of ), perhaps because magnetic reconnection cannot heat the dense plasma in mass-loaded accreting field lines to X-ray temperatures. The fact that COUP stars do not show the drop-off in magnetic activity as stars rotate more slowly may suggest that the magnetic dynamo process is saturated in some way and/or that a different dynamo is operative in young stars that is independent of rotation. Preibisch et al. (2005a) do find that COUP X-ray luminosities are correlated with stellar mass and volume, which generally suggests a turbulent convective dynamo model.
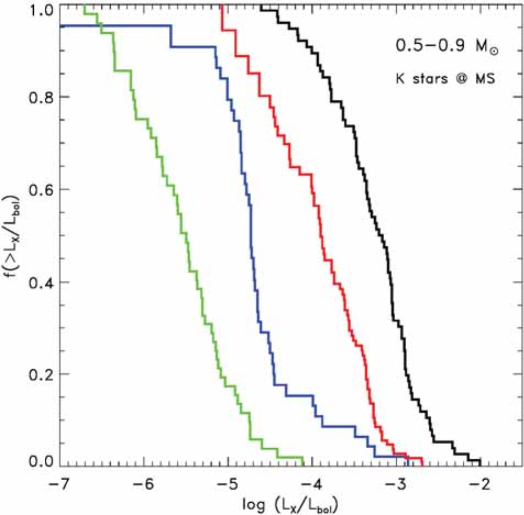
For main sequence stars older than Myr, it has long been known that younger stars are more magnetically active than older stars. Preibisch & Feigelson (2005) clearly establishes that the activity-age relation continues through the PMS phases (Figure 13 right) and find a decay law that is mass-dependent at young ages. Wolk et al. (2005) used a complete sample of 1 solar mass Orion stars in the COUP field to show that analogs of the young Sun spend one-fourth of their time in flare state, exhibit incredibly high levels of magnetic activity with the median luminosities 2-3 orders of magnitude higher for both “quiescent” and peak flare levels compared to the contemporary Sun. Caramazza et al. (2007) further show that X-ray flare frequency in young lower-mass stars is indistinguishable from that of the young solar analogs. Finally, Maggio et al. (2007) find that elemental coronal abundances in X-ray luminous young Orion stars are similar to those of older magnetically active stars.
X-rays from Embedded Sources
The spatial distribution of “obscured” COUP sources clearly traces the basic structures of the central cluster; each of Trapezium core, the B-N/K-L and OMC-1S regions appear as over-densities in Figure 14. The detailed properties of the COUP detected X-ray embedded sources in B-N/K-L and OMC-1S regions (see boxes in Figure 14) are discussed by Grosso et al. (2005). Grosso et al. found 60 COUP X-ray sources toward the OMC-1S dust continuum core, with more than 60% of them being obscured. In the B-N/K-L region 43 sources were detected and half of these were obscured. Based on comparison of the X-ray luminosity function of the observed X-ray populations embedded in OMC-1S and B-N/K-L with that of the unobscured ONC population, Grosso et al. estimated total populations of 70 versus 80 embedded stars residing inside the OMC-1S and B-N/K-L cloud cores, respectively.
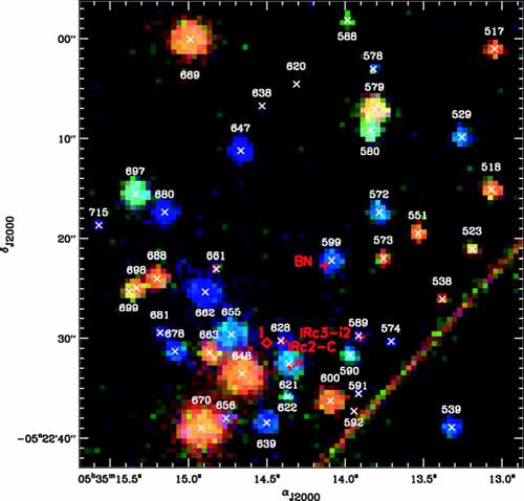
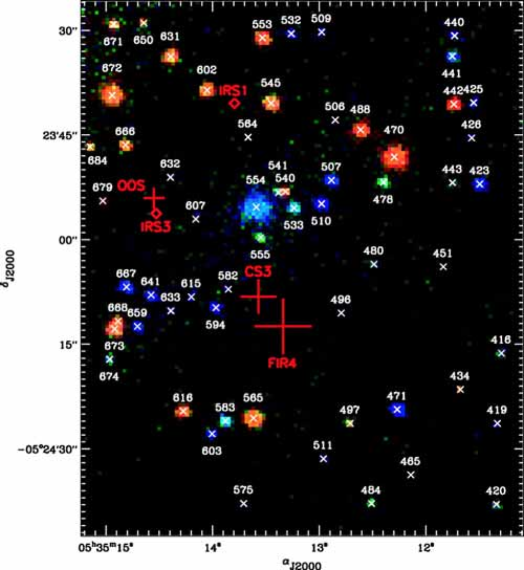
Close-up images of these two regions, scaled to the same physical size are compared in Figure 15. This is the first direct measurement of the low-mass population of the OMC-1S cluster with 18 new X-ray sources without infrared counterparts. COUP OMC1-S detections include the most embedded X-ray source in the COUP survey, COUP 632 (= TPSC 1), a protostar with mag of visual absorption. X-ray sources are found close to four luminous mid-IR sources – B-N, IRc3-i2, IRc2-C, and Source n – but their X-ray variability and spectral properties are typical of coronal activity of low-mass companions rather than wind emission from massive stars. No X-ray emission is seen from the radio-bright massive protostar Source I.
Using the combination of compiled CTIO-ISPI near-IR with Spitzer IRAC mid-IR imaging data, Prisinzano et al. (2007) establish the list of 45 protostellar candidates within the COUP field of view: 23 designated as Class 0-Ia with their IR SEDs monotonically rising from to and 22 designated as Class 0-I with SEDs rising from up to . Of these, have X-ray counterparts in COUP data. Their tabulations also contain cross-references to a number of thermal IR surveys of the nebula. The spatial distribution of these protostellar candidates trace the dense molecular filament that extends northward from OMC-1 to OMC-2/3 clouds and is similar to that of 75 likely new embedded cloud members found in Getman et al. (2005c). However, due to nebular contamination and crowding in mid-IR, Prisinzano et al. were not able to classify many X-ray embedded sources located in B-N/K-L and OMC-1S regions (Grosso et al. 2005). In addition, a sub-cluster of seven highly embedded X-ray sources in OMC-1S (COUP # 582, 594, 615, 633, 641, 659 and 667) at approximately RA,DEC = 05:35:14.8, -05:24:12 (J2000; see also Figure 15) is simply invisible in Spitzer data. In regards to the evolution of the X-ray emission, Prisinzano et al. find that Class 0-Ia protostellar candidates are intrinsically less luminous than the Class II stars.
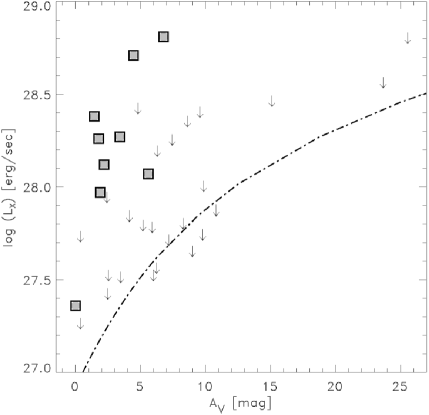
X-ray Properties of Orion Brown Dwarfs
In the core of the ONC, 9 spectroscopically-identified brown dwarfs were detected with the COUP (Preibisch et al. 2005b). The low detection rate is seemingly related to the substantial extinction to most of these brown dwarfs (Figure 16). There is no evidence for changes in the magnetic activity around the stellar/substellar boundary; instead the X-ray properties of the detected brown dwarfs, including spectra, fractional luminosities, and flare rates, are similar to those of the low-mass stars in the ONC. Trends in the fractional X-ray luminosity and surface flux and a comparison to the X-ray properties of late type field dwarfs led Preibisch et al. (2005b) to conclude that the photospheric temperature of late type stars rather than source mass or surface gravity controls the X-ray emission mechanism.
X-ray Observations of Orion Flanking Fields
Because the COUP survey samples only the inner parts of the Orion Nebula, X-ray surveys of what have been deemed the Orion “Flanking fields” are important. This is because they provide membership information at large cluster radii, where other methods are ambiguous. The Ramírez et al. (2004) survey follows the axis of the cloud, sampling Chandra ACIS fields north and south of the immediate Nebula. While they are much less sensitive than the COUP observations, their results provide interesting evidence for age gradients along the axis of the cloud. New surveys with XMM covering all of the OMC and Orion A clouds are currently being completed and will soon yield more spatially complete results as well as extensive publicly available archival data.
3.3. Spectroscopic Surveys
Historic Studies
The “Orion population” stars have long been of interest to spectroscopists. Early and numerous studies using objective prism plates were published by e.g. Herbig, Haro, Sharpless, Johnson, Walker, and Penston among others. These authors were interested in emission-line aspects as well as spectral types over the Orion Ic and Id regions. Specifically, spectral types for stars in the ONC, as defined above, were reported by: Blanco (1963); Cohen & Kuhi (1979); Greenstein & Struve (1946); Herbig as quoted in Walker (1969); Johnson (1965); Levato & Abt (1976); Abt & Levato (1977); Lallemand et al. (1960); McNamara (1976a); Parenago (1954a); Penston (1973); Penston et al. (1975); Strand (1958) though referenced mostly to Sharpless; Smith et al. (1983); Trumpler (1931); Walker (1983). Many of these studies also include the larger Orion population. In the majority of cases the literature of this era was focused on identifying the emission line stars, on characterizing the cluster sample, and on understanding whether the fainter objects should be interpreted as reddened, or lower mass, or of older age.
Modern Low Resolution Surveys
Modern optical spectra of a few tens of ONC stars were produced by pioneers such as Herbig & Terndrup (1986) and van Altena et al. (1988), while photographic H plate surveys have also continued (see previous Sect. 3.1.). The largest collection of published spectral types is contained in Hillenbrand (1997), which incorporated new data on many hundreds of stars as well as previously published (those references above plus more modern additions from e.g. Duncan (1993); Edwards et al. (1993); Wolff et al. (2004), and unpublished (e.g. Prosser & Stauffer spectra; Samuel (1993), PhD thesis, and Hamilton 1994, MSc thesis) information. Approximately 950 spectral types were provided. Since the Hillenbrand (1997) publication, however, approximately 800 more spectral types over the same projected area have become available; an updated catalog is being prepared (Hillenbrand et al.).
Relevant sources of new optical spectroscopy include Riddick et al. (2007) and spectral types for a few of the sources in Slesnick et al. (2004). Infrared spectroscopy includes Luhman et al. (2000), but has more recently focussed on the lowest mass candidate members of the ONC with contributions by Lucas et al. (2001, 2006), and Slesnick et al. (2004). There is also ongoing work of Lada with the FLAMINGOS multi-object spectrograph. Very late M and perhaps even L0 or L1 objects have now been identified in the ONC region.
Modern Echelle Surveys
Ushering in modern high dispersion studies of the Orion Ic/Id region were the works of Smith et al. (1983), Walker (1990), McNamara (1990), Abt et al. (1991), and Duncan et al. (1991); Duncan (1993) which all focused on rotational velocities. King (1993), Duncan & Rebull (1996). Palla et al. (2005) (and Palla et al. 2007) subsequently studied lithium abundances as well as radial velocities for small samples of Orion stars; Sicilia-Aguilar et al. (2005) derived the same for a larger sample of several hundred stars, and also provided rotational velocities. Additional rotational velocities come from Rhode et al. (2001) and Wolff et al. (2004) who both studied stellar angular momentum. Padgett (1996), Cunha et al. (1995, 1998), and Cunha & Smith (2005) published work on abundances including several ONC stars. Fűrész et al. (2008) provide radial velocities for a large sample of ONC stars in a study of cluster kinematics. Most recently, Yang & Johns-Krull (2007) have achieved the means to study the magnetic fields of ONC stars.
At this time, there is a considerable amount of data across the stellar mass spectrum on rotational velocities in the ONC that, together with rotation periods, are providing insights into stellar angular momentum at the earliest stages of stellar evolution. Lithium samples are far smaller, but remain valuable. Abundance information and magnetic field measurements are intriguing but remain rather limited at present.
3.4. Stellar Properties
The photometric and spectroscopic surveys described in the previous two sections have provided the panchromatic data necessary to assess the stellar population of the ONC. Compared to other such studies of older clusters, significant challenges are posed in the ONC by the effects on observed colors of nebular contamination and disk accretion (both of which cause blueing), and circumstellar and interstellar dust (reddening). Spectral continuum and certain spectral lines are also affected. Nevertheless, perseverance has led to understanding of typical ages and to estimates for individual stellar masses.
Stellar Ages and Star Forming History
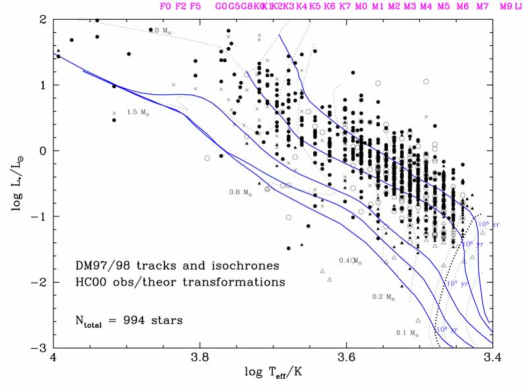
Notwithstanding subsequent criticism of his data quality by Walker (1956), Parenago (1954a) was first to observe a “cloud” of subgiants later than spectral type A0 and more luminous than the main sequence in the vicinity of the Orion Nebula. Along a pathway similar to his previous studies of NGC 2264, NGC 6530, NGC 6611, and IC 5146, Walker (1969) used photoelectric photometry of sources listed in Brun’s catalog to confirm the existence of pre-main sequence stars in the Nebula. Other photometric spectroscopic surveys of the 1970’s followed suit. It was Herbig & Terndrup (1986) who quantitatively demonstrated the youth of the ONC stars by comparing their dereddened color-magnitude diagram to the theoretical evolutionary tracks of Vandenberg & Bell (1985). They found that the vast majority of stars were younger than 1 Myr, and therefore seemingly inconsistent in their age distribution with the canonical 10 Myr life times of molecular clouds (Blitz & Shu 1980). Improvements in the data and in the theory resulted in similar conclusions being drawn by subsequent workers, e.g. Prosser et al. (1994), Hillenbrand (1997) and Slesnick et al. (2004). Figure 17 is an update of the Hillenbrand (1997) HR diagram illustrating this star forming history. Hillenbrand (1997) further suggested a mild age gradient, featuring young median ages closer to the cluster core and a slightly older population in the outer nebula region about 2.5 pc from the core.
However, these later studies also highlighted the existence of a seemingly rogue population of apparently older stars, that is, those located well below the main distribution (See the HR diagram of low mass stars in Figure 20 left). These have been variously interpreted as sources that are coeval with the others but affected by circumstellar material that renders them visible only in scattered light, or sources that truly are as old as they appear and therefore offer evidence for large age spreads in star forming regions. Although the typical age of ONC members is widely agreed to be 1-2 Myr (modulo the systematic effects caused by distance or by adoption of various among plausible sets of theoretical pre-main sequence evolutionary tracks), there is still considerable debate regarding the meaning of the apparent luminosity spread. The problems illuminated in detail by e.g. McNamara (1976a) remain. On the one hand, there is significant evidence that the error budget for individual stellar luminosities is underestimated due to photometric variability, difficulties with extinction corrections, unaccounted for multiplicity, etc.; these effects are in addition to known systematic problems with the effective temperatures. On the other hand, there are also known processes such as inefficient convection, large amplitude magnetic fields, accretion of new material, and perhaps rotation, that pertain to pre-main sequence evolution. Together these phenomena suggest caution in any literal interpretation of apparent luminosity spreads in HR diagrams as actual age spreads.
There is, however, evidence from Palla et al. (2005, 2007) regarding spreads in the lithium depletion of young low mass stars in the ONC that seemingly supports the range in ages inferred from the luminosity spread in the HR diagram. Ages of 10-30 Myr are derived for a small fraction of the (notably a moderately to heavily veiled) sample. Further, Jeffries (2007b) used a combination of rotation periods and values to infer a distribution of values and hence a statistical distribution of stellar radii ranging over a factor of 2-3, which they also argue is inconsistent with an age dispersion less than 0.3 to 0.5 dex. Clearly more work is needed in order to resolve the debate regarding the duration of star formation episodes relative to cluster crossing times.
Stellar Masses and the Initial Mass Function
The ONC was an important test case regarding ideas of “bi-modal” star formation in which high-mass and low-mass stars were suggested as incapable of forming in the same place and at the same time. Empirically, processes similar to those used to assess stellar ages from HR diagrams were also used to assess stellar masses. Evolutionary tracks such as those by Iben & Talbot (1966) and Vandenberg & Bell (1985) showed early on that such a bimodal scenario was not applicable to the ONC. Yet it was not until the 1990’s that quantitative measurements of the initial mass function were claimed for the ONC.
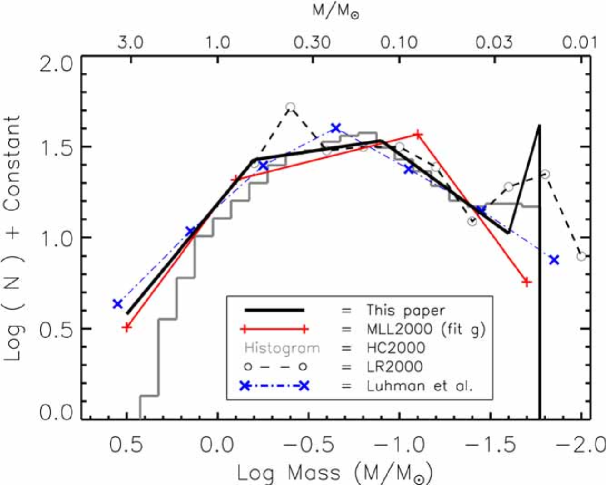
The first efforts involved use of the surrogate luminosity function, and stellar models translated to the empirical plane with some strong assumptions regarding age spreads and multiplicity. Zinnecker & McCaughrean (1991, see also ()) were the first to apply these techniques to newly available m survey data of the ONC. These efforts were followed by others including McCaughrean & Stauffer (1994), Ali & Depoy (1995) and Muench et al. (2000, 2002) that established the existence of stars as low in mass as the hydrogen burning limit (0.073 M⊙), as well as a substantial number of likely brown dwarfs (notably before the confirmation of Gl229b as the first bona fide brown dwarf!). Lucas et al. (2005) have extended these arguments to the deuterium burning threshold (0.005 M⊙ or 5 MJupiter). Prosser et al. (1994) carried out similar analysis using and data from HST. As an intermediate step between one-dimensional luminosity functions and two-dimensional HR diagram methods, Hillenbrand & Carpenter (2000) applied a statistical technique to and -band color-magnitude diagrams to determine stellar mass probability functions which could be summed to form an initial mass function.
Hillenbrand (1997) produced the first “forward modeling” method to derive an initial mass function in the ONC, making use of the full HR diagram (Figure 17) established from optical photometry and spectroscopy, and the evolutionary tracks of D’Antona & Mazzitelli (1994) and Swenson et al. (1994). Luhman et al. (2000) and Slesnick et al. (2004) used infrared photometry and spectroscopy to push the investigation to lower masses, across the brown dwarf limit.
All of the above studies are consistent with a mass function that rises in a Salpeter like fashion from the highest masses 555Pflamm-Altenburg & Kroupa (2006) argue, however that the ONC suffers a deficit in stars more massive than 5. to the sub-solar regime, then begins to flatten around 0.5-0.6 M⊙ with a peak around 0.2-0.3 M⊙ and then turns over into the brown dwarf regime. The exact details depend on the methods, the samples, and the models though, as demonstrated by Muench et al. (2002, see Figure 18), there is remarkable agreement considering possible sources of variance.
Binarity of T Tauri Stars in the Nebula
The Orion Nebula Cluster offers an excellent opportunity to study the frequency of binarity among young low-mass stars in a clustered environment and to determine the shape of the binary separation distribution function at an early age. The first major survey for subarcsecond visual PMS binaries in the ONC was carried out by Prosser et al. (1994) using the Hubble Space Telescope. On their high-resolution optical images they found 35 new visual binaries with separations up to 1 arcsec. Padgett et al. (1997) and Petr et al. (1998) found another 7 and 4 binaries, respectively. The former study used archived -band HST images to study an area from the Trapezium while the latter used speckle holography to reconstruct ground-based near-infrared images within the central . Additional visual binaries were found by Simon et al. (1999) and Köhler et al. (2006) , both based on adaptive optics K-band observations. The results of Bouy et al. (2008) illustrate how continued improvements to AO instrumentation will add new binary systems to the Orion census. Finally, the COUP X-ray survey identified several binaries in the ONC (Getman et al. 2005a).
Recently, Reipurth et al. (2007) carried out a major survey of the ONC using H images obtained with the HST ACIS. In a region extending from 1 to () surrounding Ori C they found 78 multiple systems, of which 55 are new discoveries, with separations less than . Because of the high stellar density in the ONC, it can be statistically determined that 9 of these must be line-of-sight associations (see also the analysis of Simon (1997) and Bate et al. (1998) regarding the impact of high stellar density on true binary fraction). When correcting for this, a binary fraction of 8.8%1.1% is found in the limited range from 67.5 to 675 AU. In the same range, the field binary fraction is a factor 1.5 times higher (Duquennoy & Mayor 1991), and the binary fraction in loose associations is a factor 2.2 higher than in the ONC (Reipurth & Zinnecker 1993). The separation distribution function shows unusual structure, with a steep decrease in the number of binaries for separations larger than . Moreover, the ratio of wide to close binaries across the ONC shows a major depression towards the central region, indicating that wide binaries are destroyed as they pass through the central potential well, as theoretically expected (e.g. Kroupa et al. 1999).
3.5. Sub-stellar Objects in the Nebula
Optical and near-IR imaging surveys (Sect. 3.1.) have revealed at least 100 sources within the central 0.5 pc of the Trapezium that, according to pre-main sequence theory, have luminosities at an age of 1 Myr that are consistent with their being substellar objects. While similarly deep images of the outer nebula exist, photometric censuses have not yet been published. Purely photometric selection techniques are, however, less precise at securely identifying brown dwarfs, since their luminosity is a function of age. For example, Slesnick et al. (2004) reported a number of warmer sub-luminous objects that masquerade as lower luminosity brown dwarfs (see Figure 20 right). Whether these sources are older or their fluxes contaminated perhaps by scattered light is not yet clear. Thus, the identity of an individual young stellar object (YSO) as substellar rather than pre-stellar is best established using measures of that source’s effective surface temperature and/or surface gravity. The precise boundary at which a YSO can never attain sustained nuclear burning comes from theoretical evolutionary models, with a working consensus (e.g., Luhman et al. 1998) that includes young ( Myr) objects cooler than K or a spectral type later than “M6.” According to this criterion, there are such objects in the most recent version of the Hillenbrand (1997) wide field catalog.
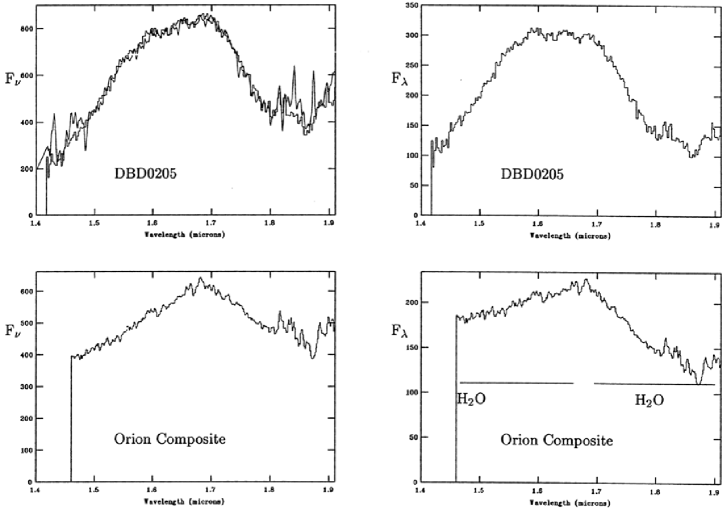
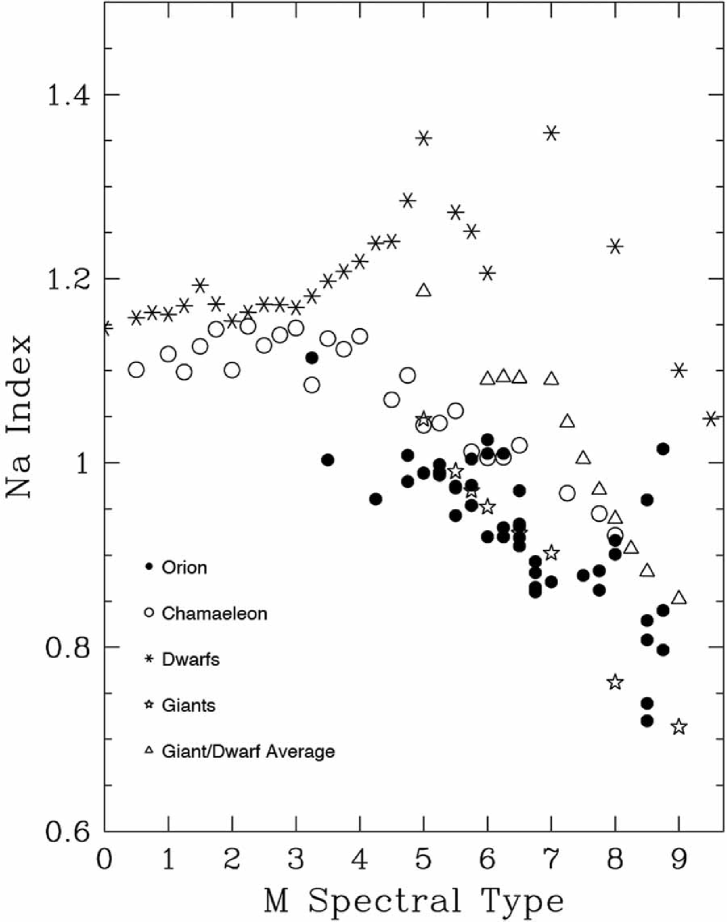
Surface Gravity
Especially over the last five years, the utility of spectroscopic surface gravity diagnostics (e.g. NaI, CaI, KI, TiO, VO, CO, steam) has become apparent, especially towards the lowest masses, and can in principle be used to distinguish bona fide cluster members from both faint red foreground dwarfs and reddened background giants. Examples of such surface gravity sensitive observations of Orion Nebula sources are given in Figure 19, including NaI (8183/8195Å) and steam in the near-IR band. Relevant studies in the optical include Riddick et al. (2007, see also Figure 19). Near-IR studies include Luhman et al. (2000), Lucas et al. (2001, see also Figure 19), which were the first observations to reveal the sharp “triangle” shape of the band spectra for low surface gravity late M stars, Slesnick et al. (2004), Slesnick et al. (2005), and Lucas et al. (2006). However, there are not yet well established methods at all spectral types and the published data on these Orion sources reflect a lack of uniform spectral typing. Furthermore, the intermediate-gravity nature of young pre-main sequence stars is not readily apparent in all cases. Specifically, many stars with strong evidence from both emission lines and infrared excesses for membership are not distinguished as such based on surface gravity alone. Establishment of cluster membership may need to rely on kinematic association in addition to surface gravity indicators.
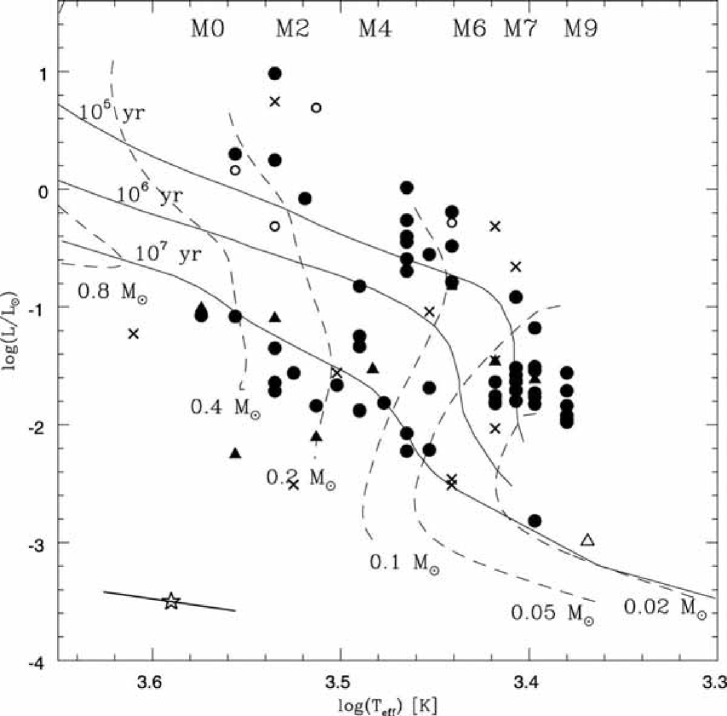
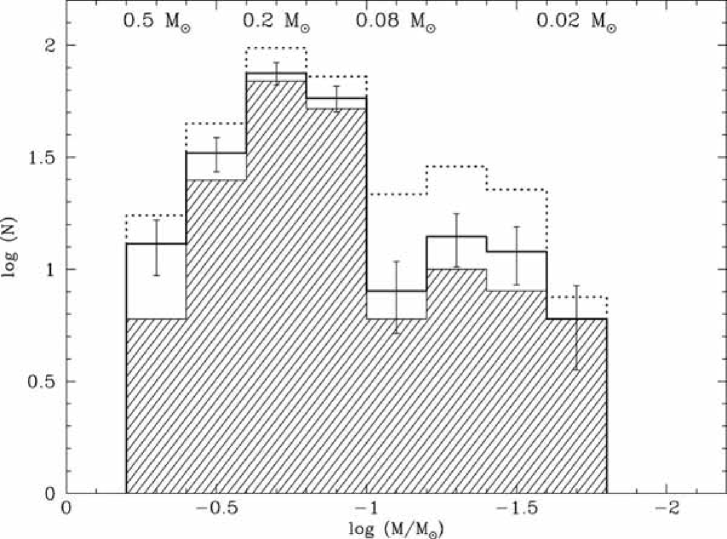
Masses
By number, brown dwarfs constitute between and of the total ONC membership (Muench et al. 2002; Slesnick et al. 2004; Levine et al. 2006), although the precise value depends in part upon the assumption of a luminosity and effective temperature for a star at the hydrogen burning limit (Levine et al. 2006). By mass this is negligible compared to the overall conversion of gas to stars in this cloud. The reported substellar IMF alpha (per unit log mass) is (Hillenbrand & Carpenter 2000; Muench et al. 2002), however, this function is poorly described by a single power-law as seen in Figures 18 and 20 (right). Additionally, the near-IR luminosity function of the central ONC displays structure at the faint end that is greater than expected purely from field star contamination but is not consistent with a simple declining power-law IMF given current PMS theory (Muench et al. 2002).
Interesting Very Low Mass Sources
The object 2MASS J05352184-0546085 was found to be a unique brown dwarf-brown dwarf double line eclipsing binary system by Stassun et al. (2006a). The combination of photometric and spectroscopic monitoring allowed individual masses and radii to be determined. Interestingly, the higher mass component has a cooler surface temperature than the lower mass component (Stassun et al. 2007a, 2008); more recent evidence of strong surface activity on the primary (Reiners et al. 2007) indicates this temperature reversal could be explained by the inhibition of convection by strong magnetic fields (D’Antona et al. 2000). The sustained efforts of deep monitoring projects in Orion are beginning to uncover additional low mass double line eclipsing systems, which can provide improved constraints on very low mass pre-main sequence evolutionary theory. These include JW 380 (Irwin et al. 2007, ) and Parenago 1802 (Cargile et al. 2008, ).
3.6. Circumstellar Matter
With a rich stellar population spanning the mass spectrum all the way from O-type massive stars to late-M-type brown dwarfs, the ONC is an obvious arena for investigations of circumstellar disks. Known for decades as a rich collection of emission line objects (e.g., Haro 1953; Parsamian & Chavira 1982), the ONC was also an early target of infrared investigations. In particular, the single channel photometer measurements of Rydgren & Vrba (1984), Breger et al. (1981), Smith (1976), McNamara (1976a), Penston (1973); Penston et al. (1975), Ney et al. (1973), and Lee (1968) established that many ONC stars had excess emission at near- to mid-infrared wavelengths. The frequency of circumstellar disks around brown dwarfs in the Trapezium appear to be a smooth continuation of this property for higher mass objects (Hillenbrand et al. 1998; Lada et al. 2000; Muench et al. 2001; Lada et al. 2004).
The advent of infrared arrays led to the studies of McCaughrean & Stauffer (1994); McCaughrean & O’Dell (1996), Ali & Depoy (1995), Jones et al. (1994), Hillenbrand et al. (1998), Simon et al. (1999), Hillenbrand & Carpenter (2000), Lada et al. (2000, 2004), Muench et al. (2001), Lucas & Roche (2000), which provided a census of excesses, an assessment of the prevalence of circumstellar disks with stellar mass, and correlations with stellar environment within the ONC. Most recently, data has improved the detailed knowledge of these disks at mid-infrared wavelengths with papers by Rebull et al. (2006) and Cieza & Baliber (2007) adding to ground-based mid-IR work, e.g., Stassun et al. (2001), in investigating disk versus stellar rotation paradigms. Additional mid-infrared work focussing on proplyds is that of Smith et al. (2005). Towards longer wavelengths, millimeter investigations including those of Eisner & Carpenter (2006), Eisner et al. (2008) and Williams et al. (2005) have together established the prevalence of minimum-mass solar nebula disks in the ONC, and the existence of several much more massive systems.
Disk Accretion
Studies of the accretion signatures typically associated with such disks are difficult in the ONC due to the bright continuum and emission-line backdrop of the Nebula. However, studies of the CaII “infrared” triplet (Samuel 1993; Hillenbrand et al. 1998), which is the only strong optical line found in accretion disks but not in HII regions, avoids issues with strong and variable background in more typically observed lines such as H. Using high dispersion spectroscopy, Sicilia-Aguilar et al. (2005) and Fűrész et al. (2008) were able to separate nebular and stellar emission at H and, focussing on the line wings, claim to find many sources (including those lacking thermal excess) that indicate accretion rather than winds. Finally, studies of the accretion continuum at UV wavelengths have included those of Robberto et al. (2004) in the inner ONC using HST and Rebull et al. (2000) in the ONC “flanking fields” from the ground. In summary, of the stars in the inner ONC are suspected accretors. A median accretion rate of has been derived, with some evidence for a dependence of accretion on stellar mass. Deep spectroscopic studies of such accretion signatures are lacking for the brown dwarf population.
X-ray Clues to Disk Evolution
The high X-ray intensity and hard spectra found for ONC stars indicate that the ionization of disk gases by stellar X-rays dominates ionization by cosmic rays or other sources by a large factor ( for 1 M⊙ stars). COUP provides two lines of direct evidence for establishing where the disk irradiation by X-rays originates. First, Kastner et al. (2005) find that the X-ray absorbing column of the COUP stars surrounded by dusty “proplyds” imaged with HST increases with disk inclination. The soft X-rays being absorbed must ionize disk gas. Second, the COUP results(and studies of other YSOs; e.g. Imanishi et al. 2001) include the detection of the fluorescent emission line from cold iron atoms at 6.4 keV, which is seen next to the hot plasma line around 6.7 keV (Figure 21, Tsujimoto et al. 2005). The equivalent widths of the 6.4 keV line observed in the COUP sample are compatible with the fluorescence originating in a centrally illuminated disk observed face-on, and cannot be attributable to the fluorescence by interstellar or circumstellar matter along the line of sight. Recent theoretical studies have predicted that the behavior of protoplanetary disks and the processes of planet formation will be significantly altered if the disks are slightly ionized (see reviews by Feigelson 2005; Glassgold et al. 2005). For example, the planets would form in a turbulent and lumpy disk rather than a smooth disk, which may prevent Earth-like planets from rapidly migrating through the disk towards the young star. Thus the X-rays from young stars may have important implications for the formation of planets around these stars.
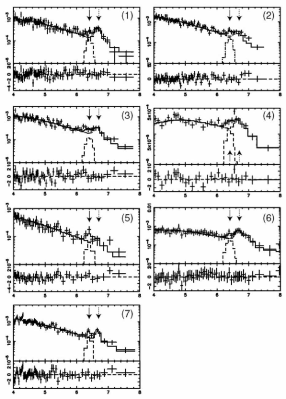
3.7. Kinematics and Cluster Structure
Proper Motion Studies
Proper motion studies in the literature are greatly muddled by the quality of and by systematics evident in the observational data. This has yielded conflicting results about the relative motions of stars and whether they display systematic expansion or contraction. Authors including, Parenago (1954a), Strand (1958) and Fallon et al. (1977), have all produced evidence for the expansion or contraction of the cluster, with evidence offered by Vasilevskis (1962, 1971) and Allen et al. (1974) indicate that these claims are due to observational error. Two classic proper motions studies are van Altena et al. (1988) and Jones & Walker (1988). The van Altena et al. proper motion study used plates from three observatories over a 77 year period. The internal error estimates are very small for the high mass members () and they derived a velocity dispersion of 0.7 milliarcsec/yr (1.3 km s-1 at a distance of 400 pc) for 48 members. Jones & Walker (1988) used 47 deeper red plates taken over a 20 year timescale to derive proper motions and membership probabilities for nearly 1000 stars near the Nebula. Focusing on somewhat lower mass objects, they find a velocity dispersion of 2.5 km s-1, which they point out is similar to the clump to clump velocity dispersion of the gas. They also confirmed van Altena et al.’s finding of a smaller velocity dispersion for the bright stars. This suggested to Jones & Walker a relationship between velocity dispersion and mass that could also constrain the dynamical state of the cluster. Reviewing these results, Hillenbrand & Hartmann (1998) find that any variation in velocity dispersion with mass appears to be too small to be consistent with the equipartition of energy occurring during significant dynamical evolution. The long baseline and high resolution of data in the HST archive should provide good astrometry for updating these proper motion results (e.g., O’Dell et al. 2005).
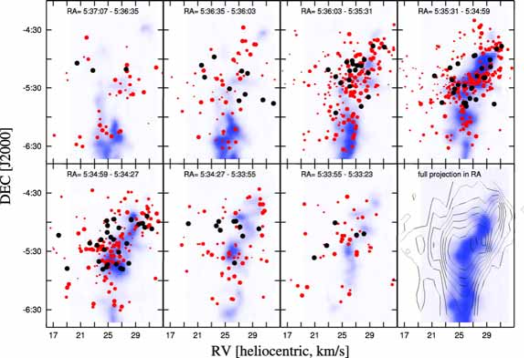
Radial Velocity Studies
The difficulty of acquiring radial velocities for a large number of young stars has been recently overcome using new multi-fiber echelle spectrographs. While earlier works such as Johnson (1965) or Walker (1983) were able to observe tens of stars, the recent surveys published by Sicilia-Aguilar et al. (2005) and Fűrész et al. (2008) include a total of about 1300 stars around the Orion Nebula (and the Northern Orion A Molecular Cloud). They find a bulk velocity dispersion of km s-1 for all the members. This dispersion should be interpreted carefully considering the existence of a large km s-1 gradient across the Nebula, which is most evident in the top right panel of Figure 22. Indeed across the Northern Orion A cloud, Fűrész et al. find that the radial velocities of the stars appear to correlate strongly with the radial velocity of the molecular gas cloud.
Structure
The Orion Nebula Cluster is elongated parallel to the Orion A Molecular Cloud with a centroid from elliptical star count fitting falling just North of Ori C (Hillenbrand & Hartmann 1998). No substructure is evident in the optically revealed stars (Hillenbrand & Hartmann 1998; Scally & Clarke 2002), which has been interpreted to suggest that the cluster may have formed from a fairly large number of small clusterings that quickly dispersed. Some evidence for subclustering at the scale appears when one studies the youngest, most embedded members (Lada et al. 2000, 2004; Grosso et al. 2005). Hillenbrand & Hartmann also found that the cluster displays a radial profile that is well fit by a King profile, having a core radius of 0.1-0.2 pc and a central stellar density exceeding (McCaughrean & Stauffer 1994; Hillenbrand & Hartmann 1998). It has been argued that this mass distribution is primordial as it seems unlikely that the cluster achieved a King like radial profile as the result of dynamics given its youth. A similar, primordial explanation is given regarding evidence for mass segregation of the highest mass stars to the cluster’s core and a skew of lower mass stars to the outer parts of the cluster (Hillenbrand & Carpenter 2000). Investigations into the spatial distributions of stars and brown dwarfs have been made (Kumar & Schmeja 2007), but that field of study was very small and perhaps more interesting results await much wider field studies that cover more than the central 0.5 pc and include radial velocity studies of the faintest members.
4. The Most Massive Stars in the Orion Nebula
The Orion Nebula is an HII region created (primarily) by the ionizing photons of the central O star, Ori C. There are a total of 20 optically revealed O or B type primaries, which are listed in Table 4; this tabulation is a merger of Orion 1 subgroup “d” association members from Brown (1996) and the Hillenbrand (1997) ONC census.
| Designations | Positional Information | |||||||
|---|---|---|---|---|---|---|---|---|
| Parenago | Common | Draper | Brun | Reference Catalog | Equatorial (ICRS) | Epoch | ||
| (1954) | (HD) | (1935) | Name | # | RA | DEC | (yr) | |
| 1539 | 328 | 2MASS | 05343999-0510070 | 83.666636 | -5.168633 | 2000.9 | ||
| 1605 | V 327 Ori | 36917 | 388 | TYC | 4774-809-1 | 83.69575750 | -5.57072639 | 1991.7 |
| 1660 | 36939 | 442 | TYC | 4744-823-1 | 83.73038972 | -5.50614139 | 1991.7 | |
| 1744 | 36981 | 502 | TYC | 4744-915-1 | 83.77582389 | -5.20442611 | 1991.7 | |
| 1772 | LP Ori | 36982 | 530 | TYC | 4774-849-1 | 83.79098528 | -5.46478444 | 1991.7 |
| 1865 | Ori A | 37020 | 587 | HIP | 26220 | 83.81592896 | -5.38731536 | 1991.25 |
| 1863 | Ori B | 37021 | 595 | COUP | 778 | 83.817270 | -5.385220 | 2003.04 |
| 1891 | Ori C | 37022 | 598 | TYC | 4774-931-1 | 83.81860444 | -5.38969611 | 1991.8 |
| 1889 | Ori D | 37023 | 612 | HIP | 26224 | 83.82166016 | -5.38768076 | 1991.25 |
| 1892 | Ori F | 603 | MLLA | 388 | 83.819625 | -5.390222 | 2000.3 | |
| 1956 | V 1230 Ori | 655 | PPM | 702316 | 83.83632500 | -5.36236111 | 2000 | |
| 1993 | Ori A | 37041 | 682 | TYC | 4774-933-1 | 83.84540917 | -5.41606333 | 1991.7 |
| 2031 | Ori B | 37042 | 714 | TYC | 4774-934-1 | 83.86000444 | -5.41687306 | 1991.7 |
| 2085 | Ori C | 37062 | 760 | PPM | 188231 | 83.88098334 | -5.42122222 | 2000 |
| 2074 | NU Ori | 37061 | 747 | TYC | 4774-906-1 | 83.88068417 | -5.26738778 | 1991.7 |
| 2284 | 37114 | 920 | TYC | 4774-867-1 | 83.99391639 | -5.37537417 | 1991.7 | |
| 2271 | 37115 | 907 | TYC | 4778-1369-1 | 83.97533639 | -5.62839861 | 1991.6 | |
| 2366 | 37150 | 980 | TYC | 4778-1378-1 | 84.06261139 | -5.64792000 | 1991.6 | |
| 2387 | 37174 | 992 | TYC | 4774-855-1 | 84.11326917 | -5.40870417 | 1991.7 | |
| 2425 | 1018 | TYC | 4774-873-1 | 84.15876833 | -5.47638250 | 1991.7 | ||
The collective Bayer designation for the Orion Nebula is Orionis. The nomenclature of members of the inner Orion Nebula break down further into and designations, where Ori is the Bayer designation for the famous “Trapezium” asterism. A finder chart for the Trapezium is given in Figure 23. The principal components of the Trapezium are further labeled A, B, C, D, E, F; e.g., Ori C; subcomponents of these “A,B,C…” designations are marked with subscripts, e.g., Ori C1. Five of these six primaries in Ori are O or B type stars. The Ori designation corresponds to a string of three OB stars, e.g. the A,B,C components, lying near the bright bar; they are easily identified in Fig.7 just southeast of the Trapezium. Additional cross-references and observed positions for the unresolved primaries of these systems are given in Table 4. The identifiers from the Brun (1935) catalog especially useful for interpreting older texts. For completeness the star names 41 and 43 Ori are the Flamsteed designations for Ori and Ori A sources, respectively. Finally, the Trapezium is also frequently found listed by its catalog entry in the Aitken (1932), ADS 4186.
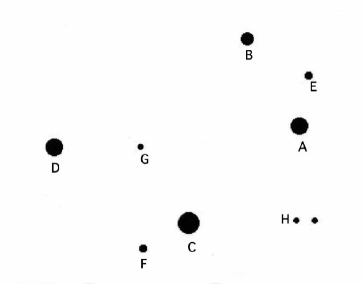
4.1. Basic Properties
Simón-Díaz et al. (2006) derive MK spectral types for 5 of the OB members in the central nebula and provide stellar properties (R, T, M, L, g, ) and extensive analysis of oxygen abundances through comparison to synthetic stellar models and template OB stars. An additional source of basic stellar properties can come from the multi-spectral flux ratios of the various binary components. For example, Kraus et al. (2007) used flux ratios from to bands for the Ori C1,2 binary to constrain the components to have spectral types of O5.5 and O9.5. Papers surveying rotational and radial velocities (to the extent permitted by the high multiplicity) of these objects include Abt et al. (1970), Abt et al. (1991) and Wolff et al. (2004).
X-rays from the OB stars were thought to be generated in a myriad of tiny shocks in their powerful winds. But this model predicts that the X-ray spectrum will be soft and the emission will be constant. The Chandra Orion Ultradeep Project (COUP) shows that the spectra of the Trapezium OB stars often have a hard component and can exhibit rapid flares (Stelzer et al. 2005). Of the 10 unobscured COUP sources earlier than B4, only three ( Ori D, NU Ori, and possibly Ori B) show the expected signature of many small wind shocks, while most show flares and/or hard spectral components. This suggests that the winds of these OB stars are, at least in part, trapped by magnetic fields, resulting in large scale shocks and production of hard X-ray emission (Babel & Montmerle 1997). Figure 24 compares X-ray emission from the steady-wind source Ori D with that of the magnetically active Ori A. COUP also confirms that the X-ray emission from intermediate-mass stars with spectral types B5-A9 is attributable to lower mass companions rather than the intermediate-mass star itself. Additional X-ray studies of the OB stars in the Orion Nebula include Caillault et al. (1994), Geier et al. (1995), Stahl et al. (1996), Schulz et al. (2000), Schulz et al. (2001), Schulz et al. (2003a) and Schulz et al. (2003b).
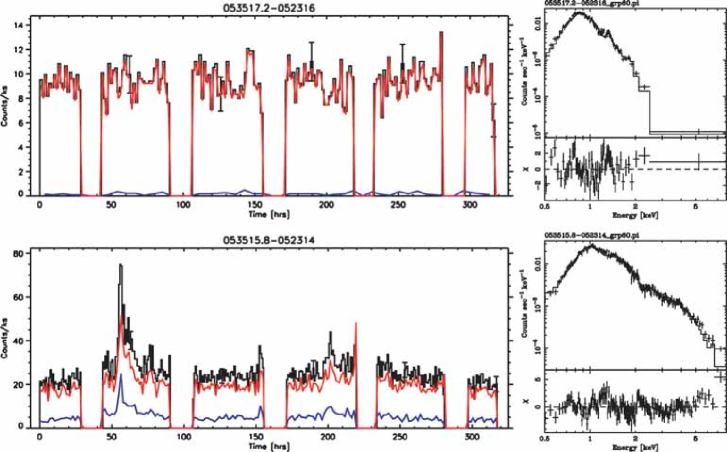
4.2. Kinematics
Compact stellar groups like the Trapezium are expected to be intrinsically unstable (Ambartsumian 1955). Therefore, the kinematics of such a stellar grouping could display systematic expansion or contraction, display evidence for disintegrating multiple systems or provide an origin for runaway stars (Poveda et al. 1967). Regarding signatures of disintegrating systems, van Altena et al. (1988) reported that the two O stars in the central Orion Nebula, Ori C & Ori A, were observed to have proper motions relative to other bright stars that were large enough to carry them out of the center of the Nebula in less than 1 Myr. However, the relative proper motions for the Trapezium stars derived by Allen et al. (1974) and updated in Allen et al. (2004) are in general very small, which calls into question whether Ori C is actually be ejected relative to the other Trapezium OB stars.
The dynamics of two more systems related to the Orion Nebula have garnered much more detailed attention. The first is the existence of two high velocity OB stars whose origins appear to coincide near the Orion Nebula. Blaauw & Morgan (1953) described the high velocity and apparent space motion of AE Aurigae away from Orion, while Blaauw & Morgan (1954) made this interesting connection for the star Columbae as well. While each is over from the Nebula, they have proper motion vectors corresponding to space motions km s-1 and Blaauw & Morgan (1954) estimated that they both originated in a dissolution event occurring near to the current Nebula about 2.7 Myr ago. Subsequent analysis included Blaauw (1961), while Gies & Bolton (1986) proposed adding the O star Ori, which is just South of the Nebula, into the dissolution. Hoogerwerf et al. (2000) and Hoogerwerf et al. (2001) performed the integration of the orbits including improved Hipparcos data, radial velocities and a Galactic potential field; their results further constrained the dissolution event to have occurred approximately 2.5 Myr ago and could have been located nearer the center of the cluster even than the location of Ori today. Numerical modeling of this event has been performed most recently by Gualandris et al. (2004).
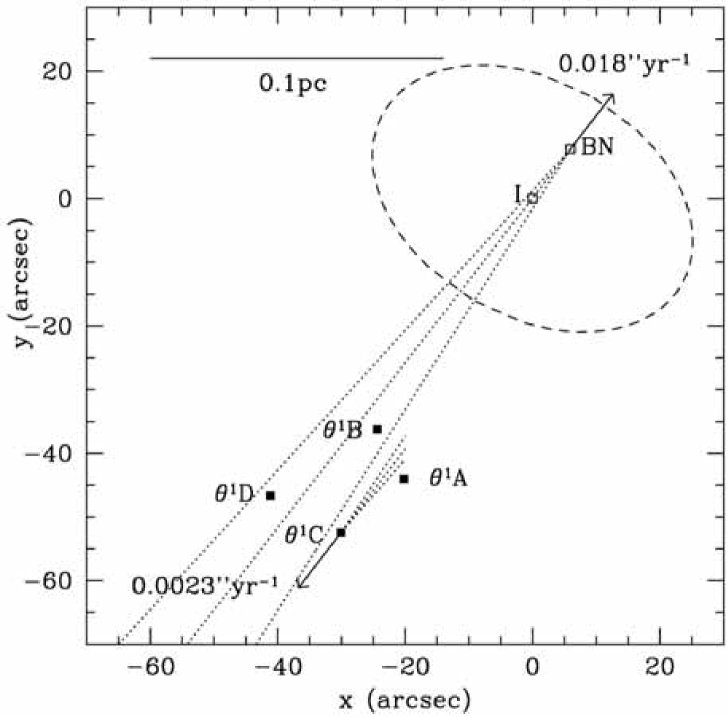
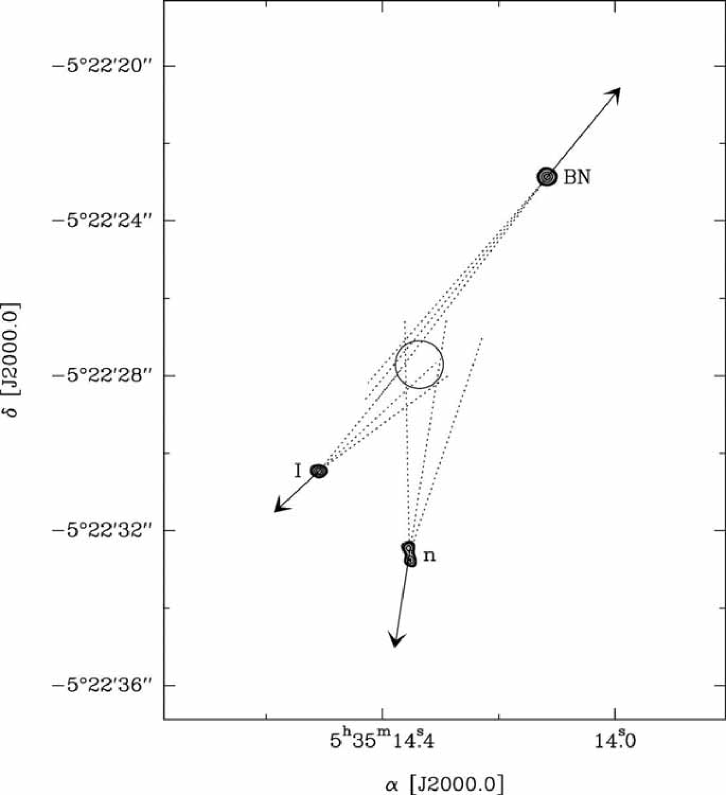
The second apparently disintegrating high mass system concerns the relationship between the B-N object and other high mass protostars or O stars in the central cluster. The relatively high proper motion of the B-N object relative to the cluster was derived first by Plambeck et al. (1995); monitoring of the proper motion of this object using published (Rodríguez et al. 2005; Gómez et al. 2005) and unpublished data have led to two hypotheses on the origin of its motion. Figure 25 compares proper motion diagrams tracing the B-N object back to an origin in two different formation scenarios. Tan (2004) argued this is a recoil motion from the B-N object being ejected from Ori C years ago, while Gómez et al. (2005) argue for a dissolution of the B-N object from the protostellar sources “i” and “n” a few hundred years ago. Either scenario claims to be consistent with the production of the explosive outflow in the K-L region 500-1000 years ago.(see O’Dell et al., Part II). While this outflow is a consequence of the dissolution of the B-N, “i” and “n” system in the Gomez et al. scenario, the hypothesis of Tan is that the B-N triggered the outflow by passing extremely close to source “i.”
Recent high optical/near-IR observations have allowed the detailed orbits of the many multiple high mass systems (see next subsection) to be constrained. These include the recent works by Schertl et al. (2003), Close et al. (2003), Kraus et al. (2007), and Patience et al. (2008). There is, however, an almost complete lack of such high resolution imaging or monitoring of high mass objects outside of the immediate Trapezium core; such observations could be very valuable for better understanding the kinematic history of the high mass stars, their interactions, and the dissolution of higher order systems.
4.3. Multiplicity
The massive members of the ONC have been the target of several studies concerning the multiplicity of these stars. Light curves revealed a number of eclipsing systems (e.g. Parenago & Kukarkin 1947; Hall & Garrison 1969; Lohsen 1975; Wolf 1994), which have been further analyzed to identify additional companions (e.g Vasileiskii & Vitrichenko 2000). Searches for spectroscopic companions were presented by Abt et al. (1991) and Morrell & Levato (1991), who found spectroscopic binary frequencies of 20% – 30%. Studies that detected visual companions to massive ONC members include Padgett et al. (1997), Petr et al. (1998), and Simon et al. (1999). Preibisch et al. (1999) performed a systematic survey for multiple systems among 13 bright ONC members of spectral type O or B with the technique of near-infrared bispectrum speckle interferometry, and complemented the results with information about known spectroscopic companions. In the speckle images, which have a resolution of , eight visual companions were found (see Figure 26). Stellar masses of the companions were estimated from the observed near-infrared flux ratios. The properties of these multiple systems are summarized in Table 5.
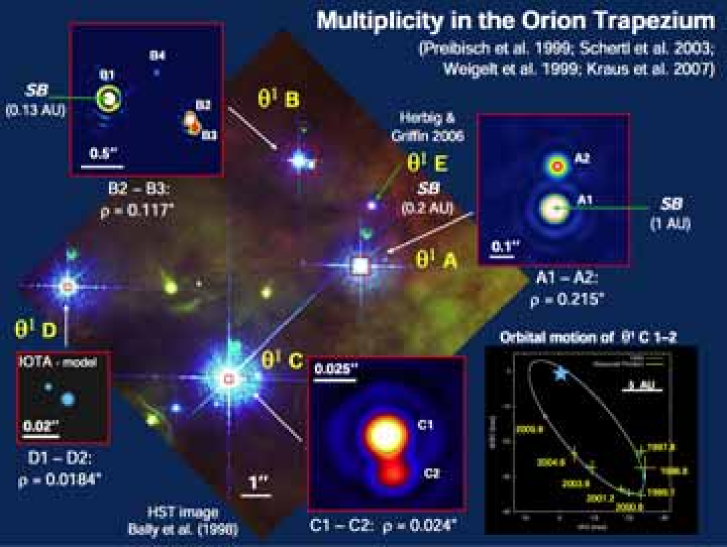
The results of this multiplicity survey allowed general conclusions about the multiplicity of the massive stars in the ONC. The mean number of known companions in the sample of the 13 observed OB stars is per primary star. Since it is highly likely that there are even more, still undetected companions, this is clearly a strict lower limit for the true multiplicity. The multiplicity of these stars is thus considerably (at least about 2 times) higher than that among low-mass primary stars in the general field as well as in the ONC. Multiplicity seems to be a function of spectral type: based on the literature summarized above stars of spectral type B3 or later have, on average, 0.6 known companions per primary, while the stars of spectral type O to B2 have at least 1.5 companions per primary. This comparison clearly suggests a mass-dependence of the multiplicity, which is in qualitative agreement with the generally observed trend of increasing multiplicity with increasing stellar mass seen among low- and intermediate-mass stars. While most low-mass stars may be single (Lada 2006), the data suggest that essentially all high-mass stars are members of higher-order multiple systems (triples, quadruples).
These results point towards a fundamental difference between high- and low-mass stars and support the assumption that the formation of massive stars is not simply a scaled-up version of low-mass star formation Zinnecker & Yorke (2007). Theoretical scenarios for the formation of these massive stars, including stellar interactions, the capture of companions and perhaps even stellar mergers scenarios are discussed in Bonnell et al. (2004); Bonnell & Bate (2005), Moeckel & Bally (2006, 2007a, 2007b), Davies et al. (2006), and Bally & Zinnecker (2005).
In the near future, long-baseline interferometric surveys of the ONC OB stars will allow resolution of companions as close as (0.45 AU). This will largely fill the still existing gap between currently detectable visual and spectroscopic companions and provide much more complete information about the multiplicity of these stars.
| Parenago | Other | Companion | Ref | ||||
|---|---|---|---|---|---|---|---|
| [AU] | |||||||
| 1605 | V 327 Ori | 3.5 | 7 | -2 (spec) | 7 | ||
| 1660 | — | — | 10 | ||||
| 1744 | — | — | 10 | ||||
| 1772 | LP Ori | — | — | 1 | |||
| 1865 | Ori A | 14 | 21 | -2 (vis) | 100 | 2,3 | |
| -3 (spec) | 1 | 4,9 | |||||
| 1863 | Ori B | 7 | 12 | -2 (vis) | 430 | 1,2 | |
| -3 (vis) | 460 | 1,2 | |||||
| -4 (vis) | 260 | 1,5 | |||||
| -5 (spec) | 0.13 | 6 | |||||
| 1891 | Ori C | 34 | 50 | -2 (vis) | 18 | 2,8 | |
| 1889 | Ori D | 16 | -2? (vis) | 8 | 8 | ||
| 1993 | Ori A | 25 | -2 (vis) | 173 | 1 | ||
| -3 (spec) | 0.47 | 6 | |||||
| 2031 | Ori B | — | — | 1 | |||
| 2074 | NU Ori | 14 | -2 (vis) | 214 | 1 | ||
| -3 (spec) | 0.35 | 6 | |||||
| 2284 | — | — | 10 | ||||
| 2271 | HD 37115 | 5 | -2 (vis) | 400 | 1 | ||
| 2366 | — | — | 1 | ||||
| 2425 | 4 | -2 (vis) | 388 | 1 |
4.4. Notes on Individual Trapezium Stars
Ori A; Parenago 1865
(V1016 Ori; HR 1893; HD 37020) The bright westernmost member of the Trapezium, of spectral type B0.5V (Simón-Díaz et al. 2006), was discovered as recently as 1974 to be an eclipsing binary (Lohsen 1975) with a period of 65.43 days and deep primary minima (1); no secondary minima have been seen with certainty. Early attempts to model the system include Bossi et al. (1989), Vitrichenko et al. (1998) and Vitrichenko (1999). Optical and ultraviolet spectra are analyzed in Vitrichenko & Klochkova (2000), Vitrichenko (2001) and Vitrichenko & Plachinda (2001). Stickland & Lloyd (1999) review and analyze existing data up to that time, deriving masses of 12 and 3 for the eclipsing pair. Bondar’ et al. (2000) analyzed new light curves, and Vitrichenko & Plachinda (2001) suggested that the components have masses of 21 and 3.9 . A primary mass of and a mass ratio seems a reasonable summary of recent findings. A third star (A2) at separation has been found next to Ori A1,3 by Petr et al. (1998); in the near-IR its flux ratio to the eclipsing primary suggests a reddened A or F type pre-main sequence star. Radio continuum observations of V 1016 Ori at 2 and 6 cm (Churchwell et al. 1987; Felli et al. 1989, 1991, 1993b) reveal a variable non-thermal source now confidently associated with this visual secondary (Petr et al. 1998; Petr-Gotzens & Massi 2007); the system is unresolved in Chandra data. Various explanations for this radio emission have been proposed, including wind-wind collisions. Orbital motion between A2 and the eclipsing primary A1,3 has been observed through multi-epoch observations over a 7 year period (Close et al. 2003; Schertl et al. 2003).
Ori B; Parenago 1863
(BM Ori; HR 1894; HD 37021) This source consists of at least 5 stars but possibly as many as 7. The long-known visual companion, at a separation of about from the primary Ori B1, is clearly resolved into a close () binary ( B2,3). At least one member of the B2,3 system is a proplyd, source identifier 160-307 (note that O’Dell & Wong (1996) gave this source the identifier 161-307 and considered it stellar); both appear extended in the bispectrum band images of Schertl et al. (2003); one of them drives a microjet (HH 508) (Bally et al. 2000); in the thermal infrared, the Ori B2,3 system dominates the B1 primary (Lada et al. 2004; Smith et al. 2005). This system is also the dominant X-ray source and exhibits all the features of typical solar mass T Tauri stars including multiple flares (Stelzer et al. 2005). Another faint visual companion, Ori B4, is located from the primary star (Simon et al. 1999). The primary, Ori B1, is itself an eclipsing binary with a period of 6.46 days; early observations are discussed by Hartwig (1921a, b), Parenago & Kukarkin (1947) and Schneller (1948). A near-IR light curve is shown in Figure 28 (Sect. 5.1.). This system is also a double-lined spectroscopic binary, so masses and radii of the two components can be derived. The primary is a B3 star. Hall & Garrison (1969) obtained a detailed light curve, demonstrating that the primary eclipse is total with a duration of 9 hours, and finding a shallow second minimum. Spectra obtained by Popper & Plavec (1976) revealed that the secondary component is a late A-type star. A primary mass of and a mass ratio is adopted for this system. New light curves obtained by Wolf (1994) were analyzed by Vasileiskii & Vitrichenko (2000), who suggested that there is a third (B type) star in the primary Ori B1,5 system that is not involved in the eclipse, but affects the spectra observed. Vitrichenko et al. (2006) found a fourth, late-type component in the primary system based on a radial velocity anomaly (Popper & Plavec 1976; Vitrichenko & Klochkova 2004). Ultraviolet spectra by Vitrichenko & Malov (2006) detected high-velocity outflowing gas in the system. The position of the COUP X-ray source (COUP 778) is adopted for B1 because the Chandra images provide the best-resolution observations with a wide field astrometric reference frame.
Ori C; Parenago 1891
(HR 1895; HD 37022) The most massive star in the ONC, is an extremely close visual binary system with an initial discovery of the companion at a separation of by Weigelt et al. (1999). Schertl et al. (2003) subsequently reported the detection of orbital motion. Kraus et al. (2007) and Patience et al. (2008) report recent multi-epoch observations with visual and near-infrared bispectrum speckle and near-infrared long-baseline interferometry. The current data trace the orbital motion of the companion over a more than 10-year period and cover a significant part of its orbit. Kraus et al. (2007) derived a highly eccentric orbit with a period of 10.9 yrs and a total mass of with the primary being a O5.5 star and the companion a O9.5 star. The addition of 6 epochs over a baseline of a year by Patience et al. (2008) suggest a longer period , a less eccentric orbit and a somewhat lower total mass .
Another source projected very close to Ori C is a mid-infrared source found West of the O star. A ring-like structure around this object is evident in thermal and mid-IR images (Lada et al. 2004; Smith et al. 2005) and it is a VLA radio source. Source identifiers for this object include VLA-16 (Felli et al. 1993b), SC3 (Hayward et al. 1994), the band source #268 (Lada et al. 2004), and the mid-IR identifiers MAX 106 (Robberto et al. 2005) and 163-323 (Smith et al. 2005). The spectral energy distribution of VLA-16 was modeled as an irradiated proplyd by Robberto et al. (2002), though it is not entirely clear where the source lies along the line of sight.
Additional radial velocity components that do not turn out to correspond to this binary pair were reported by Vitrichenko (2002). Understanding such radial velocity variations in Ori C is complicated by the source’s strong magnetic activity, its stellar winds and a 15 day periodicity apparent in radio and radial velocity monitoring. These winds and strong magnetic field have been investigated by Walborn & Nichols (1994), Stahl et al. (1996), Donati et al. (2002), Gagné et al. (2005), (Stelzer et al. 2005), (Simón-Díaz et al. 2006), Wade et al. (2006), and most recently Stahl et al. (2008).
Ori D; Parenago 1889
(HR 1896; HD 37023) The second most massive primary in the Trapezium has a B0.5V type and a mass of (Simón-Díaz et al. 2006). The source displays a constant soft X-ray spectrum (lacking flares or hybrid spectra) (Stelzer et al. 2005), suggesting it is neither magnetic nor contains a low mass companion. While Kraus et al. (2007) found evidence in the UV plane for a companion at 8 AU separation, having of the luminosity of the primary, they also point out this could be the result of a disk’s inner edge. Ori D is surrounded on 2 sides by the Ney & Allen nebula (Ney & Allen 1969; McCaughrean & Gezari 1990), a 10-20 micron diffuse structure whose origin is unclear. Robberto et al. (2005) present evidence that this dust arc cannot originate simply from the ionizing photons of Ori C but requires a wind from Ori D and a substantial reservoir of dust, which they infer to arise in a disk. On the other hand, Smith et al. (2005) propose that the dust shell is the result of the winds of Ori D interacting with the PDR as it plows down into the remnant molecular cloud (O’Dell 2001).
Ori E; Parenago 1864
The fifth brightest member of the Trapezium is Ori E, a very strong X-ray source, the second-strongest in the central cluster after Ori C (Ku et al. 1982). Felli et al. (1993a, b) found the star to be a bright and variable non-thermal radio continuum source at 2 and 6 cm. In a new detailed study, Herbig & Griffin (2006) (see also Costero et al. 2006) discovered that Ori E is a double-lined spectroscopic binary consisting of two essentially identical mid-G-type components orbiting with a period of 9.89 days. This is a revision of the lower quality G+B5-B8 spectral type tabulated for component E in the Parenago (1954a), Hillenbrand (1997), and Luhman et al. (2000) catalogs but originating from observations by Herbig (1950). Herbig & Griffin also summarize clues that suggest significant optical variability of this system over the past 200 years.
Ori F; Parenago 1892
Component F is a bright point source SE (PA=) of Ori C, appearing as a blue star in Figure 26 (see also 23); it was assigned a spectral type B8 by Herbig (1950). There are, however, no subsequent published observations to confirm the spectral type of this star. Existing high angular resolution studies imply this star is solitary down to a separation of 60 AU (Petr et al. 1998; Simon et al. 1999), which could perhaps explain why it is X-ray quiet (Stelzer et al. 2005).
Regarding Components G, H
During nineteenth century observations of the Trapezium, two additional sources within the Trapezium received designations as components of Ori . Components G and H are now known to be proplyds (See O’Dell et al., Part II) corresponding to sources 2 and 3 of Laques & Vidal (1979).
5. Variable Stars
Photometric variability is a traditional technique for identifying young members of a known star forming region. Other methods such as kinematics (proper motions and radial velocities), presence of lithium in the photosphere, and stellar/circumstellar activity exhibited as X-ray emission, UV and optical emission lines, and/or infrared excess have also been used. This section concentrates on variability as a young star selection technique applied to Orion, in order to both provide historical perspective and connect to modern questions.
| Year | Author | Region | Filter | Phot? | P(days) | Obs. | ||
|---|---|---|---|---|---|---|---|---|
| 1990 | Walker | ONC | V | Y | 5 | 4 | 0.4-3 | Lick |
| 1991 | Mandel | Trap. | N | 7 | 6-14 | VVO | ||
| 1992 | Attridge | N | 525 | 35 | 2-17 | VVO | ||
| 1995 | Eaton | Trap. | N | 126 | 11 | 2-35 | VVO | |
| 1996 | Choi | N | 525 | 50 | 2-20 | VVO | ||
| 1999 | Stassun | Y | 2279 | 254 | 0.5-10 | Multiple | ||
| 2000 | Herbst | N | 500 | 134 | 2-35 | VVO | ||
| 2001 | Carpenter | Orion A | Y | 17808 | 233 | 2-12 | 2MASS(S) | |
| 2001 | Rebull | Y | 3585 | 281 | 0.5-20 | MacDonald | ||
| 2002 | Herbst | Y | 1562 | 369 | 1-22 | La Silla | ||
| 2006 | Stassun | COUP | N | 814 | n.p. | n.p. | Multiple | |
| 2007 | Marilli | Orion | Y | 40 | 39 | 0.5-13 | Multiple | |
| 2007 | Irwin | Y | 2500 | n.p. | n.p. | INT |
5.1. Optical & Infrared Variable Stars
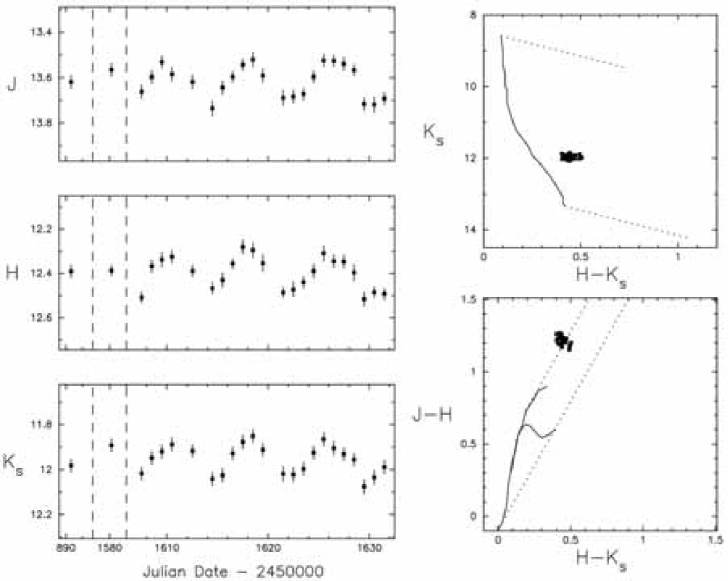
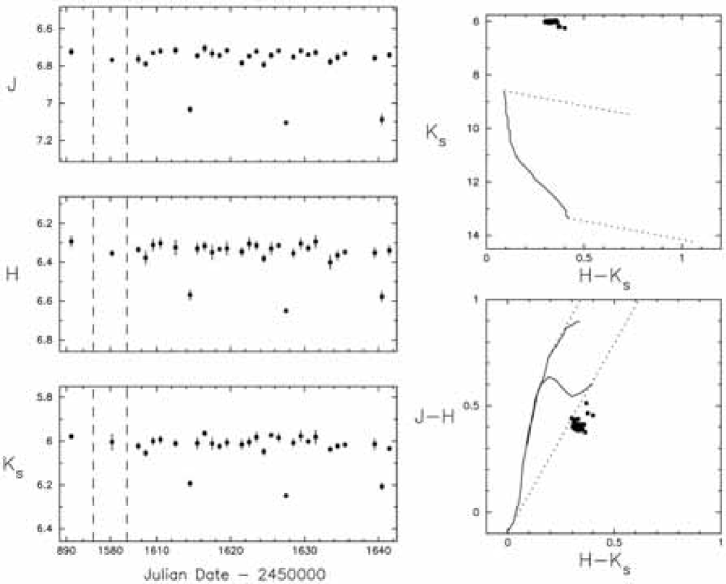
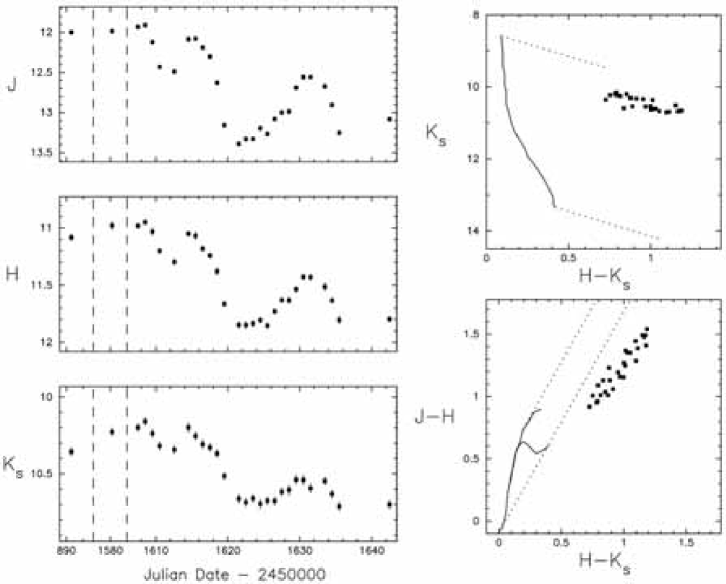
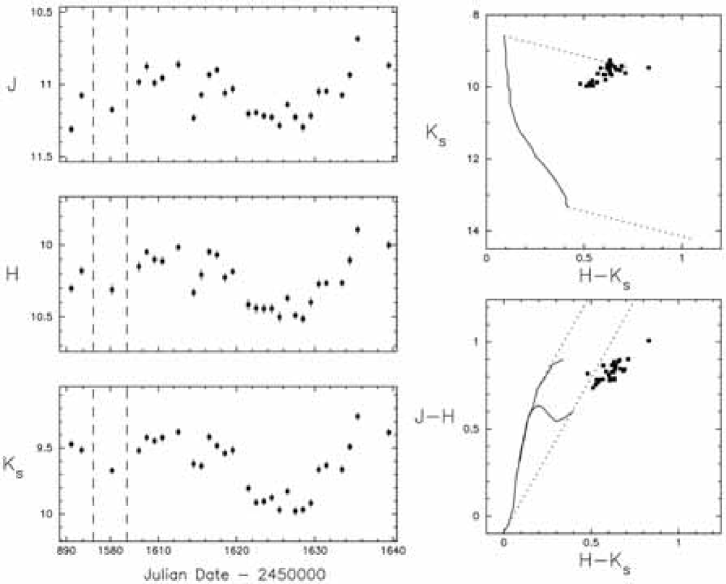
Historic Studies
The Orion Nebula Cluster is a rich collection of variable stars. According to Herbig (1982) the first variable star identified within the Orion Nebula was found by W.C. Bond in or around 1848, and is now known as AF Ori (Herbig 1982). Herbig notes in 1982 that in addition to the known eclipsing binary members of the Trapezium itself ( Ori A and Ori B) there were 17 named variables within the inner Orion Nebula Cluster (Trapezium region) and several hundred within the larger nebula. This area is known today to contain several thousand young stars, the vast majority of which are known variables based on modern optical CCD or infrared array monitoring surveys with the cadence and sensitivity to detect them.
The first extensive catalog of variable stars in (and near) the Nebula was derived (pretty much solely) by H. S. Leavitt using a large number () of plates in the Harvard collection. The catalog was published subsequently in Pickering & Leavitt (1904); it included approximately 70 variables and 30 suspected variables with minimum and maximum brightness quoted. Additional notable variable identification work was performed by Brun (1935), Rosino (1946, 1956) and by Parenago & Kukarkin (1947)666Another significant study performed by P. P. Parenago was the development of the General Catalog of Suspected Variables with B. V. Kukarkin. These and other stars were followed up spectroscopically, by e.g. Greenstein & Struve (1946), Herbig (1950), and Haro (1953). The analogy to “the objects of Joy” (1945), variable emission-line stars associated with bright or dark nebulosities and now known as T Tauri stars, was debated in these early works on the Orion variables, and eventually they were accepted as such, especially following photoelectric photometry studies such as that of Walker (1969).
With improved technology, the variability could not only be identified and crudely characterized, but monitored in detail. Walker (1990) undertook the first comprehensive study of rotational flux modulation in the Orion population, following up his earlier work on rotational broadening of spectral lines. He sought differences between the “weak” and “classical” emission stars as well as to understand the periods and nature of the surface disturbances causing the rotational modulation. He reported results on 5 stars.
Modern Monitoring Surveys
With the advent of CCD detectors variability could be monitored and quantified for large numbers of members rather than just individual stars. In particular, there was interest in searching for periodic variables. Soon following the Walker (1990) paper was a series of papers by Herbst and collaborators (Mandel & Herbst 1991; Attridge & Herbst 1992; Eaton et al. 1995; Choi & Herbst 1996). Table 6 documents and compares the results from these modern survey beginning with Walker (1990). These works built up a database of periods in the Orion Nebula Cluster and presented the angular velocity distribution for the young stellar population. Of great interest was an apparent bimodal period distribution, which was interpreted in the context of “disk locking” whereby the slow rotators (with periods around 8 days) were assumed to be kept rotating slowly due to interaction between the stellar magnetosphere and the Keplerian accretion disk, while the more rapid rotators (with periods around 3 days) were assumed free of such disk interactions. The gap or valley in the period distribution was interpreted as rapid evolution between the disk-regulated to disk-free scenarios.
Additional work on optical (Stassun et al. 1999; Herbst et al. 2000; Rebull 2001; Herbst et al. 2001, 2002; Stassun et al. 2006b, 2007b; Marilli et al. 2007; Irwin et al. 2007) and infrared (Carpenter et al. 2001) variability broadened the discussion considerably. Included were not only the periodic stars with either cool spots (due to photospheric inhomogeneities) or hot spots (due to accretion columns), but also eclipsing systems, and irregular variables dominated by accretion or extinction effects. Herbst et al. (2002) claim that essentially every star (of 1500 monitored) is optically variable at the 1% level with half of the stars having peak-to-peak brightness variables at I-band larger than 0.2 mag. Carpenter et al. (2001) found the same mean peak-to-peak amplitudes at near-infrared wavelengths.
The mass dependence and the activity/disk dependence of the periodicity was discussed explicitly in several of the above works as well as in Stassun et al. (2001, 2004a, 2006b) and Rebull et al. (2006). As a result of the young age and large amount of available rotation data, the ONC has become the de facto cluster setting the initial conditions for models of stellar angular momentum evolution. A compendium of the literature for the Orion Nebula and flanking field periodic stars is provided by Rebull et al. (2006). Their results on variation in near-IR color with periodicity and long term irregularity provide clues to the origin of the variability, whether it be from time variable hot spots, from changes in line of sight extinction or due to changes in the geometry and rate of mass accretion. Near-IR light curves that illustrate different kinds of longer term variability are given in Figures 28 and 28.
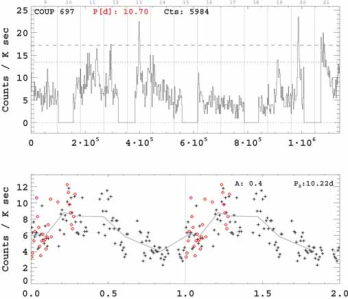
5.2. X-ray Flares and Rotational Modulation of Variable Stars in Orion
Concerning the geometry of the magnetic structures producing X-ray emission of T Tauri stars, solar-type coronal loops associated with multi-polar fields rooted in the stellar surface are probably the dominant source of the observed X-ray emission. The analyses of simultaneous optical and X-ray data for about 800 COUP stars show that optical and X-ray variability are very rarely time correlated (Stassun et al. 2006b), but the strong correlation between optical variability and X-ray luminosity is present (Stassun et al. 2007b). This fits into the picture in which sights of optical variability may represent footprints of X-ray emitting coronal magnetic structures of complex magnetic topologies. Studying 233 Orion-COUP PMS stars with known rotational periods, Flaccomio et al. (2005) detected X-ray rotational modulation in 16 stars, indicating that the stellar surface has similar inhomogeneities in their photospheres and their coronae; it also suggests that the coronae in these cases are relatively compact ). An example of X-ray rotational modulation with the optical period is shown in Figure 29 for COUP source #697. In 7 other cases, Flaccomio et al. (2005) find X-ray periods equal to half of the optical periods, suggesting two bright hemispheres in the X-ray corona. But for a number of COUP stars with very powerful and hot (peak temperatures MK) flares, Favata et al. (2005) derive the length of the magnetic structures to be much greater than the stellar radius. These structures are probably too large to be stable, particularly to centrifugal forces as the star rotates, in a solar-type geometry. They most likely extend from the star to the inner edge of a protoplanetary disk.
Acknowledgements. Bo Reipurth provided numerous suggestions and
comments that added to the breadth and detail of this review. We thank
David Mihalyfy for Russian translations of the Parenago text and Laura
Nasrallah for translations of early 20th century German texts. We
acknowledge Robert Gendler for permitting the reproduction of his
large scale image of the northern Orion A cloud shown in Figure 1.
This research has made use of NASA’s Astrophysics Data System, the
SIMBAD database, operated at CDS, Strasbourg, France and SAOImage DS9,
developed by the Smithsonian Astrophysical Observatory.
References
- Abt & Levato (1977) Abt, H. A. & Levato, H. 1977, PASP, 89, 797
- Abt et al. (1970) Abt, H. A., Muncaster, G. W., & Thompson, L. A. 1970, AJ, 75, 1095
- Abt et al. (1991) Abt, H. A., Wang, R., & Cardona, O. 1991, ApJ, 367, 155
- Aitken (1932) Aitken, R. G. 1932, New general catalogue of double stars within 120 of the North pole … (Washington, D.C.: Carnegie Institution of Washington)
- Ali & Depoy (1995) Ali, B. & Depoy, D. L. 1995, AJ, 109, 709
- Allen et al. (1974) Allen, C., Poveda, A., & Worley, C. E. 1974, Rev. Mexicana Astron. Astrofisica, 1, 101
- Allen et al. (2004) Allen, C., Poveda, A., & Hernández-Alcántara, A. 2004, in Rev. Mexicana Astron. Astrofisica Conf. Ser. 21: The Environment and Evolution of Double and Multiple Stars, Proceedings of IAU Colloquium 191, ed. C. Allen & C. Scarfe, 195
- Ambartsumian (1955) Ambartsumian, V. A. 1955, The Observatory, 75, 72
- Andrews & Grossie (1981) Andrews, A. D. & Grossie, H. H. R. 1981, A photometric atlas of the Orion Nebula (Armagh: Armagh Observatory)
- Anthony-Twarog (1982) Anthony-Twarog, B. J. 1982, AJ, 87, 1213
- Attridge & Herbst (1992) Attridge, J. M. & Herbst, W. 1992, ApJ, 398, L61
- Baade & Minkowski (1937) Baade, W. & Minkowski, R. 1937, ApJ, 86, 119
- Babel & Montmerle (1997) Babel, J. & Montmerle, T. 1997, A&A, 323, 121
- Bally et al. (1987) Bally, J., Stark, A. A., Wilson, R. W., & Langer, W. D. 1987, ApJ, 312, L45
- Bally et al. (2000) Bally, J., O’Dell, C. R., & McCaughrean, M. J. 2000, AJ, 119, 2919
- Bally & Zinnecker (2005) Bally, J. & Zinnecker, H. 2005, AJ, 129, 2281
- Bate et al. (1998) Bate, M. R., Clarke, C. J., & McCaughrean, M. J. 1998, MNRAS, 297, 1163
- Becklin et al. (1976) Becklin, E. E., Neugebauer, G., Beckwith, S., Gatley, I., Matthews. K., et al. 1976, ApJ, 207, 770
- Beichman et al. (1978) Beichman, C. A., Dyck, H. M., & Simon, T. 1978, A&A, 62, 261
- Blaauw (1946) Blaauw, A. 1946, Pub. Kapteyn Astron. Lab. Groningen, 52, 1
- Blaauw (1961) —. 1961, Bull. Astron. Inst. Netherlands, 15, 265
- Blaauw (1964) —. 1964, ARA&A, 2, 213
- Blaauw & Morgan (1953) Blaauw, A. & Morgan, W. W. 1953, Bull. Astron. Inst. Netherlands, 12, 76
- Blaauw & Morgan (1954) —. 1954, ApJ, 119, 625
- Blanco (1963) Blanco, V. M. 1963, ApJ, 137, 513
- Blitz & Shu (1980) Blitz, L. & Shu, F. H. 1980, ApJ, 238, 148
- Bond (1867) Bond, G. P. 1867, Annals Harvard College Obs., 5, 1
- Bondar’ et al. (2000) Bondar’, N. I., Vitrichenko, É. A., & Zakirov, M. M. 2000, Astron. Letters, 26, 452
- Bonnell & Bate (2005) Bonnell, I. A. & Bate, M. R. 2005, MNRAS, 362, 915
- Bonnell et al. (2004) Bonnell, I. A., Vine, S. G., & Bate, M. R. 2004, MNRAS, 349, 735
- Borgman & Blaauw (1964) Borgman, J. & Blaauw, A. 1964, Bull. Astron. Inst. Netherlands, 17, 358
- Bossi et al. (1989) Bossi, M., Gaspani, A., Scardia, M., & Tadini, M. 1989, A&A, 222, 117
- Bouy et al. (2008) Bouy, H., Kolb, J., Marchetti, E., Martín, E. L., Huélamo, N., et al. 2008, A&A, 477, 681
- Bradt & Kelley (1979) Bradt, H. V. & Kelley, R. L. 1979, ApJ, 228, L33
- Brand & Wouterloot (1991) Brand, J. & Wouterloot, J. G. A. 1991, in Low Mass Star Formation in Southern Molecular Clouds, ed. B. Reipurth, ESO Scientific Reports No. 11, 1
- Breger et al. (1981) Breger, M., Gehrz, R. D., & Hackwell, J. A. 1981, ApJ, 248, 963
- Brown (1996) Brown, A. G. A. 1996, PhD thesis, Leiden, (1996)
- Brown et al. (1999) Brown, A. G. A., Blaauw, A., Hoogerwerf, R., de Bruijne, J. H. J., & de Zeeuw, P. T. 1999, in NATO ASIC Proc. 540: The Origin of Stars and Planetary Systems, ed. C. J. Lada & N. D. Kylafis (Dordrecht: Kluwer Academic), 411
- Brown et al. (1994) Brown, A. G. A., de Geus, E. J., & de Zeeuw, P. T. 1994, A&A, 289, 101
- Brun (1935) Brun, A. 1935, Pub. Obs. Lyon, 1, 12
- Caillault et al. (1994) Caillault, J.-P., Gagné, M., & Stauffer, J. R. 1994, ApJ, 432, 386
- Caramazza et al. (2007) Caramazza, M., Flaccomio, E., Micela, G., Reale, F., Wolk, S. J., & Feigelson, E. D. 2007, A&A, 471, 645
- Cargile et al. (2008) Cargile, P. A., Stassun, K. G., & Mathieu, R. D. 2008, ApJ, 674, 329
- Carpenter et al. (2001) Carpenter, J. M., Hillenbrand, L. A., & Skrutskie, M. F. 2001, AJ, 121, 3160
- Choi & Herbst (1996) Choi, P. I. & Herbst, W. 1996, AJ, 111, 283
- Churchwell et al. (1987) Churchwell, E., Wood, D. O. S., Felli, M., & Massi, M. 1987, ApJ, 321, 516
- Cieza & Baliber (2007) Cieza, L. & Baliber, N. 2007, ApJ, 671, 605
- Close et al. (2003) Close, L. M., Wildi, F., Lloyd-Hart, M., Brusa, G., Fisher, D., et al. 2003, ApJ, 599, 537
- Cohen & Kuhi (1979) Cohen, M. & Kuhi, L. V. 1979, ApJS, 41, 743
- Costero et al. (2006) Costero, R., Echevarria, J., Richer, M. G., Poveda, A., & Li, W. 2006, IAU Circulars, 8669, 2
- Cox (2000) Cox, A. N., ed. 2000, Allen’s Astrophysical Quantities 4th ed. (New York: AIP Press; Springer)
- Cunha & Smith (2005) Cunha, K. & Smith, V. V. 2005, ApJ, 626, 425
- Cunha et al. (1995) Cunha, K., Smith, V. V., & Lambert, D. L. 1995, ApJ, 452, 634
- Cunha et al. (1998) —. 1998, ApJ, 493, 195
- D’Antona & Mazzitelli (1994) D’Antona, F. & Mazzitelli, I. 1994, ApJS, 90, 467
- D’Antona & Mazzitelli (1997) —. 1997, Mem. della Soc. Astron. Italiana, 68, 807
- D’Antona et al. (2000) D’Antona, F., Ventura, P., & Mazzitelli, I. 2000, ApJ, 543, L77
- Davies et al. (2006) Davies, M. B., Bate, M. R., Bonnell, I. A., Bailey, V. C., & Tout, C. A. 2006, MNRAS, 370, 2038
- de Zeeuw et al. (1999) de Zeeuw, P. T., Hoogerwerf, R., de Bruijne, J. H. J., Brown, A. G. A., & Blaauw, A. 1999, AJ, 117, 354
- Donati et al. (2002) Donati, J.-F., Babel, J., Harries, T. J., Howarth, I. D., Petit, P., & Semel, M. 2002, MNRAS, 333, 55
- Duncan (1993) Duncan, D. K. 1993, ApJ, 406, 172
- Duncan & Rebull (1996) Duncan, D. K. & Rebull, L. M. 1996, PASP, 108, 738
- Duncan et al. (1991) Duncan, D. K., Vaughan, A. H., Wilson, O. C., Preston, G. W., Frazer, J., et al. 1991, ApJS, 76, 383
- Duquennoy & Mayor (1991) Duquennoy, A. & Mayor, M. 1991, A&A, 248, 485
- Eaton et al. (1995) Eaton, N. L., Herbst, W., & Hillenbrand, L. A. 1995, AJ, 110, 1735
- Edwards et al. (1993) Edwards, S., Strom, S. E., Hartigan, P., Strom, K. M., Hillenbrand, L. A., et al. 1993, AJ, 106, 372
- Eisner & Carpenter (2006) Eisner, J. A. & Carpenter, J. M. 2006, ApJ, 641, 1162
- Eisner et al. (2008) Eisner, J. A., Plambeck, R. L., Carpenter, J. M., Corder, S. A., Qi, C., et al. 2008, ArXiv e-prints, 0803.3217
- Fallon et al. (1977) Fallon, F. W., Gerola, H., & Sofia, S. 1977, ApJ, 217, 719
- Favata et al. (2005) Favata, F., Flaccomio, E., Reale, F., Micela, G., Sciortino, S., et al. 2005, ApJS, 160, 469
- Fazio et al. (1974) Fazio, G. G., Kleinmann, D. E., Noyes, R. W., Wright, E. L., Zeilik, II, M., & Low, F. J. 1974, ApJ, 192, L23+
- Feigelson (2005) Feigelson, E. D. 2005, in ESA SP-560: Cool Stars, Stellar Systems & the Sun 13, ed. F. Favata (ESA), 175
- Feigelson et al. (2002a) Feigelson, E. D., Broos, P., Gaffney, III, J. A., Garmire, G., Hillenbrand, L. A., et al. 2002a, ApJ, 574, 258
- Feigelson et al. (2002b) Feigelson, E. D., Garmire, G. P., & Pravdo, S. H. 2002b, ApJ, 572, 335
- Feigelson et al. (2003) Feigelson, E. D., Gaffney, III, J. A., Garmire, G., Hillenbrand, L. A., & Townsley, L. 2003, ApJ, 584, 911
- Feigelson et al. (2005) Feigelson, E. D., Getman, K., Townsley, L., Garmire, G., Preibisch, T., et al. 2005, ApJS, 160, 379
- Felli et al. (1989) Felli, M., Massi, M., & Churchwell, E. 1989, A&A, 217, 179
- Felli et al. (1991) Felli, M., Massi, M., & Catarzi, M. 1991, A&A, 248, 453
- Felli et al. (1993a) Felli, M., Churchwell, E., Wilson, T. L., & Taylor, G. B. 1993a, A&AS, 98, 137
- Felli et al. (1993b) Felli, M., Taylor, G. B., Catarzi, M., Churchwell, E., & Kurtz, S. 1993b, A&AS, 101, 127
- Flaccomio et al. (2003a) Flaccomio, E., Damiani, F., Micela, G., Sciortino, S., Harnden, Jr., F. R., Murray, S. S., & Wolk, S. J. 2003a, ApJ, 582, 382
- Flaccomio et al. (2003b) —. 2003b, ApJ, 582, 398
- Flaccomio et al. (2005) Flaccomio, E., Micela, G., Sciortino, S., Feigelson, E. D., Herbst, W., Favata, F., Harnden, Jr., F. R., & Vrtilek, S. D. 2005, ApJS, 160, 450
- Fűrész et al. (2008) Fűrész, G., Hartmann, L. W., Megeath, S. T., Szentgyorgyi, A. H., & Hamden, E. T. 2008, ApJ, 676, 1109
- Gagné et al. (1995) Gagné, M., Caillault, J.-P., & Stauffer, J. R. 1995, ApJ, 445, 280
- Gagné et al. (2005) Gagné, M., Oksala, M. E., Cohen, D. H., Tonnesen, S. K., ud-Doula, A., Owocki, S. P., Townsend, R. H. D., & MacFarlane, J. J. 2005, ApJ, 628, 986
- Garay et al. (1987) Garay, G., Moran, J. M., & Reid, M. J. 1987, ApJ, 314, 535
- Garmire et al. (2000) Garmire, G., Feigelson, E. D., Broos, P., Hillenbrand, L. A., Pravdo, S, H., et al. 2000, AJ, 120, 1426
- Gehrz et al. (1975) Gehrz, R. D., Hackwell, J. A., & Smith, J. R. 1975, ApJ, 202, L33
- Geier et al. (1995) Geier, S., Wendker, H. J., & Wisotzki, L. 1995, A&A, 299, 39
- Genzel & Stutzki (1989) Genzel, R. & Stutzki, J. 1989, ARA&A, 27, 41
- Genzel et al. (1981) Genzel, R., Reid, M. J., Moran, J. M., & Downes, D. 1981, ApJ, 244, 884
- Getman et al. (2005a) Getman, K. V., Feigelson, E. D., Grosso, N., McCaughrean, M. J., Micela, G., et al. 2005a, ApJS, 160, 353
- Getman et al. (2005b) —. 2005b, VizieR Online Data Catalog
- Getman et al. (2005c) Getman, K. V., Flaccomio, E., Broos, P. S., Grosso, N., Tsujimoto, M., et al. 2005c, ApJS, 160, 319
- Gezari et al. (1998) Gezari, D. Y., Backman, D. E., & Werner, M. W. 1998, ApJ, 509, 283
- Giacconi et al. (1972) Giacconi, R., Murray, S., Gursky, H., Kellogg, E., Schreier, E., & Tananbaum, H. 1972, ApJ, 178, 281
- Gies & Bolton (1986) Gies, D. R. & Bolton, C. T. 1986, ApJS, 61, 419
- Glassgold et al. (2005) Glassgold, A. E., Feigelson, E. D., Montmerle, T., & Wolk, S. 2005, in ASP Conf. Ser. 341: Chondrites and the Protoplanetary Disk, ed. A. N. Krot, E. R. D. Scott, & B. Reipurth (San Francisco: ASP), 165
- Glassgold et al. (1982) Glassgold, A. E., Huggins, P. J., & Schucking, E. L., ed. 1982, Annals of the New York Academy of Sciences 395: Symposium on The Orion Nebula To Honor Henry Draper, (New York: The New York Academy of Sciences)
- Gómez et al. (2005) Gómez, L., Rodríguez, L. F., Loinard, L., Lizano, S., Poveda, A., et al., C. 2005, ApJ, 635, 1166
- Gomez & Lada (1998) Gomez, M. & Lada, C. J. 1998, AJ, 115, 1524
- Greenhill et al. (1998) Greenhill, L. J., Gwinn, C. R., Schwartz, C., Moran, J. M., & Diamond, P. J. 1998, Nat, 396, 650
- Greenhill et al. (2004a) Greenhill, L. J., Gezari, D. Y., Danchi, W. C., Najita, J., Monnier, J. D., et al. 2004a, ApJ, 605, L57
- Greenhill et al. (2004b) Greenhill, L. J., Reid, M. J., Chandler, C. J., Diamond, P. J., & Elitzur, M. 2004b, in IAU Symposium 221: Star Formation at High Angular Resolution, ed. M. Burton, R. Jayawardhana, & T. Bourke, 155
- Greenstein & Struve (1946) Greenstein, J. L. & Struve, O. 1946, PASP, 58, 366
- Grosso et al. (2006) Grosso, N., Feigelson, E. D., Getman, K. V., Kastner, J. H., Bally, J., et al. 2006, A&A, 448, L29
- Grosso et al. (2005) Grosso, N., Feigelson, E. D., Getman, K. V., Townsley, L., Broos, P., et al. 2005, ApJS, 160, 530
- Gualandris et al. (2004) Gualandris, A., Portegies Zwart, S., & Eggleton, P. P. 2004, MNRAS, 350, 615
- Hall & Garrison (1969) Hall, D. S. & Garrison, Jr., L. M. 1969, PASP, 81, 771
- Haro (1953) Haro, G. 1953, ApJ, 117, 73
- Hartwig (1921a) Hartwig, E. 1921a, Astron. Nachrichten, 212, 229
- Hartwig (1921b) —. 1921b, Astron. Nachrichten, 212, 383
- Hayward (1994) Hayward, T. L. 1994, ApJ, 429, 726
- Hayward et al. (1994) Hayward, T. L., Houck, J. R., & Miles, J. W. 1994, ApJ, 433, 157
- Hendry et al. (1993) Hendry, M. A., O’Dell, M. A., & Collier-Cameron, A. 1993, MNRAS, 265, 983
- Herbig (1950) Herbig, G. H. 1950, ApJ, 111, 15
- Herbig (1982) —. 1982, in the Annals of the New York Academy of Sciences 395: Symposium on The Orion Nebula To Honor Henry Draper, ed. Glassgold, A. E., Huggins, P. J., & Schucking, E. L. (New York: The New York Academy of Sciences), 64
- Herbig & Bell (1988) Herbig, G. H. & Bell, K. R. 1988, Catalog of Emission Line Stars of the Orion Population : 3 : 1988 Lick Observatory Bulletin No. 111, (Santa Cruz: Lick Observatory)
- Herbig & Griffin (2006) Herbig, G. H. & Griffin, R. F. 2006, AJ, 132, 1763
- Herbig & Terndrup (1986) Herbig, G. H. & Terndrup, D. M. 1986, ApJ, 307, 609
- Herbst et al. (2001) Herbst, W., Bailer-Jones, C. A. L., & Mundt, R. 2001, ApJ, 554, L197
- Herbst et al. (2002) Herbst, W., Bailer-Jones, C. A. L., Mundt, R., Meisenheimer, K., & Wackermann, R. 2002, A&A, 396, 513
- Herbst et al. (2000) Herbst, W., Rhode, K. L., Hillenbrand, L. A., & Curran, G. 2000, AJ, 119, 261
- Hernández et al. (2005) Hernández, J., Calvet, N., Hartmann, L., Briceño, C., Sicilia-Aguilar, A., & Berlind, P. 2005, AJ, 129, 856
- Hillenbrand (1997) Hillenbrand, L. A. 1997, AJ, 113, 1733
- Hillenbrand & Carpenter (2000) Hillenbrand, L. A. & Carpenter, J. M. 2000, ApJ, 540, 236
- Hillenbrand & Hartmann (1998) Hillenbrand, L. A. & Hartmann, L. W. 1998, ApJ, 492, 540
- Hillenbrand et al. (1998) Hillenbrand, L. A., Strom, S. E., Calvet, N., Merrill, K. M., Gatley, I., et al. 1998, AJ, 116, 1816
- Hirota et al. (2007) Hirota, T., Bushimata, T., Choi, Y. K., Honma, M., Imai, H., et al. 2007, PASJ, 59, 897
- Høg et al. (2000) Høg, E., Fabricius, C., Makarov, V. V., Urban, S., Corbin, T., et al. 2000, A&A, 355, L27
- Holden (1882) Holden, E. 1882, Washington Astron. Obs, 1878, Monograph on the Central Parts of the Nebula of Orion, 18, Appendix 1.
- Hoogerwerf et al. (2000) Hoogerwerf, R., de Bruijne, J. H. J., & de Zeeuw, P. T. 2000, ApJ, 544, L133
- Hoogerwerf et al. (2001) —. 2001, A&A, 365, 49
- Hyland et al. (1984) Hyland, A. R., Allen, D. A., Barnes, P. J., & Ward, M. J. 1984, MNRAS, 206, 465
- Iben & Talbot (1966) Iben, I. J. & Talbot, R. J. 1966, ApJ, 144, 968
- Imanishi et al. (2001) Imanishi, K., Koyama, K., & Tsuboi, Y. 2001, ApJ, 557, 747
- Irwin et al. (2007) Irwin, J., Aigrain, S., Hodgkin, S., Stassun, K. G., Hebb, L., et al. 2007, MNRAS, 380, 541
- Isobe & Sesaki (1982) Isobe, S. & Sesaki, G. 1982, PASJ, 34, 241
- Jeffries (2007a) Jeffries, R. D. 2007a, MNRAS, 376, 1109
- Jeffries (2007b) —. 2007b, MNRAS, 381, 1169
- Johnson (1957) Johnson, H. L. 1957, ApJ, 126, 134
- Johnson & Hiltner (1956) Johnson, H. L. & Hiltner, W. A. 1956, ApJ, 123, 267
- Johnson & Morgan (1953) Johnson, H. L. & Morgan, W. W. 1953, ApJ, 117, 313
- Johnson (1965) Johnson, H. M. 1965, ApJ, 142, 964
- Johnstone & Bally (1999) Johnstone, D. & Bally, J. 1999, ApJ, 510, L49
- Jones & Walker (1988) Jones, B. F. & Walker, M. F. 1988, AJ, 95, 1755
- Jones et al. (1994) Jones, T. J., Mergen, J., Odewahn, S., Gehrz, R. D., Gatley, I., et al. 1994, AJ, 107, 2120
- Joye & Mandel (2003) Joye, W. A. & Mandel, E. 2003, in ASP Conf. Ser. 295: Astronomical Data Analysis Software and Systems XII, ed. H. E. Payne, R. I. Jedrzejewski, & R. N. Hook, 489
- Kapteyn (1918a) Kapteyn, J. C. 1918a, ApJ, 47, 104
- Kapteyn (1918b) —. 1918b, ApJ, 47, 146
- Kapteyn (1918c) —. 1918c, ApJ, 47, 255
- Kassis et al. (2006) Kassis, M., Adams, J. D., Campbell, M. F., Deutsch, L. K., Hora, J. L., et al. 2006, ApJ, 637, 823
- Kastner et al. (2005) Kastner, J. H., Franz, G., Grosso, N., Bally, J., McCaughrean, M. J., et al. 2005, ApJS, 160, 511
- King (1993) King, J. R. 1993, AJ, 105, 1087
- Kogure et al. (1989) Kogure, T., Yoshida, S., Wiramihardja, S. D., Nakano, M., Iwata, T., et al. 1989, PASJ, 41, 1195
- Köhler et al. (2006) Köhler, R., Petr-Gotzens, M. G., McCaughrean, M. J., Bouvier, J., Duchêne, G., et al. 2006, A&A, 458, 461
- Kopylov & Straizys (1963) Kopylov, I. M. & Straizys, V. 1963, Vilnius Astron. Obs. Biuletenis, 5, 18
- Kraemer et al. (2003) Kraemer, K. E., Shipman, R. F., Price, S. D., Mizuno, D. R., Kuchar, T., et al. 2003, AJ, 126, 1423
- Kraus et al. (2007) Kraus, S., Balega, Y. Y., Berger, J.-P., Hofmann, K.-H., Millan-Gabet, R., et al. 2007, A&A, 466, 649
- Kroupa et al. (1999) Kroupa, P., Petr, M. G., & McCaughrean, M. J. 1999, New Astron., 4, 495
- Ku & Chanan (1979) Ku, W. H.-M. & Chanan, G. A. 1979, ApJ, 234, L59
- Ku et al. (1982) Ku, W. H.-M., Righini-Cohen, G., & Simon, M. 1982, Science, 215, 61
- Kumar & Schmeja (2007) Kumar, M. S. N. & Schmeja, S. 2007, A&A, 471, L33
- Lada (2006) Lada, C. J. 2006, ApJ, 640, L63
- Lada et al. (2000) Lada, C. J., Muench, A. A., Haisch, Jr., K. E., Lada, E. A., Alves, J. F., et al. 2000, AJ, 120, 3162
- Lada et al. (2004) Lada, C. J., Muench, A. A., Lada, E. A., & Alves, J. F. 2004, AJ, 128, 1254
- Lallemand et al. (1960) Lallemand, A., Duchesne, M., & Walker, M. F. 1960, PASP, 72, 268
- Laques & Vidal (1979) Laques, P. & Vidal, J. L. 1979, A&A, 73, 97
- Lee (1968) Lee, T. A. 1968, ApJ, 152, 913
- Lee et al. (1983) Lee, T. J., Beattie, D. H., Pickup, D. A., & Geballe, T. R. 1983, A&A, 127, 417
- Lemke et al. (1974) Lemke, D., Low, F. J., & Thum, C. 1974, A&A, 32, 231
- Lesh (1968) Lesh, J. R. 1968, ApJ, 152, 905
- Levato & Abt (1976) Levato, H. & Abt, H. A. 1976, PASP, 88, 712
- Levine et al. (2006) Levine, J. L., Steinhauer, A., Elston, R. J., & Lada, E. A. 2006, ApJ, 646, 1215
- Lohsen (1975) Lohsen, E. 1975, Informational Bulletin on Variable Stars, No. 988
- Lonsdale et al. (1982) Lonsdale, C. J., Becklin, E. E., Lee, T. J., & Stewart, J. M. 1982, AJ, 87, 1819
- Lucas & Roche (2000) Lucas, P. W. & Roche, P. F. 2000, MNRAS, 314, 858
- Lucas et al. (2001) Lucas, P. W., Roche, P. F., Allard, F., & Hauschildt, P. H. 2001, MNRAS, 326, 695
- Lucas et al. (2005) Lucas, P. W., Roche, P. F., & Tamura, M. 2005, MNRAS, 361, 211
- Lucas et al. (2006) Lucas, P. W., Weights, D. J., Roche, P. F., & Riddick, F. C. 2006, MNRAS, 373, L60
- Luhman (2000) Luhman, K. L. 2000, ApJ, 544, 1044
- Luhman et al. (1998) Luhman, K. L., Briceno, C., Rieke, G. H., & Hartmann, L. 1998, ApJ, 493, 909
- Luhman et al. (2000) Luhman, K. L., Rieke, G. H., Young, E. T., Cotera, A. S., Chen, H., et al. 2000, ApJ, 540, 1016
- Maggio et al. (2007) Maggio, A., Flaccomio, E., Favata, F., Micela, G., Sciortino, S., et al. 2007, ApJ, 660, 1462
- Malkov (1992) Malkov, O. Y. 1992, Bulletin d’Information du Centre de Donnees Stellaires, 40, 13
- Mandel & Herbst (1991) Mandel, G. N. & Herbst, W. 1991, ApJ, 383, L75
- Marilli et al. (2007) Marilli, E., Frasca, A., Covino, E., Alcalá, J. M., Catalano, S, et al. 2007, A&A, 463, 1081
- Markowitz (1949) Markowitz, W. 1949, AJ, 54, 111
- Mathis (1990) Mathis, J. S. 1990, ARA&A, 28, 37
- Mayne & Naylor (2008) Mayne, N. J. & Naylor, T. 2008, MNRAS, 386, 261
- McCaughrean & Gezari (1990) McCaughrean, M. & Gezari, D. 1990, in ASP Conf. Ser. 14: Astrophysics with Infrared Arrays, ed. R. Elston, 301
- McCaughrean & O’Dell (1996) McCaughrean, M. J. & O’Dell, C. R. 1996, AJ, 111, 1977
- McCaughrean & Stauffer (1994) McCaughrean, M. J. & Stauffer, J. R. 1994, AJ, 108, 1382
- McNamara (1990) McNamara, B. 1990, ApJ, 350, 348
- McNamara (1976a) McNamara, B. J. 1976a, AJ, 81, 845
- McNamara (1976b) —. 1976b, AJ, 81, 375
- Menten et al. (2007) Menten, K. M., Reid, M. J., Forbrich, J., & Brunthaler, A. 2007, A&A, 474, 515
- Mermilliod (1981) Mermilliod, J. C. 1981, A&AS, 44, 467
- Minkowski (1946) Minkowski, R. 1946, PASP, 58, 356
- Moeckel & Bally (2006) Moeckel, N. & Bally, J. 2006, ApJ, 653, 437
- Moeckel & Bally (2007a) —. 2007a, ApJ, 661, L183
- Moeckel & Bally (2007b) —. 2007b, ApJ, 656, 275
- Morgan & Lodén (1966) Morgan, W. W. & Lodén, K. 1966, Vistas Astron., 8, 83
- Morrell & Levato (1991) Morrell, N. & Levato, H. 1991, ApJS, 75, 965
- Muench et al. (2000) Muench, A. A., Lada, E. A., & Lada, C. J. 2000, ApJ, 553, 358
- Muench et al. (2001) Muench, A. A., Alves, J., Lada, C. J., & Lada, E. A. 2001, ApJ, 558, L51
- Muench et al. (2002) Muench, A. A., Lada, E. A., Lada, C. J., & Alves, J. 2002, ApJ, 573, 366
- Nakano et al. (1995) Nakano, M., Wiramihardja, S. D., & Kogure, T. 1995, PASJ, 47, 889
- Ney & Allen (1969) Ney, E. P. & Allen, D. A. 1969, ApJ, 155, L193+
- Ney et al. (1973) Ney, E. P., Strecker, D. W., & Gehrz, R. D. 1973, ApJ, 180, 809
- O’Dell (2001) O’Dell, C. R. 2001, ARA&A, 39, 99
- O’Dell (2003) O’Dell, C. R. 2003, The Orion nebula : where stars are born (Cambridge, MA: Harvard University Press)
- O’Dell & Wen (1994) O’Dell, C. R. & Wen, Z. 1994, ApJ, 436, 194
- O’Dell & Wong (1996) O’Dell, C. R. & Wong, K. 1996, AJ, 111, 846
- O’Dell et al. (1994) O’Dell, M. A., Hendry, M. A., & Collier Cameron, A. 1994, MNRAS, 268, 181
- O’Dell et al. (2005) O’Dell, C. R., Poveda, A., Allen, C., & Robberto, M. 2005, ApJ, 633, L45
- Padgett (1996) Padgett, D. L. 1996, ApJ, 471, 847
- Padgett et al. (1997) Padgett, D. L., Strom, S. E., & Ghez, A. 1997, ApJ, 477, 705
- Palla et al. (2005) Palla, F., Randich, S., Flaccomio, E., & Pallavicini, R. 2005, ApJ, 626, L49
- Palla et al. (2007) Palla, F., Randich, S., Pavlenko, Y. V., Flaccomio, E., & Pallavicini, R. 2007, ApJ, 659, L41
- Pannekoek (1929) Pannekoek, A. 1929, Pub. Astron. Inst. Univ. Amsterdam, 2, 1
- Parenago (1954a) Parenago, P. P. 1954a, Trudy Gosudarstvennogo Astron. Inst., 25, 1
- Parenago (1954b) —. 1954b, Trudy Gosudarstvennogo Astron. Inst., 25, 3
- Parenago (1997) —. 1997, VizieR Online Data Catalog
- Parenago & Kukarkin (1947) Parenago, P. P. & Kukarkin, B. V. 1947, Peremennye zvezdy
- Parenago & Sharov (1961) Parenago, P. P. & Sharov, A. S. 1961, AJ, 66, 103
- Parsamian & Chavira (1982) Parsamian, E. S. & Chavira, E. 1982, Bol. Inst. Tonantzintla, 3, 69
- Patience et al. (2008) Patience, J., Zavala, R. T., Prato, L., Franz, O., Wasserman, L., et al. 2008, ApJ, 674, L97
- Penston (1973) Penston, M. V. 1973, ApJ, 183, 505
- Penston et al. (1975) Penston, M. V., Hunter, J. K., & Oneill, A. 1975, MNRAS, 171, 219
- Perryman et al. (1997) Perryman, M. A. C., Lindegren, L., Kovalevsky, J., Hoeg, E., Bastian, U., et al. 1997, A&A, 323, L49
- Petr et al. (1998) Petr, M. G., Coude Du Foresto, V., Beckwith, S. V. W., Richichi, A., & McCaughrean, M. J. 1998, ApJ, 500, 825
- Petr-Gotzens & Massi (2007) Petr-Gotzens, M. G. & Massi, M. 2007, Mem. Soc. Astron. Italiana, 78, 362
- Pflamm-Altenburg & Kroupa (2006) Pflamm-Altenburg, J. & Kroupa, P. 2006, MNRAS, 373, 295
- Pickering & Leavitt (1904) Pickering, E. C. & Leavitt, H. S. 1904, ApJ, 19, 289
- Pickering (1917) Pickering, W. H. 1917, Harvard College Observatory Circular, 205, 1
- Pickering (1919) —. 1919, PASP, 31, 86
- Plambeck et al. (1995) Plambeck, R. L., Wright, M. C. H., Mundy, L. G., & Looney, L. W. 1995, ApJ, 455, L189
- Popper & Plavec (1976) Popper, D. M. & Plavec, M. 1976, ApJ, 205, 462
- Poveda et al. (1967) Poveda, A., Ruiz, J., & Allen, C. 1967, Boletin de los Observatorios Tonantzintla y Tacubaya, 4, 86
- Preibisch & Feigelson (2005) Preibisch, T. & Feigelson, E. D. 2005, ApJS, 160, 390
- Preibisch & Smith (1997) Preibisch, T. & Smith, M. D. 1997, A&A, 322, 825
- Preibisch et al. (1999) Preibisch, T., Balega, Y., Hofmann, K.-H., Weigelt, G., & Zinnecker, H. 1999, New Astronomy, 4, 531
- Preibisch et al. (2005a) Preibisch, T., Kim, Y.-C., Favata, F., Feigelson, E. D., Flaccomio, E., et al. 2005a, ApJS, 160, 401
- Preibisch et al. (2005b) Preibisch, T., McCaughrean, M. J., Grosso, N., Feigelson, E. D., Flaccomio, E., et al. 2005b, ApJS, 160, 582
- Prisinzano et al. (2007) Prisinzano, L., Micela, G., Flaccomio, E., Stauffer, J. R., Megeath, T., et al. 2007, ApJ, 677, 401
- Prosser et al. (1994) Prosser, C. F., Stauffer, J. R., Hartmann, L., Soderblom, D. R., Jones, B. F., et al. 1994, ApJ, 421, 517
- Ramírez et al. (2004) Ramírez, S. V., Rebull, L., Stauffer, J., Strom, S., Hillenbrand, L., et al. 2004, AJ, 128, 787
- Rebull (2001) Rebull, L. M. 2001, AJ, 121, 1676
- Rebull et al. (2000) Rebull, L. M., Hillenbrand, L. A., Strom, S. E., Duncan, D. K., Patten, B. M., et al. 2000, AJ, 119, 3026
- Rebull et al. (2006) Rebull, L. M., Stauffer, J. R., Megeath, S. T., Hora, J. L., & Hartmann, L. 2006, ApJ, 646, 297
- Reiners et al. (2007) Reiners, A., Seifahrt, A., Stassun, K. G., Melo, C., & Mathieu, R. D. 2007, ApJ, 671, L149
- Reipurth & Zinnecker (1993) Reipurth, B. & Zinnecker, H. 1993, A&A, 278, 81
- Reipurth et al. (2007) Reipurth, B., Guimarães, M. M., Connelley, M. S., & Bally, J. 2007, AJ, 134, 2272
- Rhode et al. (2001) Rhode, K. L., Herbst, W., & Mathieu, R. D. 2001, AJ, 122, 3258
- Riddick et al. (2007) Riddick, F. C., Roche, P. F., & Lucas, P. W. 2007, MNRAS, 381, 1077
- Rieke et al. (1973) Rieke, G. H., Low, F. J., & Kleinmann, D. E. 1973, ApJ, 186, L7
- Robberto et al. (2002) Robberto, M., Beckwith, S. V. W., & Panagia, N. 2002, ApJ, 578, 897
- Robberto et al. (2004) Robberto, M., Song, J., Mora Carrillo, G., Beckwith, S. V. W., Makidon, R. B., et al. 2004, ApJ, 606, 952
- Robberto et al. (2005) Robberto, M., Beckwith, S. V. W., Panagia, N., Patel, S. G., Herbst, T. M., et al. 2005, AJ, 129, 1534
- Rodríguez et al. (2005) Rodríguez, L. F., Poveda, A., Lizano, S., & Allen, C. 2005, ApJ, 627, L65
- Roeser & Bastian (1988) Roeser, S. & Bastian, U. 1988, A&AS, 74, 449
- Rosino (1946) Rosino, L. 1946, Pub. Osser. Astron. Bologna, 5, 3
- Rosino (1956) —. 1956, Mem. Soc. Astron. Italiana, 27, 335
- Rydgren & Vrba (1984) Rydgren, A. E. & Vrba, F. J. 1984, AJ, 89, 399
- Samuel (1993) Samuel, A. E. 1993, PhD thesis, Australian National University
- Sandstrom et al. (2007) Sandstrom, K. M., Peek, J. E. G., Bower, G. C., Bolatto, A. D., & Plambeck, R. L. 2007, ApJ, 667, 1161
- Scally & Clarke (2002) Scally, A. & Clarke, C. 2002, MNRAS, 334, 156
- Schertl et al. (2003) Schertl, D., Balega, Y. Y., Preibisch, T., & Weigelt, G. 2003, A&A, 402, 267
- Schneller (1948) Schneller, H. 1948, Astron. Nachrichten, 276, 144
- Schulz et al. (2000) Schulz, N. S., Canizares, C. R., Huenemoerder, D., & Lee, J. C. 2000, ApJ, 545, L135
- Schulz et al. (2001) Schulz, N. S., Canizares, C., Huenemoerder, D., Kastner, J. H., Taylor, S. C., et al. 2001, ApJ, 549, 441
- Schulz et al. (2003a) —. 2003a, ApJ, 586, 1441
- Schulz et al. (2003b) Schulz, N. S., Canizares, C., Huenemoerder, D., & Tibbets, K. 2003b, ApJ, 595, 365
- Sharpless (1952) Sharpless, S. 1952, ApJ, 116, 251
- Sharpless (1954) —. 1954, ApJ, 119, 200
- Sharpless (1962) —. 1962, ApJ, 136, 767
- Shevchenko (1981) Shevchenko, V. S. 1981, Soviet Astron. Letters, 7, 21
- Shuping et al. (2004) Shuping, R. Y., Morris, M., & Bally, J. 2004, AJ, 128, 363
- Sicilia-Aguilar et al. (2005) Sicilia-Aguilar, A., Hartmann, L. W., Szentgyorgyi, A. H., Fabricant, D. G., Fűrész, G., et al. 2005, AJ, 129, 363
- Simon (1997) Simon, M. 1997, ApJ, 482, L81
- Simon et al. (1999) Simon, M., Close, L. M., & Beck, T. L. 1999, AJ, 117, 1375
- Simón-Díaz et al. (2006) Simón-Díaz, S., Herrero, A., Esteban, C., & Najarro, F. 2006, A&A, 448, 351
- Skrutskie et al. (2006) Skrutskie, M. F., Cutri, R. M., Stiening, R., Weinberg, M. D., Schneider, S., et al. 2006, AJ, 131, 1163
- Slesnick et al. (2004) Slesnick, C. L., Hillenbrand, L. A., & Carpenter, J. M. 2004, ApJ, 610, 1045
- Slesnick et al. (2005) —. 2005, ApJ, 625, 1063
- Smith (1976) Smith, J. R. 1976, PhD thesis, Wyoming Univ., Laramie
- Smith et al. (1983) Smith, M. A., Beckers, J. M., & Barden, S. C. 1983, ApJ, 271, 237
- Smith et al. (2005) Smith, N., Bally, J., Shuping, R. Y., Morris, M., & Kassis, M. 2005, AJ, 130, 1763
- Stahl et al. (1996) Stahl, O., Kaufer, A., Rivinius, T., Szeifert, T., Wolf, B., et al. 1996, A&A, 312, 539
- Stahl et al. (2008) Stahl, O., Wade, G., Petit, V., Stober, B., & Schanne, L. 2008, A&A, 487, 323
- Stassun et al. (1999) Stassun, K. G., Mathieu, R. D., Mazeh, T., & Vrba, F. J. 1999, AJ, 117, 2941
- Stassun et al. (2001) Stassun, K. G., Mathieu, R. D., Vrba, F. J., Mazeh, T., & Henden, A. 2001, AJ, 121, 1003
- Stassun et al. (2004a) Stassun, K. G., Ardila, D. R., Barsony, M., Basri, G., & Mathieu, R. D. 2004a, AJ, 127, 3537
- Stassun et al. (2004b) Stassun, K. G., Mathieu, R. D., Vaz, L. P. R., Stroud, N., & Vrba, F. J. 2004b, ApJS, 151, 357
- Stassun et al. (2006a) Stassun, K. G., Mathieu, R. D., & Valenti, J. A. 2006a, Nat, 440, 311
- Stassun et al. (2006b) Stassun, K. G., van den Berg, M., Feigelson, E., & Flaccomio, E. 2006b, ApJ, 649, 914
- Stassun et al. (2007a) —. 2007a, ApJ, 664, 1154
- Stassun et al. (2007b) Stassun, K. G., van den Berg, M., & Feigelson, E. 2007b, ApJ, 660, 704
- Stassun et al. (2008) —. 2008, ApJ, 674, 615
- Stelzer et al. (2005) Stelzer, B., Flaccomio, E., Montmerle, T., Micela, G., Sciortino, S., et al. 2005, ApJS, 160, 557
- Stickland & Lloyd (1999) Stickland, D. J. & Lloyd, C. 1999, The Observatory, 119, 16
- Strand (1958) Strand, K. A. 1958, ApJ, 128, 14
- Swenson et al. (1994) Swenson, F. J., Faulkner, J., Rogers, F. J., & Iglesias, C. A. 1994, ApJ, 425, 286
- Tan (2004) Tan, J. C. 2004, ApJ, 607, L47
- Trumpler (1930) Trumpler, R. J. 1930, Lick Obs. Bull., 14, 154
- Trumpler (1931) —. 1931, PASP, 43, 255
- Tsujimoto et al. (2005) Tsujimoto, M., Feigelson, E. D., Grosso, N., Micela, G., Tsuboi, Y., et al. 2005, ApJS, 160, 503
- van Altena et al. (1988) van Altena, W. F., Lee, J. T., Lee, J.-F., Lu, P. K., & Upgren, A. R. 1988, AJ, 95, 1744
- Vandenberg & Bell (1985) Vandenberg, D. A. & Bell, R. A. 1985, ApJS, 58, 561
- Vasileiskii & Vitrichenko (2000) Vasileiskii, A. S. & Vitrichenko, E. A. 2000, Astron. Letters, 26, 529
- Vasilevskis (1962) Vasilevskis, S. 1962, AJ, 67, 699
- Vasilevskis (1971) —. 1971, ApJ, 167, 537
- Vitrichenko (1999) Vitrichenko, E. A. 1999, Astron. Letters, 25, 179
- Vitrichenko (2001) Vitrichenko, É. A. 2001, Astron. Letters, 27, 809
- Vitrichenko (2002) —. 2002, Astron. Letters, 28, 324
- Vitrichenko & Klochkova (2000) Vitrichenko, E. A. & Klochkova, V. G. 2000, Astron. Letters, 26, 104
- Vitrichenko & Klochkova (2004) —. 2004, Astrophysics, 47, 169
- Vitrichenko & Malov (2006) Vitrichenko, E. A. & Malov, I. F. 2006, Astron. Reports, 50, 392
- Vitrichenko & Plachinda (2001) Vitrichenko, E. A. & Plachinda, S. I. 2001, Astron. Letters, 27, 581
- Vitrichenko et al. (1998) Vitrichenko, E. A. Klochkova, V. G., & Plachinda, S. I. 1998, Astron. Letters, 24, 296
- Vitrichenko et al. (2006) Vitrichenko, É. A., Klochkova, V. G., & Tsymbal, V. V. 2006, Astrophysics, 49, 96
- Wade et al. (2006) Wade, G. A., Fullerton, A. W., Donati, J.-F., Landstreet, J. D., Petit, P., & Strasser, S. 2006, A&A, 451, 195
- Walborn & Nichols (1994) Walborn, N. R. & Nichols, J. S. 1994, ApJ, 425, L29
- Walker (1956) Walker, M. F. 1956, ApJS, 2, 365
- Walker (1969) —. 1969, ApJ, 155, 447
- Walker (1983) —. 1983, ApJ, 271, 642
- Walker (1990) —. 1990, PASP, 102, 726
- Warren & Hesser (1977) Warren, Jr., W. H. & Hesser, J. E. 1977, ApJS, 34, 115
- Warren & Hesser (1978) —. 1978, ApJS, 36, 497
- Weigelt et al. (1999) Weigelt, G., Balega, Y., Preibisch, T., Schertl, D., Schöller, M., et al. 1999, A&A, 347, L15
- Williams et al. (2005) Williams, J. P., Andrews, S. M., & Wilner, D. J. 2005, ApJ, 634, 495
- Wilson (2001) Wilson, B. A. 2001, PhD thesis, Phys. Dept., Bristol University
- Wilson et al. (2005) Wilson, B. A., Dame, T. M., Masheder, M. R. W., & Thaddeus, P. 2005, A&A, 430, 523
- Wilson (1940) Wilson, R. E. 1940, Contr. Mount Wilson Obs., 631, 1
- Wiramihardja et al. (1989) Wiramihardja, S. D., Kogure, T., Yoshida, S., Ogura, K., & Nakano, M. 1989, PASJ, 41, 155
- Wiramihardja et al. (1991) Wiramihardja, S. D., Kogure, T., Yoshida, S., Nakano, M., Ogura, K., et al. 1991, PASJ, 43, 27
- Wiramihardja et al. (1993) —. 1993, PASJ, 45, 643
- Wolf (1994) Wolf, G. W. 1994, Exper. Astron., 5, 61
- Wolf (1854) Wolf, R. 1854, Astron. Nachrichten, 38, 109
- Wolff (1990) Wolff, S. C. 1990, AJ, 100, 1994
- Wolff et al. (2004) Wolff, S. C., Strom, S. E., & Hillenbrand, L. A. 2004, ApJ, 601, 979
- Wolk et al. (2005) Wolk, S. J., Harnden, Jr., F. R., Flaccomio, E., Micela, G., Favata, F., et al. 2005, ApJS, 160, 423
- Wouterloot & Brand (1992) Wouterloot, J. G. A. & Brand, J. 1992, A&A, 265, 144
- Wynn-Williams et al. (1984) Wynn-Williams, C. G., Genzel, R., Becklin, E. E., & Downes, D. 1984, ApJ, 281, 172
- Yang & Johns-Krull (2007) Yang, H., & Johns-Krull, C. M. 2007, in American Astron. Soc. Mtg. Abs., 211, #62.19
- Yamauchi et al. (1996) Yamauchi, S., Koyama, K., Sakano, M., & Okada, K. 1996, PASJ, 48, 719
- Zinnecker & McCaughrean (1991) Zinnecker, H. & McCaughrean, M. 1991, Mem. Soc. Astron. Italiana, 62, 761
- Zinnecker et al. (1993) Zinnecker, H., McCaughrean, M. J., & Wilking, B. A. 1993, in Protostars and Planets III, ed. E. H. Levy & J. I. Lunine, Univ. of Arizona Press, Tucson, 429
- Zinnecker & Yorke (2007) Zinnecker, H. & Yorke, H. W. 2007, ARA&A, 45, 481
- Zuckerman (1973) Zuckerman, B. 1973, ApJ, 183, 863