Väisäläntie 20, 21500 Piikkiö, Finland; 22institutetext: Max-Planck-Institut für Radioastronomie,
Auf dem Hügel 69, 53121 Bonn, Germany; 33institutetext: Pushchino Radio Astronomy Observatory, Lebedev Physical Institute,
Leninskii Prosp. 53, 119991 Moscow, Russia; 44institutetext: Astro Space Center of Lebedev Physical Institute, Profsoyuznaya 84/32, 117997 Moscow, Russia
Multi-frequency VLBA study of the blazar S5 0716+714 during the active state in 2004
We observed the blazar 0716+714 with the VLBA during its active state in 2003-2004. In this paper we discuss multi-frequency analysis of the inner jet (first 1 mas) kinematics. The unprecedentedly dense time sampling allows us to trace jet components without misidentification and to calculate the component speeds with good accuracy. In the smooth superluminal jet we were able to identify and track three components over time moving outwards with relatively high apparent superluminal speeds (8.5-19.4 ), which contradicts the hypothesis of a stationary oscillating jet in this source. Component ejections occur at a relatively high rate (once in two months), and they are accompanied by mm-continuum outbursts. Superluminal jet components move along wiggling trajectories, which is an indication of actual helical motion. Fast proper motion and rapid decay of the components suggest that this source should be observed with the VLBI at a rate of at least once in one or two months in order to trace superluminal jet components without confusion.
Key Words.:
galaxies: active – galaxies: BL Lacertae objects: individual: S5 0716+714 – galaxies: jets1 Introduction
The blazar S5 0716+714 is one of the most active sources of its class. It is highly variable on time scales from hours to months at all observed wavelengths from radio to -rays. Intra-day variability (IDV) was detected in the source in the optical, millimetre, and radio bands (e.g. Montagni et al. 2006; Agudo et al. 2006, and references therein). The IDV in the different bands of electromagnetic radiation is strongly correlated (Quirrenbach et al. 1991; Wagner et al. 1996; Stalin et al. 2006; Fuhrmann et al. 2008), which suggests its intrinsic origin. Redshift of the source is 0.31, as recently estimated by Nilsson et al. (2008), who observed the host galaxy in the I-band during the quiescent state of the active nucleus.
Very long baseline interferometry studies (VLBI) show a core-dominated jet pointing to the north (Jorstad et al. 2001; Bach et al. 2005), and VLA data show a halo-like jet misaligned with it by 90∘ (Wagner et al. 1996). There are several scenarios for the milliarcsecond scale jet kinematics. The most recent studies propose two very different interpretations for the long time series (10 yr) of centimetre VLBI observations. One scenario consists of fast superluminal components moving along the jet with speeds ranging from 5 to 16 (Jorstad et al. 2001; Bach et al. 2005). An alternative interpretation suggests that instead of travelling along the jet, components are “oscillating” around their mean position due to the jet precession. Component speeds, calculated taking position angle changes into account, range from 5 to 10 (Britzen et al. 2006).
This paper is the first one in a series of papers that describe changes in the parsec-scale structure of 0716+714 during the active period in 2003-2004. Here we present the kinematics of the inner jet of 0716+714. In Paper II we will discuss the suitability of different data imaging methods for restoration of the source structure in the case of a very smooth brightness distribution along the jet. Source polarisation, quantitative analysis of the flux density evolution and spectral properties will be published in the subsequent papers. Here we use a standard cosmological model with a flat universe and values of Hubble constant =71 km s-1Mpc-1, energy density of matter =0.3, and cosmological constant energy density =0.7.
2 Observations and data analysis
0716+714 was observed with the Very Long Baseline Array (VLBA). Five observations, separated by approximately a month (2004, Feb 10 (A), May 03 (B), Jun 18 (C), Jul 29 (D) and Aug 29 (E)), cover a time period of the source’s active state. This is an unprecedentedly high time resolution for this source. Each observation lasted for nine hours and utilised five frequencies (86, 43, 22, 5 and 1.6 GHz) in dual polarisation mode. Data were correlated at the Socorro VLBA correlator. A priori amplitude and phase calibration was performed at Tuorla Observatory using standard procedures of the AIPS package. Imaging was done using Caltech Difmap package employing CLEAN algorithm.
2.1 Model fitting and error analysis
After the final self-calibrated data and CLEAN image were obtained, we fitted a source model consisting of Gaussian components to the data in the -plane using Difmap procedure Modelfit. We used only circular Gaussian components in order to reduce the number of free parameters, and we tried to use as few components as possible. For all models we took the brightest component at the end of the jet as a reference (the “core”) and the component positions were measured relative to it.
The errors in position and flux density of the components were calculated using Difwrap package (Lovell 2000), which employs Modelfit in a loop for finding maximum possible deviation of the component parameter from the best-fit value. We used it in a procedure proposed by Savolainen et al. (2006), applying our own criteria for limiting error determination, which will be described in detail in the next paper.
Expected values of ejection epochs and corresponding errors were determined using Monte Carlo simulation, as well as expected values of component positions and errors in Ra-Dec coordinates. Each component was replaced with a Gaussian distribution of values, representing the errors in that point. A weighted least-squares fit was calculated for each set in the case of ejection epoch determination, producing a (non-Gaussian) distribution of zero crossings. The expected value and standard deviation were calculated from these distributions using standard equations.
2.2 Cross-identification of the model components
Model fitting of the multi-frequency VLBI data set simultaneously is not a trivial task, because resolution, values of model parameter errors, and position of the core all depend on the frequency. Therefore, we have to treat different bands separately. In this paper we discuss the kinematics of the inner jet mainly using data obtained at 43 GHz. In addition to that, the data set provides models of the same region at 86 and 22 GHz. Even though the angular resolution at 22 GHz is only slightly lower (0.25 mas) than at 43 GHz (0.15 mas), this difference is important for the small inner jet region with fast moving components (see Sect. 3). Slightly higher resolution is provided by 86 GHz, but the data quality at this frequency allows us to obtain 86 GHz images only for two epochs of our experiment. Therefore, our kinematic model is based on 43 and 22 GHz data (with emphasis on 43 GHz), while 86 GHz data is used for a consistency check of the models. All 22, 43 and 86 GHz models will be used for the subsequent component spectra analysis.
Models provided by the Modelfit procedure are not a unique representation of the data, they are only one of all the possible ways to parametrise the image. Therefore, we had to work out tests that help us to estimate the goodness of the model fit. We consider a model acceptable when the following requirements are fulfilled: a) model provides a good fit to the visibility data; b) if convolved with the restoring beam, it provides a brightness distribution similar to that of the final CLEAN map; c) all models at the same frequency are consistent between epochs; i.e., most of the components are traceable over time; and d) models at the same epoch are consistent between frequencies.
Condition a) is fulfilled if the model-fitting process was carried out correctly and verified by visual inspection of the correspondence between the observed and model -data. Condition b) is checked by simple visual inspection of the resulting images. Condition c) is verified by comparison of component positions at different epochs and flux density evolution, no unphysically rapid changes should be seen. In the presence of outward motion, goodness of the linear fit is also a good indicator. For condition d) we use the following rule: components from two close frequencies with comparable resolution should coincide within positional errors and have flux densities that do not require unphysically steep spectral indices (or at least have similar flux density-time dependence). Also, if two components are resolved at higher frequency, while at the lower frequency they appear as one component, the distance between those components should not be greater than the resolution at the lower frequency, and their total flux density should be close to the flux density of the unresolved one. Our final model set seems to meet all those requirements with good accuracy. Therefore, our 43 GHz kinematic model is self-consistent over time and is also in good agreement with both neighbouring frequencies.
Cross-identification of the model components between the epochs is based on their distance from the core, position on the (Ra,Dec)-plane and their flux densities. In this paper, we rely on the accuracy of the a priori amplitude calibration of the VLBA, which has been previously shown to achieve 5 at 43 GHz (Savolainen et al. 2008). Distribution of the polarised intensity along the jet is smooth and uniform, therefore it was not possible to use polarisation information to cross-identify the components.
3 Results
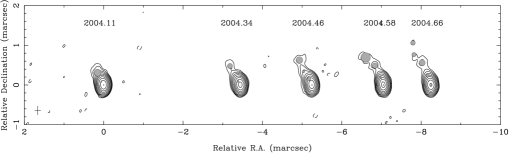
The VLBA maps of 0716+714 at 43 GHz are presented in Fig. 1. The date of each observation is indicated in the plot. Well-collimated one-sided inner jet of 0716+714 spans up to 1 mas pointing to the position angle of 27∘ and has a smooth intensity distribution.
| Comp. | , mas/yr | , c | Ejection |
|---|---|---|---|
| name | (z=0.31) | epoch, yr | |
| C543 | 1.010.09 | 19.41.7 | 2003.770.05 |
| C522 | 1.110.13 | 21.32.5 | 2003.860.05 |
| C643 | 0.880.03 (1.040.07)∗ | 16.91.6 | 2003.990.01 |
| C622 | 0.980.04 | 18.90.8 | 2004.020.01 |
| C743 | 0.440.04 (0.440.16)∗ | 8.50.8 | 2004.080.04 |
| C722 | 0.760.14 | 14.62.6 | 2004.180.04 |
| C843 | 0.000.01 | – | – |
| C822 | 0.120.02 | – | – |
-
∗
In parenthesis: fit performed using travelled distance
-
N
Values obtained for 43 and 22 GHz are marked with corresponding number
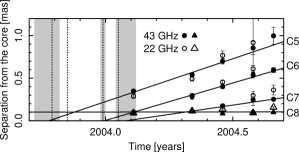
A total of four components were detected during the observations, and one of them (C8) is stationary. Their radial distances as a function of time with error bars and linear fits for proper motions are presented in Fig. 2. The plotted linear fits were performed for 43 GHz data (filled triangles/circles). It is clear that most 22 GHz components (open triangles/circles) coincide with those at 43 GHz within one or two sigma. At epochs A and B, components C6 and C7, respectively, are not resolved from C8. Therefore we took positions of C8 as their positions at these epochs. At epoch C, components C7 and C8 are not resolved at 22 GHz. Only one moving component (C5) was observed at all five epochs. At epoch E its flux density faded, and it split into two components of comparable flux densities. Their positions were averaged in order to perform the linear fit. Based on C5, we estimated the component lifetime (from ejection to fading away) to be ten months.
Proper motions, superluminal speeds, and ejection epochs for all four components for 22 and 43 GHz are presented in Table 1. Components C6 and C7 have substantially curved trajectories, therefore, for them we present proper motions and apparent speeds calculated using linear fit for both radial and travelled distance. Errors in the radial distance fit parameters were calculated using components’ positional errors, while travelled distance fit errors were only calculated from the scatter. Therefore the former are substantially smaller. It is clear that values of proper motions and apparent speeds obtained by both methods agree within errors, which indicates that the wiggling of the component trajectories (see below) does not influence the determination of the component speeds.

The jet components have wiggling trajectories along the jet, with the deviation from the overall jet direction greater than positional errors (see Fig. 3). We have to notice that this wiggling is less pronounced at lower frequencies (22 GHz), which suggests that the inner jet is resolved in transverse direction at 43 GHz.
4 Discussion
4.1 Jet parameters
Although kinematics results obtained for 22 and 43 GHz are similar, all further calculations were performed for the apparent speeds obtained for 43 GHz, which seem to us more reliable due to the better resolution of images. The estimated apparent speeds of the jet components are superluminal with a maximum value of 19.4 . The viewing angle that maximises the apparent speed is (, corresponding to a minimum Lorentz factor of and to a Doppler factor of . If differs from , these values could be even higher; however, 19.4 is high enough to explain the brightness temperature, estimated during the outbursts in the framework of the standard synchrotron source model with a power-law electron energy distribution (Ostorero et al. 2006). Our results indicate slightly higher flow speeds than previous VLBI kinematic studies by Bach et al. (2005) and agree with results of Jorstad et al. (2001). However, radio variability gives =10.9 (Hovatta et al. 2008). This value could be achieved for the observed values of the apparent speed if the viewing angle -1)=4.5∘, which is lower than the maximum value of 5.9∘, calculated according to the relation . Therefore, our results are also consistent with calculations based on the source variability.
4.2 Correspondence of component ejections to mm flares
According to Savolainen et al. (2002), an ejection of superluminal components in blazars in most cases coincide with the beginning of the mm-continuum flare. In September-October 2003 0716+714 underwent an outburst in mm and radio bands. The source had a large flare with several peaks and a complicated structure in the millimetre band (T. Hovatta and A. Lähteenmäki, priv. comm.). In the period under consideration, four flares were registered at 37 GHz, starting at 2003.79, 2003.85, 2003.99, and 2004.05. As a flare start we took one e-folding time before the maximum. Three of them coincide with the ejection times of components C5, C6, and C7 (see Fig. 2 and Table 1).
4.3 Wiggling trajectories
We noticed that trajectories of the jet components are not straight. The standard shock-in-jet model of AGN (Marscher 1996) suggests straight outward movement of the emitting component along the jet, but several alternative models state that emitting plasma clouds may move along helical paths. Although we do not have enough data to distinguish between those models, it might be interesting to apply them to this source in the future.
A two-fluid model of the jet (Sol et al. 1989; Despringre & Fraix-Burnet 1997) presents the jet itself to be non- or mildly-relativistic, consisting of electrons and protons, and not radiating. Emission comes from the relativistic “clouds” of electron-positron plasma moving along the helical path wrapped around the jet and driven by helical magnetic field. Brightness distribution on the VLBI map, dependencies of the component parameters on the distance from the core, as well as synchrotron spectra for certain geometries, were presented in Despringre & Fraix-Burnet (1997).
The helical jet model (e.g., Gomez et al. 1994; Villata & Ferrari 1994) presents the jet as an inhomogeneous flow of plasma along the helical magnetic field filaments, interacting with the ambient matter. It emits constantly, and flux density variability is caused by the change in jet orientation. This model, if applied to a number of sources including 0716+714, explains its spectral variability (Ostorero et al. 2001).
4.4 Long-term variation in the component speeds and ejection rate
Bach et al. (2005) find that the proper motions of the jet components are almost monotonically slowing down during the period from late 1986 until 1998 (0.86 to 0.29 mas/yr, respectively), and Nesci et al. (2005) explain this fact by a slow jet precession. Their model predicts a further increase in the apparent speed, together with decrease in the source’s mean brightness. Although our data show with a certainty that the speeds in 2004 are faster than reported by Bach et al. (2005), and in the period from 2004 to 2008, the source is even slightly brighter in optical than in 1995 - 2003. It indicates that jet precession is not the only mechanism responsible for the changes in the apparent speed. Also the ejection interval has reduced dramatically: if each Gaussian component in our model corresponds to a distinct physical feature in the jet, the ejection rate after the outburst in 2004 is one in 0.17 years, which is much higher than the long-term mean of one in 1.2 years.
The deviations from the mean ejection rate during the period 1986 - 1998 have occurred after small 15 GHz flux density enhancements. One explanation for this behaviour could be that the mechanism that normally produces a steady rate of ejections is disturbed during an outburst and settles down gradually after that.
5 Conclusions
We studied the kinematics of the inner jet of 0716+714 at 43 GHz. Even though the jet has a very smooth brightness distribution, we identified four components: three moving and one stationary. Components are well-defined at several frequencies and traceable over time. Components move along the jet with superluminal speeds ranging from 8.5 to 19.4 , which contradicts the model of an oscillating jet.
Ejections of new superluminal components occur at a relatively high rate, once in two months, and a component life time is approximately ten months. Therefore, future observers have to note that for accurate structure evolution studies, 0716+714 has to be observed at a rate of once in one or two months. Superluminal component ejections coincide with outbursts in a millimetre continuum.
We also noticed that components move along wiggling trajectories in the jet, which might be a signature of their helical motion. Careful quantitative tests of models that predict physically helical component motion (e.g. two-fluid model and helical jet model) should be performed in the future in order to understand nature of the jet in this object.
Acknowledgements.
The VLBA is a facility of the National Radio Astronomy Observatory, operated by Associated Universities, Inc., under cooperative agreement with the U.S. National Science Foundation. T. Savolainen is a research fellow of the Alexander von Humboldt Foundation. This work was supported in part by Academy of Finland grant 120516. K. Sokolovsky is supported by the the International Max Planck Research School (IMPRS) for Radio and Infrared Astronomy. We thank T. Hovatta and A. Lähteenmäki for access to the Metsähovi Blazar Monitoring 37 GHz data and flare model parameters.References
- Agudo et al. (2006) Agudo, I., Krichbaum, T. P., Ungerechts, H., et al. 2006, A&A, 456, 117
- Bach et al. (2005) Bach, U., Krichbaum, T. P., Ros, E., et al. 2005, A&A, 433, 815
- Britzen et al. (2006) Britzen, S., Meyer, V., Witzel, A., et al. 2006, in Proceedings of the 8th European VLBI Network Symposium, 6
- Despringre & Fraix-Burnet (1997) Despringre, V. & Fraix-Burnet, D. 1997, A&A, 320, 26
- Fuhrmann et al. (2008) Fuhrmann, L., Krichbaum, T. P., Witzel, A., et al. 2008, A&A, 490, 1019
- Gomez et al. (1994) Gomez, J. L., Alberdi, A., & Marcaide, J. M. 1994, A&A, 284, 51
- Hovatta et al. (2008) Hovatta, T., Valtaoja, E., Tornikoski, M., & Lähteenmäki, A. 2008, arXiv:0811.4278
- Jorstad et al. (2001) Jorstad, S. G. et al. 2001, Astrophys. J. Suppl., 134, 181
- Lovell (2000) Lovell, J. 2000, in Astrophysical Phenomena Revealed by Space VLBI, Proceedings of the VSOP Symposium, ed. H. Hirabayashi, P. G. Edwards, & D. W. Murphy, 301–304
- Marscher (1996) Marscher, A. P. 1996, in Astronomical Society of the Pacific Conference Series, Vol. 100, Energy Transport in Radio Galaxies and Quasars, ed. P. E. Hardee, A. H. Bridle, & J. A. Zensus, 45
- Montagni et al. (2006) Montagni, F., Maselli, A., Massaro, E., et al. 2006, A&A, 451, 435
- Nesci et al. (2005) Nesci, R., Massaro, E., Rossi, C., et al. 2005, AJ, 130, 1466
- Nilsson et al. (2008) Nilsson, K., Pursimo, T., Sillanpää, A., Takalo, L. O., & Lindfors, E. 2008, A&A, 487, L29
- Ostorero et al. (2001) Ostorero, L., Raiteri, C. M., Villata, M., et al. 2001, Memorie della Societa Astronomica Italiana, 72, 147
- Ostorero et al. (2006) Ostorero, L., Wagner, S. J., Gracia, J., et al. 2006, A&A, 451, 797
- Quirrenbach et al. (1991) Quirrenbach, A., Witzel, A., Wagner, S., et al. 1991, ApJ, 372, L71
- Savolainen et al. (2002) Savolainen, T., Wiik, K., Valtaoja, E., Jorstad, S. G., & Marscher, A. P. 2002, A&A, 394, 851
- Savolainen et al. (2006) Savolainen, T., Wiik, K., Valtaoja, E., & Tornikoski, M. 2006, A&A, 446, 71
- Savolainen et al. (2008) Savolainen, T., Wiik, K., Valtaoja, E., & Tornikoski, M. 2008, in Astronomical Society of the Pacific Conference Series, Vol. 386, Extragalactic Jets: Theory and Observation from Radio to Gamma Ray, ed. T. A. Rector & D. S. De Young, 451
- Sol et al. (1989) Sol, H., Pelletier, G., & Asseo, E. 1989, MNRAS, 237, 411
- Stalin et al. (2006) Stalin, C. S., Gopal-Krishna, Sagar, R., et al. 2006, MNRAS, 366, 1337
- Villata & Ferrari (1994) Villata, M. & Ferrari, A. 1994, A&A, 284, 663
- Wagner et al. (1996) Wagner, S. J., Witzel, A., Heidt, J., et al. 1996, AJ, 111, 2187