XMM-Newton detects a relativistically broadened iron line in the spectrum of the ms X-ray pulsar SAX J1808.4–3658
We report on a 63-ks long XMM-Newton observation of the accreting millisecond pulsar SAX J1808.4-3658 during the latest X-ray outburst which started on September 21st 2008. The pn spectrum shows a highly significant emission line in the energy band where the iron K- line is expected, and which we identify as emission from neutral (or mildly ionized) iron. The line profile appears to be quite broad (more than 1 keV FWHM) and asymmetric; the most probable explanation for this profile is Doppler and relativistic broadening from the inner accretion disc. From a fit with a diskline profile we find an inner radius of the disc of Rg, corresponding to km for a 1.4 M⊙ neutron star. The disc therefore appears truncated inside the corotation radius (31 km for SAX J1808.4-3658) in agreement with the fact that the source was still showing pulsations during the XMM-Newton observation.
Key Words.:
accretion, accretion disks – Line:profiles – pulsars: individual (SAX J1808.4–3658) – relativity – X-rays:binaries1 Introduction
Accreting millisecond pulsars (AMSP) are generally interpreted as the evolutionary link between the low mass X-ray binaries (LMXB) and rotation powered millisecond pulsars. According to the recycling scenario, the latter are in fact formed after a phase of mass accretion from a low mass companion star, which ultimately spins the neutron star (NS) up to ms periods (see e.g. Bhattacharya & van den Heuvel 1991). SAX J1808.4–3658 was the first AMSP discovered (Wijnands & van der Klis 1998). In ten years the population of AMSP has grown to ten sources, all residing in close and transient binaries, but SAX J1808.4–3658 can still be considered the cornerstone of its class as it has repeatedly gone into outburst almost every two years since its first detection, making it the most observationally rich source of its class. Its timing and orbital properties have been extensively studied and are still debated to some extent (Burderi et al. (2006), Di Salvo et al. (2008), Hartman et al. (2008), H08 hereinafter). Its broadband X-ray spectral emission during the outburst phase was studied using RXTE observations of the 1998 outburst (Gilfanov et al. (1998), Heindl & Smith (1998), Gierliński et al. (2002), GDB hereinafter).
GDB decomposed the 3.0 –150.0 keV X-ray spectrum into a soft component, originating either from the disc or the NS surface, and a dominating hard component extending to energies up to 100 keV ( keV), interpreted as Comptonization of soft photons, probably in the accretion column above the magnetic caps of the NS. A disc reflection component was also observed producing the typical hump at 30 keV and a K iron line at 6.5 keV.
Broad iron emission lines, in the 6.4 –6.97 keV energy range, have been observed from many NS LMXB (Di Salvo et al. (2005), Bhattacharyya & Strohmayer (2007), Cackett et al. (2008b), Pandel et al. (2008), D’Ai et al. (2008), and references therein). Their broadening and in particular the asymmetry of the line is generally interpreted as the effect of the relativistic Keplerian motion of the reflecting plasma in an optically thick, and geometrically thin, accretion disc, in the deep gravitational well of the nearby compact object (Fabian et al. 1989).
The determination of the physical properties that produce the broadening of the iron line in an X-ray pulsar like SAX J1808.4–3658 is invaluable for accretion theories of fast rotators, as it gives constraints on one of the key parameters, the radius at which the disc terminates as the magnetosphere starts to lift off matter towards the magnetic poles. Motivated by this, we obtained a 63 ks XMM-Newton Target of Opportunity (ToO) observation of this source, during the latest outburst in September 2008.
2 Observation and data reduction
SAX J1808.4–3658 was found in outburst on 2008 September 21 by RXTE , and since then it has been object of an intensive observational campaign. A preliminary analysis of the 2–10 keV Swift XRT publicly available light curve shows that the outburst had its maximum around September 24.
XMM-Newton observed SAX J1808.4–3658 as a ToO observation for 63 ks on 2008 October 1 (start time MJD 54739.99517), roughly one week after the assumed outburst peak. The EPIC-pn camera operated in timing mode, to prevent photon pile-up and to allow an analysis of the coherent and aperiodic timing behaviour of the source. The same observing mode was used for EPIC/MOS2 CCDs, while EPIC/MOS1 was operated in small window mode, and the RGS in spectroscopy mode. A bright external flare in the background is present during the first 2 ks of the observation, so that we excluded this time interval from our analysis.
The high source flux saturated the XMM-Newton telemetry rate, so that the XMM-Newton Science Operations Centre decided to switch off one of the MOS cameras (MOS2) in order to allocate more band to the EPIC–pn instrument, roughly 35 ks after the beginning of the observation. The EPIC–pn spectrum showed no noticeable difference before and after the MOS-2 turning off, and the whole EPIC–pn data set is therefore considered for our analysis. The MOS spectra were severely affected by pile up, and we did not consider them for our analysis.
Data were extracted and reduced using SAS v.8.0.0. We produced a calibrated EPIC–pn event list through the epproc pipeline, using the most updated calibration tools (epfast tool). We extracted the source spectrum selecting a 13 pixel wide stripe around the source position (RAWX=37) equivalent to (which should encircle more than of the energy up to 9 keV 111see XMM-Newton Users handbook, issue 2.6, available at http://xmm.esac.esa.int/external/xmm_user_support/.), and considered only PATTERN4 and FLAG=0 events. The background spectrum was extracted in the RAWX=4–15 and RAWY=2–198 CCD region.
The EPIC–pn energy channels were grouped with a compression factor of three so as not to oversample the instrument energy resolution. The count rate observed in the EPIC–pn CCD showed a slight increase during the observation from 700 c/s, at the beginning of the observation, to 780 c/s at the end of the observation.
RGS data were processed using the rsgproc pipeline to produce calibrated event lists, first and second order spectra and response matrices. The net count rates observed by the RGS1 and RGS2 in their first order, which are the only considered here, are 17.8 c/s and 20.0 c/s respectively. RGS spectra were binned in order to have at least 25 counts/bin.
To have a benchmark of the pn response, we also analysed, using the standard pipelines, a 1.1 ks Swift XRT observation taken in window timing mode (ObsId 00030034033), which started on MJD 54740.60118, and is therefore simultaneous with the XMM-Newton pointing. The X-ray spectral package we use to model the observed emission is HEASARC XSPEC v.12.4.
3 Spectral analysis and results
| Parameter | 0.6–11.0 keV | 1.4–11.0 keV |
|---|---|---|
| nH ( cm-2)222The absorption column in the EPIC-pn spectrum was varied in the range indicated by the RGS–EPIC-pn spectrum. | ||
| kTin (keV) | ||
| NDBB () | ||
| kTBB (keV) | ||
| RBB ( km) | ||
| Edge E (keV) | (frozen) | |
| O VIII () | ||
| LineE (keV) | ||
| Emissivity index | ||
| Rin () | ||
| Rout () | ||
| i | ||
| () | ||
| EW (eV) | ||
| F2-10 (erg/cm2/s)333Absorbed flux in the 2.0–10.0 keV band | ||
| Fbol (erg/cm2/s)444Unabsorbed flux extrapolated to the 0.05–150 keV band | ||
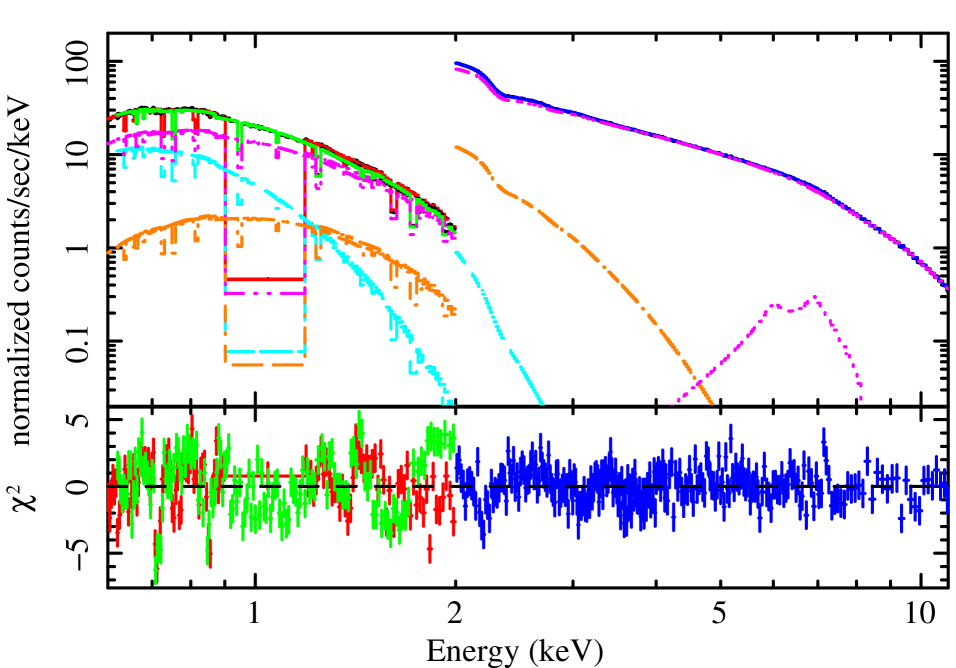
In our spectral analysis, we have first considered the combined spectrum of the RGS 1-2 (0.6–2.0 keV) and of the EPIC-pn (2.0–11.0 keV) data. The choice of the lower bound of the RGS is due to the presence of several calibration residuals at keV we chose not to model. The model we have first focused on is composed of a multi temperature disc emission (diskbb) and a power law. We model the effect of the interstellar photoelectric absorption using the phabs component. The addition of another (single temperature) soft component is strongly required by the data, as the chi squared improves by with the addition of just two parameters for 3156 degrees of freedom (d.o.f.). An edge at 0.871 keV, identified with O VIII absorption, is present in the RGS data at a high significance ( for the addition of 1 parameter). A line at keV also clearly emerges in the residuals (see Fig.1), at the energy of K fluorescent emission of neutral or mildly ionized iron. We obtain a for the addition of 3 parameters when we include a Gaussian to fit this component. The line is indeed very broad, as we obtain keV. This broadness, together with the apparent asymmetric profile, leads us to consider a model in which the iron emission is broadened by relativistic motion near the NS. We therefore find that a diskline model (Fabian et al. 1989) fits this feature well, giving an inner disc radius consistent with the range expected from accretion theories onto a pulsar ( Rg in the case of SAX J1808.4–3658, see discussion). This model, together with residuals, is plotted in Fig.2 and the obtained best fit parameters are listed in the middle column of Table 1.
The final chi squared of the fit in the 0.6–11.0 keV is still quite large and this is due to the presence of several features, especially in the RGS data, which are probably of calibration origin (e.g. at 0.7 and 0.85 keV, see residuals of Fig.2), and which we choose not to fit. Considering that the main goal of the observation (and of this Letter) is the study of the iron line, in order to check the stability of the obtained model, and to prevent spurious effects from a possible wrong cross-calibration between the instruments, we have also analysed the EPIC-pn dataset alone, in a bandwidth extending to the lowest energy allowed. We are forced to limit the energy range to the 1.4–11.0 keV band, as below large residuals () appear with respect to any reasonable continuum model, as we could check with a simultaneous fit with the Swift XRT dataset. We fit two evident absorption features at 1.8 and 2.2 keV, which are probably of instrumental origin as they lie near the Si K and Au M edges, which are known to influence the effective area determination if incorrectly calibrated. However, we take advantage of the low energy spectral information given by the RGS data, by taking the absorption column to vary in the range determined by the best fit in the whole RGS/pn energy range. A quick glance at Table 1 confirms how the best fit parameters do not change significantly fitting the pn alone. This is especially true for the hard power-law component and the iron emission line parameters, which are indeed perfectly consistent with those obtained from the fit in the 0.6–11 keV band.
We note that the diskline model gives a slightly better fit for the Fe–K line than a symmetric Gaussian profile, with an improvement of for the addition of three parameters (over 588 d.o.f.) with respect to the Gaussian modelling. Together with the evident difficulties in explaining the observed broadening of this feature with alternative models (see discussion), this definitely leads us to interpret the line profile as being produced in the inner regions of the accretion disc. To be conservative we discuss our results in the light of both the best fits presented in Table 1, which we remark differ significantly only for the soft components, which themselves are less constrained by the EPIC–pn alone.

To obtain an estimate of the unabsorbed bolometric flux we extrapolate the model of Table 1 to the 0.05–150 keV band. We are confident about our estimate, as values of are easily observed in SAX J1808.4–3658 (Gilfanov et al. 1998). We finally remark that the 2–10 keV flux estimate we obtain is in good accord with the one that can be derived by fitting our model to the Swift XRT spectrum ( erg cm-2 s-1).
Once the orbital motion is corrected (Patruno et al. 2008), the well known coherent pulsation is easily detected in the pn data at a frequency Hz, consistent with the 2005 value (H08). The power spectrum at frequencies lower than Hz is presented in Fig.3, and is in line with the typical power spectra observed for this source (see e.g. van Straaten et al. 2003). Three Lorentzians, with central frequencies of 0.92(5) Hz, 1.56(18) Hz, and 34.7(6) Hz, respectively, are used to model the timing features we observe. The first two (labelled A and B in the figure) describe the broad bump already observed below 10 Hz during other outbursts of this source. The third Lorentzian, labelled C, could be tentatively identified with the component observed during the 2002 outburst by van Straaten et al. (2005), who named it Lh.

4 Discussion
The spectrum of the AMSP SAX J1808.4–3658 observed by XMM-Newton is of extremely good quality. For the first time this opens the possibility of exploiting its high sensitivity and spectral resolution capabilities to study the innermost regions of the accretion disc around a rapidly rotating pulsar. The estimate of the inner disc radius we obtain from the broadening of the iron K fluorescent line is invaluable to test the theories of accretion onto a fast object. This can be used to constrain the truncation disc radius, which is expected to lie within the centrifugal boundary represented by the corotation radius, as indicated by the presence of pulsations at the known Hz frequency in the XMM-Newton light curve. Moreover it will be useful for an estimate of the lever arm of the torque exerted on the NS because of accretion, when a timing solution covering the whole outburst will be available.
Despite that the measured asymmetry of the iron line does not exclude a Gaussian profile on a statistical basis, we propose an interpretation of its large broadening in terms of the relativistic motion of the reflecting material in the space-time bent by the gravitational influence of the NS. Disc reflection in fact seems the only viable option to explain the large broadening and the low ionization state measured for the emitting material, in a source whose broadband spectrum is dominated by a hard (high temperature, low optical depth) Comptonized component (GDB).
For X-ray pulsars, the inner disc radius, , has to meet some observational constraints implied by the presence of pulsations. must be larger than the NS surface, km depending on the equation of state, and not much larger than the corotation radius, defined as the point where the magnetosphere rotation equals that of an assumed Keplerian disc, km for SAX J1808.4–3658, where m1.4 is the NS mass in units of M⊙. If not met, the latter condition implies that the magnetic field is not able to capture matter because it spins more rapidly than the disc, therefore resulting in a centrifugal barrier. Theoretical understanding and 3D MHD simulations (Romanova et al. (2008) and references therein) showed how the corotation condition is not to be taken strictly, as the magnetic field is able to release enough angular momentum to the disc to make it leap over the centrifugal barrier. In any case an inner disc radius well beyond the corotation radius would imply an efficient propeller ejection of matter, which seems not to be the case for SAX J1808.4–3658 (which is observed to show pulsations during this observation, and therefore to accrete matter onto the magnetic poles).
The estimate we made for the inner disc radius from the iron line broadening is m1.4 km. While the lower bound essentially overlaps the NS radius, the upper limit we give at a 90% confidence level as m1.4 km is in agreement with the expectation that the inner disc radius is inside the corotation boundary. Also in the case of a more massive 2.0 M⊙ NS, our upper limit is still of the order of Rc, . This measurement thus well fits in the small zone available for a fast rotating NS to efficiently accrete matter.
The line modelling holds if we consider both the broader 0.6–11.0 keV RGS+EPIC–pn spectrum and the restricted 1.4–11 keV bandwidth. The spectral information in the former is nevertheless fundamental to constrain the absorption column to SAX J1808.4–3658. The value we obtain is significantly larger than the average Galactic value ( cm-2). This could in principle indicate the presence of additional neutral absorbers in the proximity of the source, possibly revealing mass lost from the system during the Roche Lobe overflow (Di Salvo et al. 2008). The presence of an evident O VIII edge in the RGS data also indicates the presence of ionized absorbing matter along the line of sight.
The measured continuum is in good agreement with the expectations for these kinds of sources (GDB, Gierliński & Poutanen (2005)). We clearly detect two soft components, interpreted as coming from the accretion disc and from the NS surface (or a good fraction of it), as well as a dominant hard component, which is well described by a simple power-law in the XMM-Newton energy band. To derive the bolometric X-ray luminosity, we use our estimate of the 0.05–150.0 keV bolometric flux (see Table 1), and obtain d, where d3.5 is the distance to the source in units of kpc (Galloway & Cumming 2006). This estimate is in line with the bolometric flux measured for previous outbursts of this source (see e.g. Hartman et al. (2008)). In the hypothesis the X-ray luminosity well tracks the mass accretion rate onto the NS, we obtain a mass accretion rate of d R6 m M⊙/yr at this stage of the outburst, an estimate however affected by the uncertainties implied by its derivation from a tighter bandwidth spectrum.
The parameters measured for the soft components (see Table 1) can be used to obtain further constraints on the geometry of the emitting regions. The normalization of the multi temperature accretion disc black body (diskbb), , can be used to obtain an estimate of the apparent inner radius d3.5 km, which is indeed of the order of (see e.g. Kubota et al. (1998)). In our case we obtain different values from the fit in the two considered spectral bands, 40–70 km, and large uncertainties are still present in the value of the inclination angle of the system ( as derived from the diskline fit). Despite still being affected by large uncertainties, the range of values we derive for the inner disc radius from the diskbb component is still quite reasonable, and in agreement with the measure derived from the line fitting.
The single temperature blackbody component we detect with a high statistical significance in our spectral fits most probably comes from the NS surface (or a good fraction of it) as indicated by the radius of the blackbody emitting region which is km (for a distance to the source of 3.5 kpc, see Table 1), in line with the expectations of a hotspot origin.
Thus, in this Letter we have reported the results obtained from very high quality XMM-Newton spectra. Although some systematic features are still present in these spectra (due to the high statistics), the best fit model is stable and the best fit parameters do not dramatically depend on the energy band (or instrument) in which the spectral fit is performed. The most important result we report here concerns the observation of a broad emission line at keV. The most probable interpretation of this feature is reflection of the hard Comptonization spectrum in the innermost accretion disc. The inner disc radius derived in this way confirms the expectation that the accretion disc is truncated inside the corotation radius. This is the first time such an estimate can be made for a fast rotating X-ray pulsar, and confirms the basic elements of theories of accretion onto these objects.
During the preparation of this manuscript we became aware that a ks Suzaku observation also detected the iron line object of this paper (Cackett et al. 2008a). Although the parameters they found for the continuum are slightly different to those reported in this Letter, the conclusions stated there about the line modelling confirm our findings.
Acknowledgements.
We thank N.Schartel, who made possible this ToO observation in the Director Discretionary Time, M.Diaz Trigo M.Guainazzi, and all the XMM-Newton team who performed and supported this observation. We thank the referee for the prompt reply, and the Editorial board of AA for the perfect assistance in the pubblication of this paper. A.P. would also like to thank E.Bozzo and E.Piconcelli for support and useful discussions.References
- Bhattacharya & van den Heuvel (1991) Bhattacharya, D. & van den Heuvel, E. P. J. 1991, Phys. Rep, 203, 1
- Bhattacharyya & Strohmayer (2007) Bhattacharyya, S. & Strohmayer, T. E. 2007, ApJ, 664, L103
- Burderi et al. (2006) Burderi, L., Di Salvo, T., Menna, M. T., Riggio, A., & Papitto, A. 2006, ApJ, 653, L133
- Cackett et al. (2008a) Cackett, E. M., Altamirano, D., Miller, J., et al. 2008a, The Astronomer’s Telegram, 1844, 1
- Cackett et al. (2008b) Cackett, E. M., Miller, J. M., Bhattacharyya, S., et al. 2008b, ApJ, 674, 415
- D’Ai et al. (2008) D’Ai, A., Iaria, R., Di Salvo, T., Matt, G., & Robba, N. R. 2008, ApJ, accepted, arXiv:0812.1974
- Di Salvo et al. (2008) Di Salvo, T., Burderi, L., Riggio, A., Papitto, A., & Menna, M. T. 2008, MNRAS, 389, 1851
- Di Salvo et al. (2005) Di Salvo, T., Iaria, R., Méndez, M., et al. 2005, ApJ, 623, L121
- Fabian et al. (1989) Fabian, A. C., Rees, M. J., Stella, L., & White, N. E. 1989, MNRAS, 238, 729
- Galloway & Cumming (2006) Galloway, D. K. & Cumming, A. 2006, ApJ, 652, 559
- Gierliński et al. (2002) Gierliński, M., Done, C., & Barret, D. 2002, MNRAS, 331, 141
- Gierliński & Poutanen (2005) Gierliński, M. & Poutanen, J. 2005, MNRAS, 359, 1261
- Gilfanov et al. (1998) Gilfanov, M., Revnivtsev, M., Sunyaev, R., & Churazov, E. 1998, A&A, 338, L83
- Hartman et al. (2008) Hartman, J. M., Patruno, A., Chakrabarty, D., et al. 2008, ApJ, 675, 1468
- Heindl & Smith (1998) Heindl, W. A. & Smith, D. M. 1998, ApJ, 506, L35
- Juett & Chakrabarty (2003) Juett, A. M. & Chakrabarty, D. 2003, ApJ, 599, 498
- Kubota et al. (1998) Kubota, A., Tanaka, Y., Makishima, K., et al. 1998, PASJ, 50, 667
- Pandel et al. (2008) Pandel, D., Kaaret, P., & Corbel, S. 2008, ApJ, 688, 1288
- Patruno et al. (2008) Patruno, A., Hartman, J. M., Wijnands, R., et al. 2008, The Astronomer’s Telegram, 1760, 1
- Romanova et al. (2008) Romanova, M. M., Long, M., Kulkarni, A. K., et al. 2008, arXiv:0803.2865
- van Straaten et al. (2003) van Straaten, S., van der Klis, M., & Méndez, M. 2003, ApJ, 596, 1155
- van Straaten et al. (2005) van Straaten, S., van der Klis, M., & Wijnands, R. 2005, ApJ, 619, 455
- Wijnands & van der Klis (1998) Wijnands, R. & van der Klis, M. 1998, Nature, 394, 344