Gamma-Ray Burst afterglows: theory and observations
Abstract
I discuss some theoretical expectations for the synchrotron emission from a relativistic blast-wave interacting with the ambient medium, as a model for GRB afterglows, and compare them with observations. An afterglow flux evolving as a power-law in time, a bright optical flash during and after the burst, and light-curve breaks owing to a tight ejecta collimation are the major predictions that were confirmed observationally, but it should be recognized that light-curve decay indices are not correlated with the spectral slopes (as would be expected), optical flashes are quite rare, and jet-breaks harder to find in Swift X-ray afterglows.
The slowing of the early optical flux decay rate is accompanied by a spectral evolution, indicating that the emission from ejecta (energized by the reverse shock) is dominant in the optical over that from the forward shock (which energizes the ambient medium) only up to 1 ks. However, a long-lived reverse shock is required to account for the slow radio flux decays observed in many afterglows after day.
X-ray light-curve plateaus could be due to variations in the average energy-per-solid-angle of the blast-wave, confirming to two other anticipated features of GRB outflows: energy injection and angular structure. The latter is also the more likely origin of the fast-rises seen in some optical light-curves. To account for the existence of both chromatic and achromatic afterglow light-curve breaks, the overall picture must be even more complex and include a new mechanism that dominates occasionally the emission from the blast-wave: either late internal shocks or scattering (bulk and/or inverse-Compton) of the blast-wave emission by an outflow interior to it.
1 Introduction
A relativistic motion of GRB sources was advocated by paczynski86 ; goodman86 from that the energies released exceed by many orders of magnitude the Eddington luminosity for a stellar-mass object, especially if GRBs are at cosmological distances (see also shemi90 ; meszaros92 ).
The detection by CGRO/EGRET of photons with energy above 1 MeV during the prompt burst emission (e.g. hurley94 ) shows that GRB sources are optically thin to such photons. Together with the sub-MeV burst isotropic-equivalent output of ergs (e.g. bloom01 ) and the millisecond burst variability timescale, the condition for optical thickness to high energy photons gives another reason why GRBs must arise from ultra-relativistic sources, moving at Lorentz factor (e.g. fenimore93 ; lithwick01 ).
The same conclusion is enforced by the measurement of a relativistic expansion of the radio afterglow source. That expansion was either measured directly, as for GRB 030329 (), whose size increased at an apparent speed of 5c, indicating a source expanding at at 1–2 months taylor04 , or was inferred from the rate at which interstellar scintillation goodman97 quenches owing to the increasing source size, as for GRB 970508, whose expansion speed is inferred to be close to at 1 month waxman98 . The adiabatic dynamical evolution of a blast-wave, , where is the mass of the ambient medium, leads to for a homogeneous medium ( being the observer-frame photon arrival time). Then, extrapolated to the burst time implies . Extrapolating to such early times is justified by that most optical afterglow light-curves display a power-law decay starting after the burst, which sets a lower limit on the source Lorentz factor at that time.
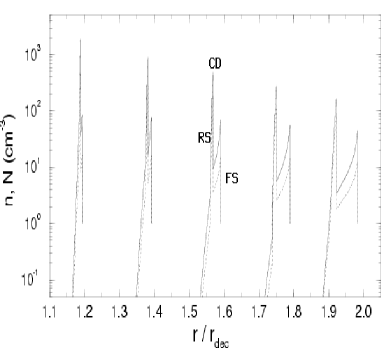
Whether the GRB ejecta are a cold baryonic outflow accelerated by the adiabatic losses of fireball’s initial thermal/radiation energy (e.g. meszaros93 ; piran93 ), or relativistic pairs formed through magnetic dissipation in a Poynting outflow, as in the electromagnetic model of lyutikov06 , their interaction with ambient medium will drive two shocks: a reverse shock crossing the ejecta and a forward-shock sweeping the circumburst medium, as illustrated in Figure 1. Both shocks energize their respective media, accelerate relativistic particles and generate magnetic fields through some plasma-instability related process, such as the two-stream Weibel instability driven by an anisotropic particle distribution function medvedev99 . The original magnetic field of the fireball at cm becomes too weak by the time the fireball reaches the cm radius (where the burst and afterglow emissions are produced) for the synchrotron emission to account for the sub-MeV burst emission and for the longer-wavelength, ensuing afterglow emission, even if the fireball was initially magnetically dominated meszaros93 ; medvedev99 .
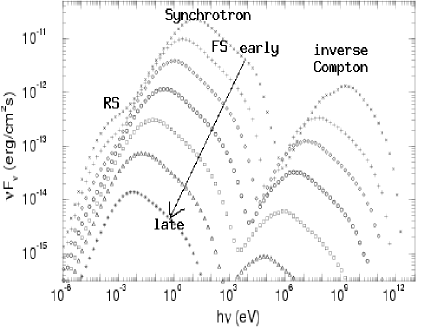
The evolution of the synchrotron and inverse-Compton fluxes produced by the blast-wave at a fixed frequency (i.e. the light-curve) is determined by how the characteristics of the spectrum (break frequencies and peak flux) change with time. Figure 2 shows the expected afterglow synchrotron spectrum, whose characteristics depend on the blast-wave radius, number of radiating electrons, their distribution with energy, magnetic field strength, and Lorentz factor.

Broadband spectrum of the synchrotron emission showing its three break frequencies: self-absorption (in radio), injection (, corresponding to the energy of the electrons currently accelerated by the shock), and cooling (, for electrons whose radiative cooling timescale is equal to the dynamical timescale). The energy distribution of the shock-accelerated electrons is assumed to be a power-law above the injection break – – which leads to a power-law afterglow spectrum () of slope between and and above . For a forward-shock afterglow origin, the three break frequencies and the peak flux determined from a ”snap-shot” afterglow spectrum provide four constraints for four unknown parameters: ejecta kinetic energy (per solid angle), ambient density, and fractional energies of electrons and magnetic field. Thus, afterglow spectra extending down to radio frequencies can be used to determine afterglow fundamental physical parameters (e.g. wijers99 ; granot99 ).
If the typical electron energy and magnetic field energy correspond to some fixed fraction of the post-shock energy, or if they start from such a fixed fraction and then evolve adiabatically (as for adiabatically colling ejecta), then the afterglow light-curve depends on (1) the evolution of the blast-wave Lorentz factor, the blast-wave radius being (with the photon-arrival time measured since burst trigger) (2) the spectrum of the blast-wave emission (i.e. the distribution of electrons with energy), and, in the case of the reverse-shock, (3) the evolution of the incoming mass.
The power-law deceleration of the blast-wave ( for , where is the radial stratification of the ambient medium density) and the power-law afterglow spectrum () are two factors which lead to a power-law afterglow light-curve (), with the decay index being a linear function of the spectral slope . These are the only two factors at work for the forward-shock emission and the ejecta emission during the adiabatic cooling phase (which starts when the reverse shock has crossed the ejecta shell), the two models that yield power-law afterglow light-curves in the most simple and natural way.
In contrast, for the reverse-shock emission (i.e. the ejecta emission while the shock exists), the light-curve depends also on the radial distribution of ejecta mass and of their Lorentz factor, thus the observed power-law light-curves require additional properties to be satisfied by the relativistic ejecta. Such properties seem ad-hoc when it comes to explaining single power-law afterglows whose flux displays an unchanged decay over 2–4 decades in time (such as the X-ray afterglows of GRBs 050801, 050820A, 06011B, 060210, 060418, 061007), but they also provide the flexibility required to account for the prevalent X-ray afterglow light-curves that exhibit one or more breaks.
2 Afterglow light-curves
I consider first the afterglow emission at early times, when the blast-wave is sufficiently relativistic that the observer receives boosted emission from a region of half-angle opening (as seen from the center of the blast-wave) that is smaller than the half-aperture of the collimated outflow. In that case, the observer does not ”see” yet the angular boundary of the outflow and the received emission is as bright as for a spherical blast-wave. The evolution of the spectral characteristics of the emission from ejecta and the swept-up ambient medium are presented below, the resulting power-law decay indices of the synchrotron flux being listed in Table 1.
2.1 Ejecta emission (energized by reverse shock or cooling adiabatically)
For a short-duration ejecta release, the reverse shock crosses the ejecta shell over an observer-frame time that depends primarily on the ejecta Lorentz factor : s, where is the isotropic-equivalent ejecta kinetic energy in erg, is the ambient medium density in protons per , and . In this case, the reverse shock is semi-relativistic and, more likely, radiates below the optical. After , the input of energy into the shocked structure ceases and the blast-wave begins to decelerate.
If the ejecta release is an extended process, the deceleration timescale depends primarily on the duration over which the ejecta are expelled: . In this case, the reverse shock is relativistic and could produce a bright optical emission. The separation between these two cases is set by , ”short-duration ejecta release” meaning s.
For a wind medium, the deceleration timescale is s for a short-duration ejecta release, where is the wind density parameter, normalized to that resulting for being ejected at a terminal velocity of 1000 km/s, being the same as for a homogeneous medium in the case of a long-duration ejection (which occurs for s).
At the deceleration radius, of the ejecta energy has been transferred to the swept-up ambient medium, which moves at for and a lower for . Taking into account that the energy per particle in the post forward-shock gas is , it follows that, at , the ejecta mass is larger than that of the forward shock by at most a factor . This implies that, at , the peak flux of the reverse-shock emission spectrum is a factor larger than the peak flux of the forward-shock spectrum, hence, the optical flash from the reverse shock could be up to 5 magnitudes brighter than the optical emission from the forward shock.
As mentioned above, when there is a reverse shock crossing the ejecta, its emission flux should depend on the density and Lorentz factor of the incoming ejecta. Semi-analytical calculations of the ejecta synchrotron emission when there is a reverse shock have been done by uhm07 and genet07 for a density and Lorentz factor of the incoming ejecta tailored to produce X-ray light-curve plateaus, hydrodynamical calculations of the reverse-shock dynamics have been presented by kobayashi00 , and calculations of the ejecta emission after the reverse shock has crossed the ejecta (i.e. during adiabatic cooling) have been published by meszaros97 ; sari99 ; kobayashi00A ; alin04 . However, analytical calculations of the ejecta emission while there is a reverse shock kobayashi03 have yet to be done.
Assuming a uniform ejecta density & Lorentz factor and an extended ejecta release, for which the reverse shock is relativistic and the shocked ejecta are slightly decelerated even before , owing to the progressive dilution of the incoming ejecta, I find that the reverse-shock peak flux and break frequencies (injection) and (cooling) evolve as , , for a homogeneous medium and , , for a wind.
As for the ejecta emission decay during the adiabatic cooling phase, the evolution of the spectral characteristics is approximately , for a homogeneous medium, and , for a wind. For , the cooling ejecta flux should decay with an index , for either type of medium. Above but below , the decay index is for a homogeneous medium and for a wind. Depending on the treatment of the ejecta dynamics and adiabatic cooling, other researchers reached slightly different results with and in meszaros97 , and in sari99 , and in kobayashi00A .
After falls below owing to adiabatic cooling, the observer receives no emission from the area of angular opening moving directly toward the observer (because of the exponential cut-off of the synchrotron emissivity above the synchrotron peak) but receives emission from the fluid moving at increasing angles larger than . That emission (called large-angle emission, lacking a better name) was released at the same time as the emission from angles less than , but arrives later at observer because of the spherical curvature of the emitting surface and finite speed of light, and is less beamed relativistically. As shown by kumar00 , the large-angle emission is characterized by , , the power-law decay index being (see also fenimore97 ) These are general results, arising only from relativistic effects, and independent of the emission process. The only assumption made in its derivation is that the surface emissivity properties are angle-independent.
2.2 Forward-shock emission (energized ambient medium)
Before deceleration of the blast-wave begins, the shocked ambient medium moves at a constant , if the reverse shock is semi-relativistic, or is slowly decelerating as , if the reverse shock is relativistic.
For a semi-relativistic reverse shock, the spectral characteristics of the pre-deceleration forward-shock synchrotron emission evolve as , , for a homogeneous medium, and , , for a wind. For a relativistic reverse shock, the above scalings become , , for , and , , for .
The forward-shock synchrotron emission after deceleration has received the most attention (e.g. meszaros97 ; sari98 ; alin98 ; chevalier99 ; granot99 ; granot02 ). Under the usual assumptions of constant blast-wave energy and micro-physical electron and magnetic field parameters, the forward-shock peak flux and spectral break frequencies evolution is , , for a homogeneous medium, and , , for a wind. From here, it follows that the flux below should rise slowly as for a homogeneous medium or be constant for a wind medium. For , the forward-shock flux decay is a power-law of index , with if ambient medium has a wind-like stratification (as expected for a massive stellar long-GRB progenitor) and if , for a homogeneous medium (which, surprisingly, is more often found to be compatible with the observed afterglows than a wind) if , and if , for any type of medium.
All the above results hold for a spherical outflow or a collimated one before the jet boundary becomes visible to the observer. At the jet-break time , when deceleration lowers the jet Lorentz factor to , the emission from the jet edge is no longer relativistically beamed away from the direction toward the observer. At , the lack of emitting fluid at angles larger than leads to a steepening of the afterglow decay by for a homogeneous medium and for a wind. Simultaneously, the lateral spreading of the jet becomes important and leads to a faster deceleration of the jet, which switches from a power-law in the blast-wave radius to an exponential rhoads99 , yielding an extra steepening of the afterglow decay of magnitude smaller or comparable to above. Together, these two jet effects lead to , , , rather independent of the ambient medium stratification, and a post jet-break forward-shock flux decay of index below , while for , one obtains below and above .
| HOMOGENEOUS MEDIUM | WIND MEDIUM | |||||||||
|---|---|---|---|---|---|---|---|---|---|---|
| MODEL | ||||||||||
| RS(1) | 1/5 | 1/15 | 1/5 | 3/5 | 3/5 | 1/9 | 5/9 | 0 | ||
| RS(2) | 0.3 | 0.3 | – | 0.3 | 0.3 | – | ||||
| FS(1) | -3 | -11/3 | -3 | -2 | -2 | -1/3 | 1/3 | -1/2 | ||
| FS(2) | -1 | -19/15 | -1/5 | -1/9 | 5/9 | 0 | ||||
| FS(3) | -1/2 | -1/6 | 1/4 | 0 | 2/3 | 1/4 | ||||
3 Afterglow observations
paczynski93 were the first to predict the existence of radio afterglows following the burst phase. meszaros97 have analyzed two models for the reverse shock emission and one for the forward shock, predicting long-lived optical afterglows with a flux decaying as a power of time. The first detection of an afterglow and measurement of a power-law flux decay followed soon (GRB 970228 wijers97 ), with many other optical kann07 and X-ray afterglows obrien06 ; willingale07 having been observed until today.
In general, the broadband (radio, optical, X-ray) emission of GRB afterglows display the expected power-law spectra and light-curves, as well as other features, which, in chronological order of their prediction are: radio scintillation (goodman97 & waxman98 ), optical counterpart flashes (sari99 & akerlof99 ), jet-breaks (rhoads99 & kulkarni99 ), dimmer afterglows for short bursts (alin01 & kann08 ). GRB afterglows display sufficient diversity (e.g. wide luminosity distributions at all observing frequencies, non-universal shock micro-physical parameters) and puzzling features (slowly-decaying radio fluxes, X-ray light-curve plateaus, chromatic X-ray light-curve breaks) to challenge the standard external-shock model and warrant various modifications. Below, I discuss some of these issues.
3.1 Light-curves and spectra
According to the temporal scalings identified in the previous section, the light-curves of GRB afterglows should display rises in the early phase, if the forward-shock emission is dominant (because the reverse-shock flux is most often expected to decay), followed by a decay, both being power-laws in time. Furthermore, the broadband afterglow spectra are expected to be rising at (radio) frequencies below the spectrum peak and fall-off at higher (X-ray) photon energies. Also expected is that the light-curve decay indices and spectral slopes satisfy one or more closure relationships and that, there is a positive correlation between and (from that ).
Figure 3 illustrates the flux power-law decays and power-law spectra typically observed for GRB afterglows. The light-curves chosen there display long-lived power-law decays, but many afterglows exhibit more diversity, their light-curves showing two or three power-law decays, sometimes even rising at earlier times, rarely exhibiting brightening episodes (in optical or X-ray) or sudden drops (in X-ray).
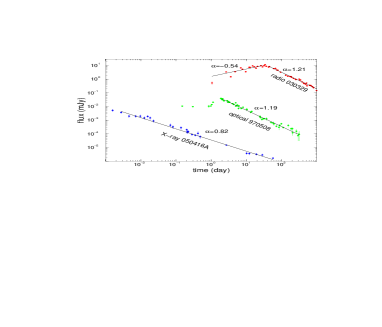
The broadband spectrum of GRB afterglow 030329 shown in Figure 3 displays an optically thick part (to self-absorption) in the radio, at earlier times, a constant peak flux up to 10 days, during which the radio flux rises slowly, followed by a decreasing peak flux and decreasing radio flux. For , as required by the radio spectrum (right panel), the rise of the radio flux, (left panel), is consistent with that expected from a decelerating forward-shock interacting with a homogeneous medium (), and marginally consistent with the forward-shock pre-deceleration emission for either a semi-relativistic reverse shock and wind medium () or a relativistic reverse shock and homogeneous medium ().
The evolution of spectral breaks is generally hard to determine observationally and use for identifying the correct afterglow model: self-absorption affects only the early radio emission, when the large flux fluctuations are caused by interstellar scintillation, while the cooling break is too shallow and evolves too slowly to be well measured even if it fell in the optical or X-ray bands. The best prospects for this test is offered by the injection break, which should cross the radio domain at tens of days, when the scintillation amplitude is reduced by the larger source size.
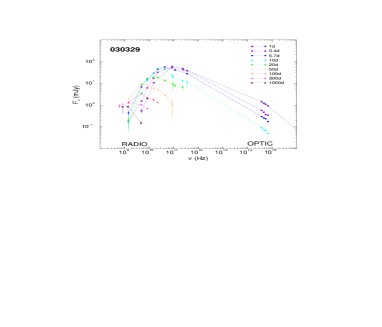
Sufficient radio coverage to construct radio afterglow spectra at many epochs and determine the peak frequency and flux is rarely achieved. GRB 030329 is one such case (Figure 4), the evolution of being slower than expected for a spherical blast-wave or a jet that does not expand (yet or ever) laterally (for either, for any medium stratification), while that of is close to that expected for a jet spreading laterally (for which ). Thus, the evolutions of and for GRB afterglow 030329 seem mutually inconsistent. The slower-than-expected evolution of requires that shock micro-physical are not constant (as assumed in the standard model), but the evolution of can be accounted for by a spherical blast-wave provided that the ambient medium density decreases as .

Evolution of the peak frequency and peak flux of the radio spectrum of GRB afterglow 030329, with peak time and measured from the peaks of radio light-curves (similar results would be obtained from the peaks of radio spectra at various epochs – right panel Figure 3). Solid lines show best-fit power-laws, dotted lines indicate fits.
Rising optical light-curves have been seen for more than a dozen afterglows up to 1 ks after trigger (Figure 5). If interpreted as the due to the pre-deceleration emission from the forward shock (e.g. molinari07 ), they require smaller than average initial ejecta Lorentz factors (if the reverse shock is semi-relativistic) or longer-lasting ejections. The existence of energetic ejecta with a significantly smaller ejecta Lorentz factor could also explain the late (1–2 d) sharp rise displayed by the optical afterglow of GRB 970508 (Figure 3).
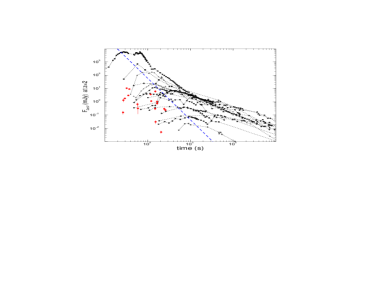
Optical light-curves of 15 afterglows displaying a rise, moved at same redshift. Red symbols show the first measurement of 19 other optical afterglows that exhibit a decay from the beginning. The blue dashed line indicates the best-fit to the peak time–peak flux anti-correlation of rising afterglows (). The earlier rises are sharp () and would require a homogeneous medium if they were attributed to the pre-deceleration emission from an isotropic forward-shock.
However, late-rising afterglows could also be due to a structured outflow endowed with two ”hot spots”, one moving directly toward the observer and giving the prompt GRB emission, and another one moving slightly off the direction toward the observer granot02A , at an angle , its emission becoming visible when the outflow Lorentz factor decreases to . The same result could be accomplished with an axially symmetric outflows having a bright core that yields the burst emission and a bright ring that produced the rising afterglow when it becomes visible. Thus, a late-rising afterglow may be a relativistic effect rather than the signature of some ejecta with a lower initial Lorentz factor, either shock (reverse or forward) being a possible origin of the rising afterglow. In fact, this model is found to account better for the peak luminosity–peak time anti-correlation exhibited by a dozen optical afterglows with early, fast rises than the pre-deceleration external-shock model alin08 , although it should be noted that only half of that correlation is real (i.e. optical peaks do not occur later and are not brighter than a certain linear limit in log-log space) while the other half is just an observational bias, as there are many optical afterglows exhibiting decaying fluxes from first measurement that fall below the peak flux–peak time relation found for the fast-rising afterglows (Figure 5).
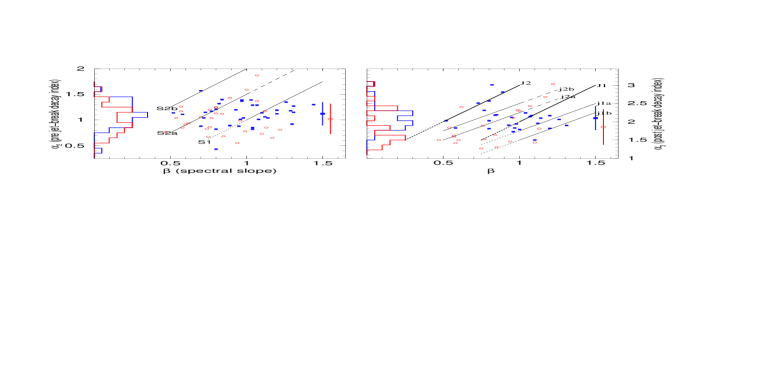
Most afterglow observations were made during the decay phase, where and are expected to be correlated and satisfy one or more closure relationships. The left panel of Figure 6 shows the temporal and spectral indices of optical and X-ray afterglows measured before the jet break and the expectations for the (post-deceleration) forward-shock model (as it seems more likely that the reverse shock dominates the afterglow emission only until at most 1 ks). Surprisingly, no significant correlation can be seen between and , which may be taken either as indication that the standard forward-shock model does not account for the diversity of afterglows (e.g. departures from its assumptions of constant shock parameters would be required to explain the decays below the ”S1” model, which are too slow) or that more than one variant of it realized which, combined with a small baseline in and , requires a much larger sample to reveal the expected underlying correlation.
3.2 Early optical afterglows
A bright optical emission arising from the reverse shock was predicted by sari99 and may have been observed for the first time in the optical counterpart (i.e. during the burst) accompanying GRB 990123 akerlof99 and in the early afterglow emission following GRB 021211, but without any further candidates until recently. Lacking a continuous, long-lived injection of new ejecta, and because of the adiabatic cooling, the reverse-shock emission should be confined to the early afterglow. Then, the early afterglow emissions of GRB 990123 and 021211 being brighter than the extrapolation of the later flux and decaying faster are two reasons for attributing those two early optical emissions to the reverse shock. The larger brightness (by 2.5 mag for 990123 and by 1 mag for 021211) could be explained by that the number of ejecta electrons is, at deceleration (i.e. around burst end), larger by a factor than in the forward shock, and by a smaller factor at later times (as for 021211), with some relative dimming of the reverse shock optical flux attributed to the peak of the reverse-shock synchrotron spectrum being lower than that of the forward shock.

Optical afterglows of GRBs 990123 and 021211, displaying a fast decay at earlier times. The late (after 1 ks) optical flux decay is fit with a power-law (solid, thick line), extrapolated to earlier times (dashed lines), subtracted from the early emission, leading to a steeper power-law decay of the ”residual” optical flux before 1 ks, which could be attributed to the adiabatically cooling ejecta after they have been energized by the reverse shock.
However, both the above reasons disappear if the origin of time is not at trigger but sometime later, e.g. at 30–40 s (corresponding to the peak of GRB 990123 optical flash). Then, the early optical emission appears as a small deviation of the extrapolation of the late flux and the entire afterglow light-curve is consistent with a single power-law, indicating a unique dissipation mechanism. Thus, absent spectral information, the evidence for a reverse shock origin of the early optical emissions of GRB 990123 and 021211 is circumstantial.
Such spectral information has been acquired only recently, for the early optical emission of GRB afterglows 061126 and 080319B. For the former, perley08 finds that the steeper-decaying early (up to 200 s) optical emission is harder than at later times (after 1 ks). The indices and of the early optical emission of GRB 061126 are consistent with the closure relation expected for adiabatic cooling ejecta. The spectral evolution observed simultaneously with the slowing of light-curve decay suggests the emergence of a different component after 1 ks.
The optical afterglow of GRB 080319B also displayed a spectral hardening simultaneous with the reduction in the flux decay rate wozniak08 , supporting a reverse-shock origin of the early fast-decay phase and forward-shock origin of the later slower-decaying emission. However, the decay at early times is too fast (for the measured spectral slope) to be attributed to the adiabatic cooling of ejecta. In fact, the decay index is consistent with the expectations for the large-angle emission released during the burst. However, that does not exclude a reverse-shock origin of the early optical flux, as the cooling frequency may have fallen below the optical, revealing the large-angle emission.
The slow softening of the optical spectrum of GRB afterglow 080319B after 1 ks was a surprise. If the rather flat () spectral slope at 1 ks were due to the peak energy of the forward-shock synchrotron spectrum being in the optical, then a much faster softening is expected, given that the injection frequency evolution is also fast. Energy injection in the blast-wave or an increasing electron/magnetic shock parameters could account for slow decrease of required by the slow spectral softening of GRB 080319B afterglow optical emission.
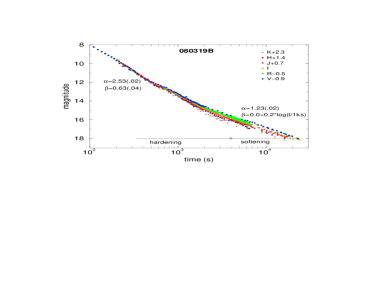
Multi-colour optical observations of GRB afterglow 080319B. Light-curves have been shifted by indicated amounts to overlay them at earliest measurements. The fanning of light-curves, with redder bands appearing dimmer than bluer bands, shows a hardening of the optical spectrum at 0.5–2 ks, simultaneous with the slowing of the decay rate, which indicates the emergence of a different emission component. A slow softening of the emission from the emerging component is seen. The faster-decaying early component and the slower-decaying late component are most naturally identifiable with the reverse and forward-shock emissions, respectively.
3.3 Jet-breaks
A tight collimation of GRB ejecta, into a jet of half-aperture less than 10 degrees, is desirable to reduce the isotropic-equivalent GRB output, reaching erg, to lower values, below erg, compatible with what the mechanisms for production of relativistic jets by solar-mass black-holes can yield. Besides the closure relationship being satisfied self-consistently (i.e. by a forward-shock model with same features before and after the jet-break), achromaticity of the break (i.e. simultaneous occurrence at all frequencies) is an essential test of this model.
The steepening of the afterglow flux decay due to collimation of ejecta was predicted by rhoads99 and was observed for the first time in the optical emission of GRB afterglow 990123 kulkarni99 . About 3/4 of well-monitored pre-Swift optical afterglows displayed jet-breaks at 0.5–3 day, as shown in the compilation of zeh06 . The X-ray coverage of pre-Swift afterglow extended over at most 1 decade in time and was insufficient to test for the existence of an X-ray light-curve break simultaneous with that seen in the optical.
A smaller fraction, between 1/3 and 2/3, of Swift X-ray afterglows also exhibit jet-breaks alin07A , defined as a steepening occurring after 0.1 day from a power-law decay with to one with . Comparing the post jet-break temporal and spectral indices with the expectations for the forward-shock model (right panel of Figure 6) shows that that model accounts for observations of post jet-break decays if jets are both both spreading and conical. However, just as for pre jet-break decays, the expected correlation is not seen.
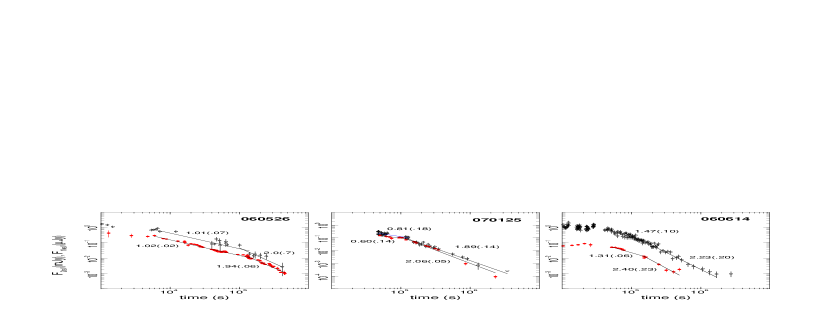
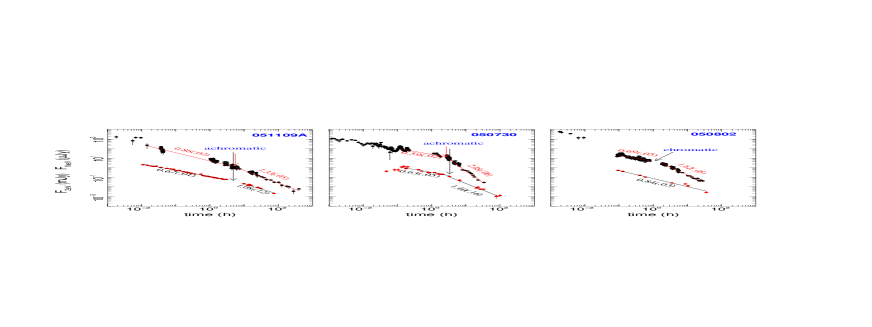
While there are many examples of potential jet-breaks in the X-ray light-curve monitored by Swift, few are sufficiently well-monitored in the optical to test for the achromaticity of the break. Figure 9 shows the only 3 afterglows sufficiently sampled and followed sufficiently late to search for achromatic light-curve breaks. Besides the simultaneity of the optical and light-curve breaks, note the equality of the pre and post-break decay indices.
The smaller fraction of Swift X-ray afterglows that exhibit jet-breaks, relative to that of pre-Swift such optical afterglows, could be due to Swift detecting and localizing afterglows that are fainter than those followed in the optical prior to Swift. The argument here is that, if all jets had the same energy (e.g. frail01 ), then the afterglow flux and jet-break time should be anti-correlated: and (for a wind-like medium), leading to , where is the forward-shock’s kinetic energy per solid angle, thus dimmer afterglows should display later jet-breaks.
As shown in Figure 10, the afterglows with jet-breaks at 0.3–10 days are brighter by a factor than those without jet-breaks detected until 10 days, thus the anti-correlation between afterglow flux and jet-break time expected for a universal jet energy is confirmed, even though jet energies inferred from the timing of afterglow light-curve breaks have a broad distribution (e.g. ghirlanda04 ). That ratio of 10 between the average brightness of afterglows with breaks and of those without breaks until 10 days and the above-derived imply that the latter type of afterglows should display a break at 3–100 days, which could be missed if monitoring does not extend for sufficiently long times. For this reason, some of the dimmer X-ray afterglows detected by Swift may have breaks that are too late to be observed, leading to an apparent paucity of Swift X-ray afterglows with jet-breaks, as noted by burrows06 .
Optical (left panel) and X-ray (right panel) fluxes of afterglows that displayed late light-curve breaks followed by decays steeper than (16 in optical, 12 in X-ray) or did not have a break until 10 days (12 optical, 10 X-ray), moved to same redshift, to illustrate that afterglows with light-curve jet-breaks (red symbols) are 10 times more luminous, on average, than those without such a break (black symbols).
3.4 Slowly-decaying radio afterglows
The long-time monitoring of radio afterglows showed that often there is an incompatibility between the radio and optical flux decays. After the peak of the forward-shock synchrotron spectrum falls below the radio domain, which should happen within days and is, indeed, observed in the radio spectra of GRB afterglows 970508 frail00 , 021004, and 030329 (Figure 4), the radio and optical flux decays are expected to be similar, up to a difference that could occur if the cooling break is in between radio and optical and if the jet is not laterally spreading.
In a set of nine pre-Swift afterglows with long temporal coverage at both frequencies, I find that the above expectation is met by only four: GRB afterglows 980703, 970508, 000418, and 021004, but that the radio flux of GRB afterglows 991208, 991216, 000301C, 000926, and 010222 decay much slower than in the optical, with , respectively alin04A (see also frail04 ). For all the above three cases for which the optical and radio decays are well-coupled, the decays are slower than , indicating a wide jet, while for all the five cases of decoupled radio and optical decays, the optical displays a decay steeper than after a day break that could be interpreted as a jet-break. Thus, whenever the optical flux decays fast, there seems to be a mechanism which produces radio emission in excess of that expected for the forward-shock model. An example of each type of radio afterglow is shown in Figure 11.
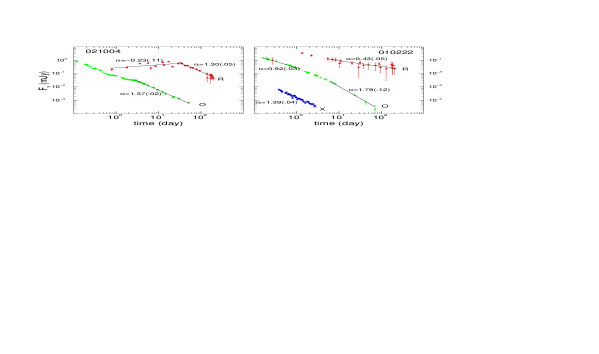
Coupled (left panel) and decoupled (right panel) optical and radio light-curves. For the former, the post-peak radio decay index is the same as in the optical; for the latter, the radio flux decays much slower than the post jet-break optical flux. From top to bottom, data are radio (red symbols), optical (green) and X-ray (blue) measurements.
Because the slow radio flux decay is observed at the same time as the faster optical decay, the decoupling of radio and optical light-curves cannot be attributed to energy injection in the blast-wave, to a structured outflow, or to evolving micro-physical parameters (mechanisms which have also been used to explain the slow early decays seen in Swift X-ray afterglow plateaus), nor to the transition to non-relativistic dynamics. Instead, the decoupled radio and optical light-curve decays may indicate that these emissions arise from different parts of the relativistic outflow.
That could happen if the outflow endowed with angular structure (in the sense that its kinetic energy per solid angle is anisotropic), with a core that dominates the optical emission, yielding the jet-break, and an outer, wider envelope that produces the radio emission. The problem with this model alin04A is that, optical and radio afterglows being long-lived, the spectral break frequencies of the core and envelope emissions evolve substantially, making it impossible for their emissions to be dominant over such long timescales at only one frequency, i.e. without ”interfering” with the emission of the other part of the outflow. Shortly put, it is quite likely that the emission from the radio envelope would soon dominate the optical emission from the core and change the initially steep optical flux decay into a slower one. (While that is a general issue for explaining decoupled afterglow light-curves with a structured outflow, racusin08 shows that it can be avoided for GRB 080319B, whose optical and X-ray light-curve decays are decoupled for until 1 day).
Another possibility is that the optical emission arises in the forward shock while the radio is from the reverse shock. For adiabatic cooling, the ejecta emission should decay slowly, even when observations are at a frequency below that of the spectral peak, thus a reverse shock energizing the ejecta is required to account for the flat or slowly rising part of radio light-curves (up to about 10 days). In this case, the light-curve decay depends on the law governing the injection of fresh ejecta into the reverse shock, the observed radio light-curve indices being close to the closure relations derived in the previous section for a uniform radial distribution of the incoming ejecta mass.
In the reverse-forward shock model for afterglows with different radio and optical light-curve decays, the cross-interference issue may also exist, as the forward-shock synchrotron peak flux, being larger than mJy at 1 day (to account for the 20 magnitude optical flux), could over-shine the reverse-shock radio emission at some later time, when the peak energy of the forward-shock emission spectrum reaches the radio domain. This issue is best addressed with numerical calculations of the blast-wave dynamics and radiation. In this way, I found alin05 that the most likely solution for the decoupled radio and optical light-curves is that the radio afterglow emission is dominated by the reverse shock during the first decade in time, with the forward-shock emission peaking in the radio at about 100 days, overtaking that from the reverse shock sometime during the second decade. By itself, each component would display a decay faster than observed, but their sum resembles a shallow power-law over two decades in time.
3.5 X-ray plateaus and chromatic breaks
The Swift satellite has opened a new temporal window for observations of X-ray afterglows, which previously were monitored by BSAX only after 8 hours after trigger. The major surprise (i.e. a feature not predicted) in Swift observations was that, although it appeared that the X-ray afterglow emission at hours and days extrapolated back to the burst time would match the GRB flux, implying a smooth transition from counterpart to afterglow emission, the X-ray flux from burst end to several hours is much less than that back-extrapolation, displaying at 0.3–10 ks a phase of slow decay, with . In fact, that should have been a partial surprise because BSAX has observed a sharply decaying GRB tail in at least three cases, indicating that a phase of slow X-ray decay must exist at the burst end. Figure 12 illustrates the ”plateau” phase observed for GRB afterglow 050315.
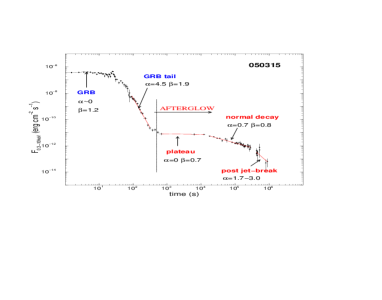
X-ray emission during the prompt and afterglow phases of GRB 050315. The plateau (slow decay at 1–10 ks) is a novel feature discovered by Swift in about 3/4 of X-ray afterglows.
In the simplest form of the blast-wave model, the magnitude of the light-curve decay steepening at the end of the plateau requires the peak of the synchrotron spectrum to fall below the X-ray band at the end of the plateau. However, that explanation is ruled out by that, observationally, the plateau end is most often not accompanied by the a spectral evolution nousek06 ; willingale07 ; liang07 , although exceptions exist butler07 .
Because the plateau phase is followed by a ”normal” decay, compatible with the expectations of the standard forward-shock model, it is natural to think that departures from the assumptions of that standard model are the cause of X-ray plateaus: (1) increase of the average energy per solid angle of the blast-wave area visible to the observer by means of (1a) energy injection in the blast-wave owing to some late ejecta catching-up with the forward-shock nousek06 ; zhang06 ; alin06 , or by absorbing low-frequency electromagnetic radiation from a millisecond pulsar zhang06 , (1b) an anisotropic outflow alin06 ; eichler06 , (2) evolving shock micro-physical parameters fan06 ; ioka06 , and (3) blast-wave interacting with an ”altered” ambient medium, shaped by a GRB precursor ioka06 . The effect on the afterglow flux decay of the above mechanisms for a variable ”apparent” kinetic energy of the blast-wave were first investigated by meszaros98 ; rees98 , the X-ray plateaus discovered by Swift several years later providing the first tentative confirmation that those mechanisms may be at work.
However, the discovery of chromatic light-curve breaks at the end of the X-ray plateau fan06 ; watson06 ; alin06A , which are not seen in the optical as well, soon showed that neither of the above mechanisms for X-ray plateaus provide a complete picture of the afterglow phenomenon, as in all those models the break should be achromatic, manifested at all frequencies. Evolution of shock parameters for electron and magnetic field energies could ”iron out” the optical light-curve break produced by the other mechanisms listed above, provided that the cooling frequency is between optical and X-ray (to allow a way of decoupling the optical and X-ray light-curves), however there is no reason for their evolution to conspire and hide the optical light-curve break so often (universality of the required micro-physical parameter evolutions with blast-wave Lorentz factor would provide some support to this contrived model).
To date, I find that there are 11 good cases of chromatic X-ray breaks, 6 good cases of achromatic breaks, and 3 afterglows displaying well-coupled optical and X-ray light-curves: a single power-law decay, of same decay index at both frequencies, extending over over three decades in time. Figure 13 shows two examples of achromatic breaks, one with discrepant post-break optical and X-ray decay indices, and one chromatic X-ray break.
To explain the chromatic X-ray breaks, uhm07 and genet07 have proposed that the entire afterglow emission is produced by the reverse shock and have shown that, by placing either the injection or the cooling frequency between optical and X-ray, decoupled light-curves can be obtained. Just as energy injection in the blast-wave, this mechanism relies on the existence of a long-lived central engine that expels ejecta until the last afterglow measurement (the existence of a reverse shock at days is also required by the slow decays seen in a couple of radio afterglows). On the other hand, the transition observed in two optical afterglows from a fast-decaying phase to one of slower decay at 1 ks, accompanied by spectral evolution, argue in favour of the reverse-shock emission being dominant only up to 1 ks, after which it seems more natural to attribute the afterglow emission to the forward-shock. Furthermore, the results shown by uhm07 show a softening of the reverse-shock optical spectrum at the transition from fast to slow decay, which is in contradiction with the hardening observed in GRB afterglows 061126 and 080319B. Thus, the reverse-shock model may not provide a correct description of the entire afterglow emission.
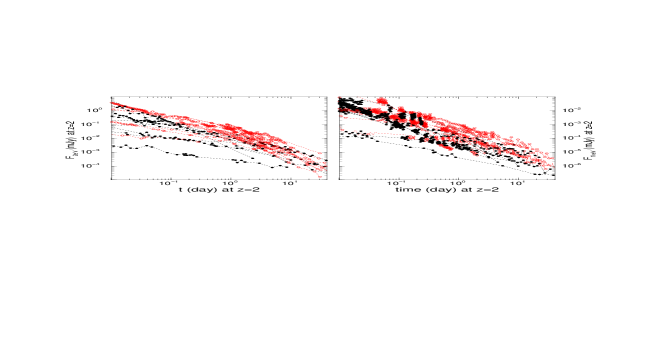
On average, the X-ray to optical flux ratio is larger for afterglows with chromatic X-ray breaks than for afterglows with coupled optical and X-ray light-curves (i.e. with achromatic breaks or single power-law decays), as shown in Figure 14. This indicates that chromatic X-ray breaks are due to a mechanism whose emission over-shines an underlying one only in the X-rays, but not in the optical. Thus, it seems that the diversity of optical vs. X-ray light-curve behaviours should be attributed to the existence of two mechanisms for afterglow emission and not to a unique origin.
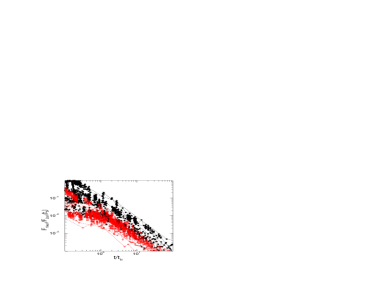
X-ray flux normalized to optical flux at the plateau end for 11 afterglows (black symbols) with chromatic X-ray breaks (GRB 050401, 050607, 050802, 060605, 060927, 061121, 070110, 070420, 080310, 080430, 080605) and 9 afterglows (red symbols) with coupled light-curves (6 achromatic breaks at plateau end: GRB 051109, 060206, 060526, 060614, 060714, 060729, and 3 long-lived power-law decays of same index at both frequencies: GRB 050801, 060418, 061007). Time is normalized to the plateau end, occurring at ks (for the 3 afterglows with single power-law decays, ks was chosen as reference epoch). Afterglows with chromatic X-ray breaks have a larger ratio than afterglows with coupled light-curves: and , respectively, indicating the existence of a mechanism which yields an X-ray emission brighter by a factor than that produced by the optically-radiating mechanism, for afterglows with chromatic X-ray light-curve breaks.
So far, three proposals along that line have been put forth: dust-scattering of the blast-wave emission, bulk and inverse-Compton scattering of the same emission, and a central-engine mechanism that could be the same internal shocks in a variable wind that are believed to produce the prompt burst emission rees94 .
shao07 have proposed that X-ray plateaus result from scattering by dust in the host galaxy, much like the expanding rings produced by dust-scattering in our Galaxy in GRB afterglows 031203 vaughan04 and 050713A tiengo06 . However, for dust-scattering, harder photons are those scattered at a smaller angle, thus they arrive earlier at observer, leading to a strong spectral softening of the X-ray light-curve plateau, of , and to a strong dependence of the plateau duration on the photon energy, , both of which are clearly refuted by afterglow observations shen08 .
ghisellini08 have proposed that, in some afterglows, the ”central engine” makes a substantial contribution to the afterglow X-ray flux. This model requires a central engine that operates until the last afterglow detection; the dissipation mechanism may be shocks in a variable outflow, which can also account for the bright and short-lived flares observed in many Swift X-ray afterglows (e.g. burrows07 ; chincarini07 ).
Given that the forward-shock model with cessation of energy injection at the plateau end can explain the achromatic breaks and that the standard forward-shock model accounts for the coupled single power-law light-curves, it would be more desirable to identify a mechanism for producing decoupled X-ray and optical light-curves that is related to the forward shock and which dominates its emission only occasionally.
Bulk and inverse-Compton scattering of the forward-shock photons by an outflow interior to the blast-wave is such a mechanism. In this model alin08A , all the afterglow emission originates in the forward shock, which explains so naturally the long-lived, power-law decay of GRB afterglows, coupled optical and X-ray light-curves resulting when the scattered emission is dimmer than the forward-shock’s, while chromatic X-ray light-curve breaks occur when the scattered emission is dominant in the X-ray. For this model to work, the scattering outflow must be almost purely leptonic, to ensure a sufficiently high (sub-unity) optical depth to electron scattering to account for the observed X-ray flux, assuming that the kinetic energy of the scattering outflow is not much larger than that of the forward shock. The same outflow also injects energy into the blast-wave and, if that energy is larger than the forward shock’s, then it mitigates the blast-wave deceleration, producing a light-curve plateau ending with an achromatic break when the injected energy falls below that of the forward shock and stops being dynamically important. Therefore, a delayed outflow is the origin of both chromatic and achromatic light-curve breaks, the former occurring when the scattered emission is dominant, while the latter happening when the forward-shock emission is dominant. Still, the achromatic break of GRB 050730 (Figure 13), followed by an X-ray flux decay much steeper than that of the optical cannot be explained with only cessation of energy injection at the time of the break, and requires an extra feature, that the shock micro-physical parameters are not constant.
The above scattering model also explains late X-ray flares, which arise from dense or hot (i.e. with relativistic electrons) sheets within the outflow. When dominant, the scattered X-ray emission received at time reflects the properties (density, Lorentz factor) of the outflow at behind the forward shock, sharp drops of the X-ray flux as that observed for GRB afterglow 070110 at 30 ks being due to a gap in the scattering outflow.
For an instantaneous release of all the ejecta, the kinematics of outflow radial-spreading owing to different initial Lorentz factors, followed by deceleration of the forward-shock, leads to that, when the ejecta of Lorentz factor catch up with the forward shock, moving at , the Lorentz factor contrast is (i.e. 2 for a homogeneous medium and for a wind). That ratio is too small for bulk-scattering to boost enough the forward-shock emission to dominate that arriving directly from the forward shock. But, if the scattering outflow was energized by internal shocks, inverse-Compton scatterings by relativistic electrons (of comoving frame energy ) can achieve that goal. In fact the properties of the scattered emission depend only on the product . Thus, for a sudden release of ejecta to lead to a sufficiently bright scattered emission, the scattering outflow should be hot. Alternately, if the scattering outflow is cold, then the larger ratio necessary for the scattered flux to over-shine that from the forward shock requires a long-lived engine.
As a general test of all models that explain decoupled optical and X-ray afterglows by attributing them to different mechanisms, there should not be any afterglows whose optical and X-ray light-curves evolve from decoupled (i.e. with a chromatic break) to coupled (i.e. with an achromatic break), or vice-versa, unless one of the light-curves displays a sudden flux or spectral change that would indicate a second mechanism becoming dominant. So far, I find only two cases of afterglows whose optical and X-ray light-curves evolve from decoupled to coupled (GRB afterglows 070110 and 080319B), but their X-ray light-curves display, indeed, a sharp drop (at 20 ks, in both cases).
4 Conclusions
The temporal and spectral properties of GRB afterglows are, in general, consistent with those predicted for the synchrotron emission from the blast-wave produced when highly relativistic ejecta (initial Lorentz factor above 100) interact with the ambient medium.
As expected from shocks accelerating particles with a power-law distribution with energy, power-laws are observed in the optical and X-ray afterglow continua. A spectral softening (i.e. decrease of peak frequency) is expected owing to the blast-wave deceleration and is observed in radio afterglows spectra and in the behaviour of afterglow radio light-curves, which rise slowly until the synchrotron spectrum peak reaches the radio domain and fall-off afterward.
Rising afterglow light-curves are seen at early times in the optical, and are consistent with the pre-deceleration emission from the forward shock, although a structured outflow with a hot-spot that gradually becomes visible to the observer is also possible, in which case the rising afterglow emission could also be explained with the reverse shock.
Much more often, afterglow light-curves display power-law decays of indices that are not correlated with the spectral slopes, as would be expected for the external-shock model. That inconsistency could be due to a substantial intrinsic scatter in decay indices and spectral slopes, owing to more than one variant of the blast-wave model occurring in GRB afterglows, combined with a small range of those indices being realized.
Bright optical flashes accompanying the burst emission were predicted to arise from the reverse shock, owing to the larger number of ejecta electrons than in the forward shock. Fast-falling optical light-curves have been observed at 100–1000s in two afterglows (991023 and 021211), followed by a slower of the decay, which was taken as evidence for the reverse-shock emission dominating the early afterglow, although spectral information was not available to test that hypothesis. More recently, the early optical spectral slopes were measured for two afterglows (061126 and 080319B), the decay of the former being consistent with that from adiabatically-cooling ejecta, while the later is faster than expected and consistent with it being the large-angle emission released at an earlier time.
For the above two optical afterglows with spectral information at early times, the slowing of the optical flux decay at 1 ks is accompanied by a spectral evolution, which indicates the transition from one mechanism to another. Most naturally, that is the transition from ejecta emission to forward-shock emission, with the reverse-shock emission being relevant for the optical afterglow only during its early phase.
Evidence for a reverse-shock emission is also provided by the slow radio flux decays observed after 10 day in several afterglows. Adiabatically cooling ejecta would yield a decay faster than observed, particularly if the synchrotron cooling frequency were to fall below the radio, thus a reverse-shock accelerating ejecta electrons is required to operate for days and produce a radio emission decaying much slower than the optical at the same time, the latter being attributed to the forward shock. Together with the above conclusion regarding the contribution of the reverse shock to the early optical afterglow, this suggests that the reverse shock is the main afterglow source for a duration that decreases with observing frequency, perhaps never being dominant in the X-rays and having no connection with the chromatic X-ray light-curve breaks seen at ks in most afterglows.
That the X-ray-to-optical flux-ratio is larger (by a factor 5) for afterglows with chromatic X-ray light-curve breaks than for those with coupled optical and X-ray light-curves (i.e. with achromatic breaks or similar power-law decays), indicates the existence of a different mechanism producing the X-ray emission of afterglows with chromatic X-ray breaks, coupled light-curves resulting when the emission from that novel mechanism is negligible. Long-lived internal shocks or scattering of the blast-wave emission by an outflow located behind it are two possibilities that could explain chromatic X-ray breaks, as well as the flares seen in many X-ray light-curves. The latter mechanism is also related to energy injection in the blast-wave, whose cessation accounts naturally for achromatic light-curve breaks. Thus, in the scattering model, the diversity of optical and X-ray light-curve relative behaviours is attributed to the interplay between the scattered and direct blast-wave emissions, combined with the changing dynamics of the blast-wave produced when the scattering outflow brings into the shock more energy than already existing.
On energetic grounds, GRB outflows should be collimated into jets narrower than 10 degrees. The steepening of the afterglow flux decay when the jet boundary becomes visible to the observer was another major prediction confirmed by observations. Just as for the pre jet-break phase, more than one jet model is required to account for the measured decay indices (given the observed spectral slopes). Swift X-ray afterglows display light-curve jet-breaks less often than pre-Swift optical afterglows, which could be due to that the former afterglows (being dimmer) arise from wider jets whose jet-breaks occur later and could, thus, be missed more often.
References
-
(1)
- (2) B. Paczyński, ApJ 308, L43–L46 (1986)
- (3) J. Goodman, ApJ 308, L47–L50 (1986)
- (4) A. Shemi, T. Piran, ApJ 365, L55–L58 (1990)
- (5) P. Mészáros, M. Rees, MNRAS 258, P41–P44 (1992)
- (6) K. Hurley et al, Nature 372, 652–654 (1994)
- (7) J. Bloom, D. Frail, R. Sari, AJ 121, 2879–2888 (2001)
- (8) E. Fenimore, R. Epstein, C. Ho, A&AS 97, 59–62 (1993)
- (9) Y. Lithwick, R. Sari, ApJ 555, 540–545 (2001)
- (10) G. Taylor, D. Frail, E. Berger, S. Kulkarni, ApJ 609, L1–L4 (2004)
- (11) J. Goodman, New Astronomy 2, 449–460 (1997)
- (12) E. Waxman, S. Kulkarni, D. Frail, ApJ 497, 288–293 (1998)
- (13) P. Mészáros, P. Laguna, M. Rees, ApJ 415, 181–190 (1993)
- (14) T. Piran, A. Shemi, R. Narayan, MNRAS 263, 861–867 (1993)
- (15) M. Lyutikov, New Journal of Physics 8, 119–142 (2006)
- (16) M. Medvedev, A. Loeb, ApJ 526, 697–706 (1999)
- (17) L. Wen, A. Panaitescu, P. Mészáros, ApJ 486, 919–927 (1997)
- (18) R. Wijers, T. Galama, ApJ 523, 177–186 (1999)
- (19) J. Granot, T. Piran, R. Sari, ApJ 527, 236–246 (1999)
- (20) Z. Uhm, A. Beloborodov, ApJ 665, L93–L96 (1007)
- (21) F. Genet, F. Daigne, R. Mochkovitch, MNRAS 381, 732–740 (2007)
- (22) S. Kobayashi, R. Sari, ApJ 542, 819–828 (2000)
- (23) P. Mészáros, M. Rees, ApJ 476, 232–237 (1997)
- (24) R. Sari, T.Piran, ApJ 517, L109–L112 (1999)
- (25) S. Kobayashi, ApJ 545, 807–812 (2000)
- (26) A. Panaitescu, P. Kumar, MNRAS 353, 511–522 (2004)
- (27) S. Kobayashi, B. Zhang, ApJ 597, 455–458 (2003)
- (28) P. Kumar, A. Panaitescu, ApJ 541, L51–L54 (2000)
- (29) E. Fenimore, M. Sumner, preprint,
http://xxx.lanl.gov/abs/astro-ph/9705052 (1997)- (30) R. Sari, T. Piran, R. Narayan, ApJ 497, L17–L20 (1998)
- (31) A. Panaitescu, P. Mészáros, M. Rees, ApJ 503, 314–324 (1998)
- (32) R. Chevalier, Z. Li, ApJ 520, L29–L32 (1999)
- (33) J. Granot, R. Sari, ApJ 568, 820–829 (2002)
- (34) J. Rhoads, ApJ 525, 737–749 (1999)
- (35) B. Paczyński, J. Rhoads, ApJ 418, L5–L8 (1993)
- (36) R. Wijers, M. Rees, P. Mészáros, MNRAS 288, L51–L56 (1997)
- (37) D. Kann et al, preprint, http://arxiv.org/abs/0712.2186 (2007)
- (38) P. O’Brien et al, ApJ 647, 1213–1237 (2006)
- (39) R. Willingale et al, ApJ 662, 1093–1110 (2007)
- (40) C. Akerlof et al, Nature 398, 400–402 (1999)
- (41) S. Kulkarni et al, Nature 398, 389–393 (1999)
- (42) A. Panaitescu, P. Kumar, R. Narayan, ApJ 561, L171–L174 (2001)
- (43) D. Kann et al, preprint, http://xxx.lanl.gov/abs/0804.1959 (2008)
- (44) E. Molinari et al, A&A 469, L13–L16 (2007)
- (45) J. Granot, A. Panaitescu, P. Kumar, S. Woosley, ApJ 570, L61–L64 (2002)
- (46) A. Panaitescu, T. Vestrand, MNRAS 387, 497–504 (2008)
- (47) D. Perley et al, ApJ 672, 449–464 (2008)
- (48) P. Wozńiak et al, preprint, http://arxiv.org/abs/0810.2418 (2008)
- (49) A. Zeh, S. Klose, D. Kann, ApJ 637, 889–900 (2006)
- (50) A. Panaitescu, MNRAS 380, 374–380 (2007)
- (51) D. Frail et al, ApJ 562, L55–L58 (2001)
- (52) G. Ghirlanda, G. Ghisellini, D. Lazzati, ApJ 616, 331–338 (2004)
- (53) D. Burrows, J. Racusin, Il Nuovo Cimento B 121, 1273–1287 (2006)
- (54) D. Frail, E. Waxman, S. Kulkarni, ApJ 537, 191–204 (2000)
- (55) A. Panaitescu, P. Kumar, MNRAS 350, 213–231 (2004)
- (56) D. Frail, ApJ 600, 828–833 (2004)
- (57) J. Racusin et al, Nature 455, 183–188 (2008)
- (58) A. Panaitescu, MNRAS 363, 1409–1423 (2005)
- (59) J. Nousek et al, ApJ 642, 389–400 (2006)
- (60) E. Liang, B-B Zhang, B. Zhang, ApJ 670, 565–583 (2007)
- (61) N. Butler, D. Kocevski, ApJ 668, 400–408 (2007)
- (62) B. Zhang et al, ApJ 642, 354–370 (2006)
- (63) A. Panaitescu et al, MNRAS 366, 1357–1366 (2006)
- (64) D. Eichler, J. Granot, ApJ 641, L5–L8 (2006)
- (65) Y. Fan, T. Piran, MNRAS 369, 97–206 (2006)
- (66) K. Ioka, K. Toma, R. Yamazaki, T. Nakamura, A&A 458, 7–12 (2006)
- (67) P. Mészáros, M. Rees, R. Wijers, ApJ 499, 301–308 (1998)
- (68) M. Rees, P. Mészáros, ApJ 496, L1–L4 (1998)
- (69) D. Watson et al, ApJ 652, 1011–1019 (2006)
- (70) A. Panaitescu et al, MNRAS 369, 2059–2064 (2006)
- (71) M. Rees, P. Mészáros, ApJ 430, L93–L96 (1994)
- (72) L. Shao, Z. Dai, ApJ 660, 1319–1325 (2007)
- (73) S. Vaughan et al, ApJ 603, L5–L8 (2004)
- (74) A. Tiengo, S. Mereghetti, ApJ 449, 203–209 (2006)
- (75) R. Shen et al, preprint, http://arxiv.org/abs/0806.3541 (2008)
- (76) G. Ghisellini, M. Nardini, G. Ghirlanda, A. Celotti, preprint, http://arxiv.org/abs/0811.1038 (2008)
- (77) D. Burrows et al, PTRAS 365, 1213–1226 (2007)
- (78) G. Chincarini et al, ApJ 671, 1903–1920 (2007)
- (79) A. Panaitescu, MNRAS 383, 1143–1154 (2008)
- (2) B. Paczyński, ApJ 308, L43–L46 (1986)
- (80)