Evidence of the in the reaction
Abstract
The reaction has been studied to search for the evidence of the by detecting pairs at forward angles. The Fermi-motion corrected invariant mass distribution shows a narrow peak at GeV/. The statistical significance of the peak calculated from a shape analysis is 5.1 , and the differential cross-section for the reaction is estimated to be nb/sr in the photon energy range from 2.0 GeV to 2.4 GeV in the LEPS angular range by assuming the isotropic production of the in the center-of-mass system. The obtained results support the existence of the .
pacs:
12.39.Mk, 13.60.-r, 14.20.Jn, 14.80.-jI INTRODUCTION
Since the LEPS collaboration reported the observation of a narrow baryon resonance-like structure in the invariant mass spectrum produced in reactions LEPS , a considerable number of experiments have been carried out to check the existence of the exotic baryon, now called the . The is a genuine exotic baryon with the minimum quark configuration of , for which a narrow decay width and a light mass were first predicted by Diakonov, Petrov, and Polyakov using a chiral quark soliton model Diakonov . Although the LEPS result seemed to be supported by several experiments which reported positive evidence for the existence of the in various reactions DIANA ; CLAS ; SAPHIR ; CLAS2 ; nu ; HERMES ; ZEUS ; COSY ; SVD , the experimental situation soon became controversial.
Many experiments at the high energy, especially collider experiments, found no positive evidence in the invariant mass distributions with a good mass resolution and high statistics HyperCP ; HERA-B ; ALEPH ; BES ; BABAR ; CDF ; SPHINX . A typical upper limit for the inclusive production rate for the is less than 1% of that of the (1520). The production mechanism of the might be very different from those of ordinary baryons if the exists Titov2004 .
The CLAS collaboration searched for the in the reaction in the photon energy range from 1.6 GeV to 3.8 GeV with an integrated luminosity of 70 pb-1 DeVita2006 . The upper limit for the reaction was determined to be 0.7 nb. The non-observation of the might be explained by a weak coupling Azimov:2006 . On the other hand, if the coupling constant is small, the photo-production cross-section of the from a proton could be much smaller than that from a neutron Nam2006 .
The experiment which is most relevant to the current study was also carried out by the CLAS collaboration McKinnon2006 . The search was done by detecting all charged particles in the final state in reactions with one order of magnitude higher statistics than the previous experiment CLAS . The neutron momentum was reconstructed by using the missing momentum technique, and the was searched in the invariant mass distribution. No narrow peak was observed, and the upper limit (95 % CL) for the elementary reaction was obtained to be 3nb by using a phenomenological model based on the (1520) production to estimate the probability that the spectator proton is re-scattered and gains enough energy to be detected by the CLAS detector.
Other dedicated experiments using Miwa2006 , Miwa2007 , and proton AbdelBary2006 beams have also shown no evidence for the production. Although the theoretical interpretation of those null results contains some uncertainties due to model dependences in the cross-section calculations, a strong coupling is unlikely if the exists.
A model independent determination of the width is possible by investigating the reverse reaction of the decay: . The DIANA collaboration observed evidence of the in the invariant mass distribution from reactions in a bubble chamber. The width was estimated to be MeV/c2 from the production cross-section Barmin2007 . This result is barely consistent with the 90%-CL upper limit of 0.64 MeV/ from the Belle collaboration obtained by analyzing events from secondary kaon interactions in the material of the detector Abe2005 .
To summarize the situation, if the exists, 1) its production is highly reaction dependent, 2) the coupling to must be small, and 3) the decay width must be less than 1 MeV/. Thus, it is desirable to study reactions which are sensitive to the coupling. The quasi-free reaction is one of such reactions since a can couple to a pair.
In this paper we present a study of the photo-production of the from a neutron by closely comparing it with the photo-production of the from a proton in a deuteron. Because the LEPS detector has a symmetric acceptance for positive and negative particles, a similar procedure can be applied to the both analyses. The validity of corrections and event selection criteria can also be cross-checked.
The analysis is performed using the data collected with the LEPS detector in 2002-2003, where the statistics has been improved by a factor of 8 over the previous measurement LEPS .
II LEPS BEAMLINE AND DETECTOR
A photon beam in the energy range from 1.5 GeV to 2.4 GeV is produced at SPring-8 by Compton back-scattering of laser photons from 8 GeV electrons in the storage ring. The energy of a scattered photon is measured by tagging the electron which is associated with the Compton scattering event by event. The energy resolution for the tagged photon is 10 MeV, and typical beam intensity with a 351-nm Ar laser is 106 photons/sec. The photons are alternatively injected into liquid deuterium (LD2) or liquid hydrogen (LH2) targets in a 16-cm long cell made of aluminum. The height of the interior of the cell is 60 mm, and the width is 40 mm at the entrance and 100 mm at the exit. The windows of the cell are made of a Kapton polyimide film of 125 m in thickness.
The LEPS detector is a forward magnetic spectrometer which consists of a start counter (SC), a silicon vertex counter, an aerogel Cherenkov counter (AC), three drift chambers, a dipole magnet, and a wall of time-of-flight scintillation counters (TOF). The aperture of the 0.7-T dipole magnet is 55 cm high and 135 cm wide. The pole length is 60 cm. The angular coverage of the spectrometer is approximately and degrees in the horizontal and the vertical directions, respectively. The distance from the SC to the TOF is 4 m. A typical momentum resolution, , for a charged particle with GeV/ is 0.6 %, and the TOF resolution is 140 ps. The details of the detector and the quality of the particle identification are described elsewhere Sumihama2006 .
The event trigger requires a coincidence of signals from the SC and TOF. A particle with GeV/ cannot reach the TOF. Signals from the AC are used to veto events with pair-created or a pion with GeV/ online. A typical trigger rate is 90 Hz for the LD2 runs and 60 Hz for the LH2 runs.
The integrated numbers of photons in the energy range GeV and GeV were and for the LD2 target runs, and the corresponding numbers were and for the LH2 target runs. The total numbers of events collected with the LD2 target and the LH2 target were and , respectively. Events in the energy range GeV have been used for the current study.
III EVENT SELECTION
We select events of the type , where denotes particles which are not required to be identified by the LEPS detector.
The momentum of a charged particle is reconstructed from the track information, and the velocity is obtained from the track length and the TOF information. The mass of the charged particle is calculated from the reconstructed momentum and velocity. The momentum dependent mass resolution for a kaon is calculated by using the measured momentum and TOF resolutions. A charged particle is identified as a kaon if the reconstructed mass is within 3.5 of the nominal value. Events with a pair are selected, and the vertex point of the two kaon tracks is required to be within the target volume. A hit position of a track in the vertical direction at the TOF wall is reconstructed from the charge ratio and time difference of the signals from both ends of a TOF counter, and the horizontal position is obtained from the counter segmentation. The consistency between the reconstructed hit position and the extrapolated track at the TOF wall is checked to remove events with a decay-in-flight kaon. A total of 25820 and 8675 events passed all the selection cuts for the LD2 runs and LH2 runs, respectively.
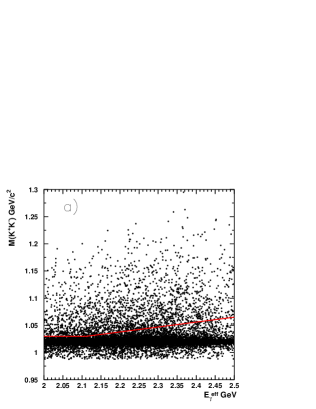
The invariant mass () distribution for the LD2 runs is shown in Fig. 1(a). A narrow peak at 1.02 GeV/ is due to decays. Events with 1.01 GeV/ 1.03 GeV/ account for approximately 74% of the events. The missing mass ( distribution for the LH2 runs is shown in Fig. 1(b). These events are dominated by elastic processes. The missing mass resolution for a proton is seen to be 10 MeV/. Inelastic events with a high missing mass value of GeV/ are 3.5 % of the selected events. Events due to misidentification of a pion pair, which result in a low missing mass value, are estimated to be less than 1 %. The distribution for the LD2 runs is shown in Fig. 1(c). The struck nucleon in the initial state has been assumed to be at rest. The peak near the nucleon mass is wide due to the Fermi motion of the nucleon. Some of the events in the lower tail region are due to coherent processes Chang2008 , which are identified as a small peak at 1.88 GeV/ in the missing mass ( distribution as shown in Fig. 1(d).
IV MINIMUM MOMENTUM SPECTATOR APPROXIMATION
Because the momenta of the target nucleons are not measured, some approximation is necessary to obtain the invariant mass of or pairs from reactions. The processes of interest are sequential processes of quasi-free productions of or and their decays; and . We call the remaining nucleon which is not associated with the quasi-free processes a spectator. The spectator momentum due to the Fermi motion is approximately 80 MeV/ for a deuteron. And it is small compared with momenta of a photon and kaons which are detected by the LEPS spectrometer. Therefore, the simplest approximation is to neglect the existence of a spectator. In this case the invariant mass is obtained by calculating a missing mass ( with the assumption that the struck neutron is at rest in the initial state and always on-shell. We call this approximation the free nucleon approximation (FNA). A Monte-Carlo simulation study shows the mass resolution of the using the FNA is 30 MeV/, which is mainly determined by the Fermi motion of a neutron.
The minimum momentum spectator approximation (MMSA) has been developed in order to improve the mass resolution. In the MMSA a spectator is assumed to have the minimum momentum for the given total energy-momentum () of a pair, which is in turn assumed to be equal to the missing energy-momentum of the reaction:
| (1) |
This assumption is not valid for inelastic events with an additional pion. However, these events can be removed easily as it will be shown below. Note that is derived from measured quantities and the deuteron mass (. The magnitude of the nucleon momentum ( in the center-of-mass system is then given by
| (2) |
in terms of the proton mass (, the neutron mass ( ), and the invariant mass of a pair ( ). If, for a particular event, is found to be less than due to finite detector resolutions and coherent contributions, it is set equal to .
The momentum of a nucleon in the laboratory system has the minimum magnitude if the direction is anti-parallel to that of the total missing momentum. This topology is assumed in the MMSA. The minimum momentum, , is defined as the component of the spectator momentum in the direction of the missing momentum. Thus, it is given by
| (3) |
where is the mass of a nucleon which is assumed to be a spectator. With this approximation, the momentum component of the other nucleon in the direction of the missing momentum is given by
| (4) |
If we assume that a spectator is a proton, the momentum of a neutron in the final state is given by
| (5) |
The invariant mass of the is calculated by using the above and a measured momentum. The resolution for the mass using the MMSA is 11 MeV/, which is an improvement over the FNA by a factor of 3.
Events which are not associated with quasi-free processes can be identified from a large value. Coherent processes which have a deuteron in the final state are characterized by a positive value which is approximately equal to a half of . Inelastic reactions which create a pion in addition to a kaon pair cause to have a large negative value. Re-scattering processes cause the distribution to be dispersed. By requiring to be small, these background events can be reduced.
The distribution for the selected events is shown in Fig. 2(a). The main contribution from quasi-free processes results in a peak near zero. The contribution from coherent processes is seen as a bump near 0.15 GeV/, and the inelastic events concentrate in the region below -0.1 GeV/. The projection of the spectator momentum onto the axis of () is well approximated by as shown in Fig. 2(b) for a Monte-Carlo simulation of non-resonant events.
The and distributions for events with GeV/ are shown in Fig. 3. The inelastic and coherent contributions are successfully removed with GeV/.
Let be the square of the total center-of-mass energy of the system obtained with the MMSA. The effective photon energy is then defined by
| (6) |
Note there is a one-to-one relation between and . The becomes close to when the magnitude of the Fermi momentum is small. For the events with a small , all of , , and have a small value close to a threshold. Since we do not identify the nucleon in the final state, events and events from protons and neutrons may contribute in the small region in this case. Events with a large value are also problematic because they are dominated by coherent events and events with particle misidentifications. Therefore, in addition to the condition GeV/, events are required to satisfy the condition 2.0 GeV 2.5 GeV for further analysis. The value for 2.0 GeV is 2.15 GeV. Thus, the maxmimum is 1.65 GeV/ at the cut boundary. Events with 2.5 GeV have large Fermi momentum for which the MMSA is not a good approximation. The number of events with 2.5 GeV is small (658 events) compared to 14928 events with 2.0 GeV 2.5 GeV. For the LH2 runs, we require events to satisfy 2.0 GeV 2.4 GeV and 0.9 GeV/ 0.98 GeV/. A total of 6306 events have passed the requirements.
In principle, should be replaced by in the case of the system. However, the difference between values calculated with and is less than 1 MeV. Therefore, we use the mean of and for the calculation of .
The distributions for events with 2.0 GeV 2.5 GeV are shown in Fig. 4. Both the coherent and inelastic events are strongly suppressed, and the main peak due to quasi-free processes is well reproduced by a Monte-Carlo simulation for non-resonant reactions using a realistic deuteron wave function Lacombe . The non-uniform structure in the higher tail of the distribution for the Monte-Carlo events is caused by the special treatment of setting when becomes smaller than due to the finite resolutions.
In the Monte-Carlo study, the mass of a struck nucleon has been set to be off-shell so that the total energy of two nucleons in the center-of-mass system is equal to . The mass of a spectator nucleon is always set to be on-shell.
V RANDOMIZED MINIMUM MOMENTUM METHOD
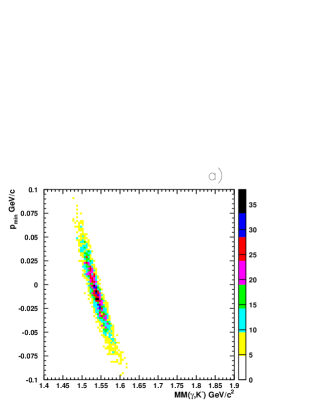
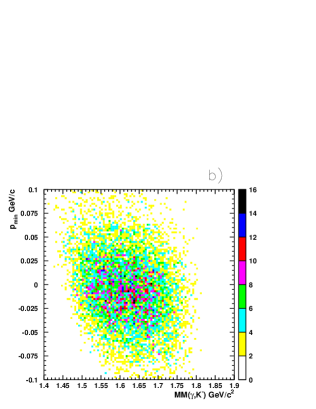
In this section, we develop a method to estimate the reasonable spectrum shape for background contributions by using only measured and values. There is a strong correlation between and for the signal Monte-Carlo events, while the correlation is very weak for non-resonant background events as shown in Fig. 5. The nature of background events is characterized by the absence of this correlation. Because of a background event has a random nature due to the Fermi motion, a reconstructed can be replaced by a computer-generated one without changing the shape of a distribution for background events.
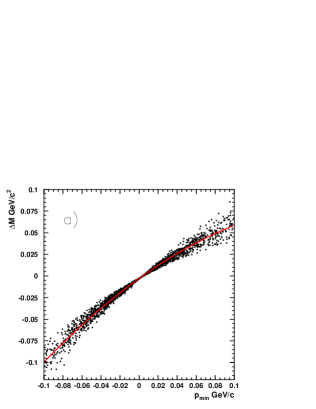
The first step of the randomized minimum momentum method (RMM) is to approximate the mass correction ( by a 2nd order polynomial function of () as shown in Fig. 6(a). The quality of this approximation is quite accurate, and the standard deviation of is 4-5 MeV/ in the whole mass range. Fig. 6(b) shows the and distributions for the signal Monte-Carlo events. It demonstrates that the mass correction is predominantly determined by , and other effects such as the directions of and are small. The practical advantage of this simplified mass calculation is separation of input arguments for the mass function into two types: one which depends on only and , and the other which also depends on . The original with the MMSA is a complicated function of , , and . In the RMM, it is approximated by a function of and .
In the next step, the most probable spectrum shape for a given distribution is estimated by combining each value with randomized values for many times ( times in this analysis). In the generation, the distribution is assumed to have a Gaussian shape. Because there is a weak correlation between and near the tails of the distribution, the mean of the Gaussian distribution must be varied as a function of . This correlation is mainly caused by the difference between the kinematic domains of and ; the former can have a value below , but the latter cannot. For the same reason, the standard deviation () of the distribution must be varied near the mass threshold. The magnitudes of changes in the mean and are small compared to a typical value of 40 MeV/. Fig. 6(c) shows the mean and curves as functions of . The same functions are used for the estimation of the spectrum shape from .
The RMM is similar to the mixed event technique which is widely used for estimations of combinatoric background. Both methods require the independence of uncorrelated variables, and a common problem is signal contamination. In the case of the RMM, the signal contamination causes enhancement of the background level in the region of interest.
The final step of the RMM is to divide the real data events which are used for the seeds of the event generation into several sub sets. We call them seed sets. In the current analysis, events are sorted according to the value of or which is most sensitive to the signal-to-noise ratio. The boundary for one of the seed sets is chosen to cover a signal region or more precisely a possible signal region. The events of the seed set for the signal region would contain both signal events and background events. A good feature of the RMM is that the shape of the mass distribution generated with the signal events is very close to the shape of the mass distribution generated with the background events in the same seed set. Fig. 7(a) shows the RMM spectra generated with the MC events and with the non-resonant MC events both in the region of 1.50 GeV/ 1.55 GeV/. The difference in the spectrum shape is small.
In the shape analysis in the following sections, the background spectrum is represented as a sum of several RMM spectra. If one of the seed sets is contaminated by signal events, the effect can be absorbed by reduction of the weight parameter in the summation of the RMM spectra. By using several RMM spectra for the shape analysis, some of the global inconsistencies caused by fluctuations in the seed distributions and incomplete treatment of the correlation between and can also be compensated by small changes of the weight parameters.
The significance of a signal contribution is calculated from the difference in log likelihood between fits with and without the signal contribution represented by a Gaussian function. Since the width is fixed to the value estimated by a Monte-Carlo simulation, the change in the number of the degrees of freedom is 2, which is taken into account for the significance calculation.
The distribution for events selected with requirements of 1.01 GeV/1.03 GeV/ and 2.0 GeV 2.5 GeV is shown in Fig. 7(b). A fit to a spectrum generated with the RMM using all selected events with an equal weight is indicated by the dashed line. The solid line shows the fit results with three RMM spectra, for which the selected events are divided into the three seed sets according to the conditions: 1.5 GeV/, 1.5 GeV/ 1.6 GeV/, or 1.6 GeV/. The log likelihood (-2ln for the single RMM spectrum fit is 65.5 for the number of the degrees of freedom () equal to 51. It becomes to 50.4 for the fit with three RMM spectra for . Since the spread of a RMM spectrum from the seed set of 1 MeV/ width is larger than 30 MeV/, further increasing the segmentation for the seed sets does not improve the -2ln value more than .
The distribution for the sum of 3000 non-resonant MC events and 300 MC events is fitted to a mass distribution consisting of three RMM distributions with seed regions of (I) 1.50 GeV/ , (II) 1.50 GeV/ 1.55 GeV/, and (III) 1.55 GeV/. The best fit, which is indicated by a solid curve in Fig. 7(c), is obtained with the weight parameters of 0.651, 1.245, and 0.949 for the contrbutions from region (I), (II), and (III), respectively. The -2ln value for the fit is 114.6 for = 61. The -2ln value is improved to 58.4 for = 59 by including a Gaussian function with a fixed width of 11 MeV/c2 to represent the contribution as shown in Fig. 7(d). The statistical significance of the peak is calculated to be 7.2 for (-2ln)/ = 56.2/2. The weight parameters become 1.14, 0.648, and 0.993 for the contrbutions from region (I), (II), and (III), respectively. The sum of the RMM spectra with the fitted weight parameters, which is indicated by a dotted curve in Fig. 7(d), reproduces well the original mass distribution (open circles) for the non-resonant MC events. The signal yield estimated from the fit is 279 36 events, which is consistent with the number of MC events of 300.
VI ANALYSIS OF THE REACTION
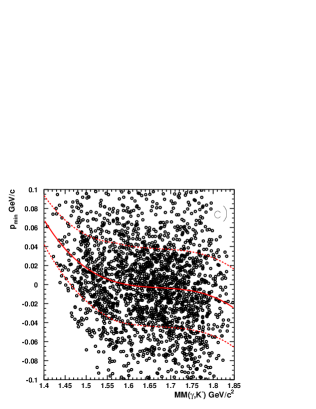
The dominant contribution in the selected events is due to decays, which are rejected by the combined requirements of GeV/ and - 2.0). The cut boundary is shown as solid lines in Fig. 8(a). The energy dependent cut condition makes the signal acceptance more uniform than the constant cut condition as shown in Fig. 8(b). The distributions for non-resonant MC events before and after the exclusion cut are shown in Fig. 8(c). The exclusion cut distorts the mass spectrum because the acceptance is high near the threshold where the momenta of the and are highly asymmetric. However, the mass dependence of the acceptance is not strong, and consequently the cut does not create a narrow peak. Note that the mass spectrum near the threshold is not affected by the exclusion cut. This is because the momenta of two kaons for events in the threshold region are highly asymmetric, which results in a high mass.
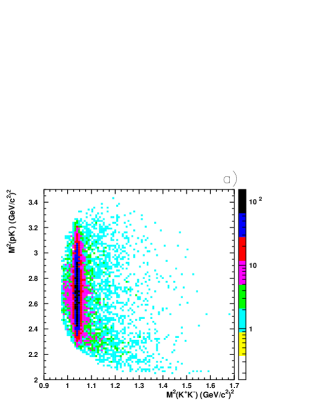
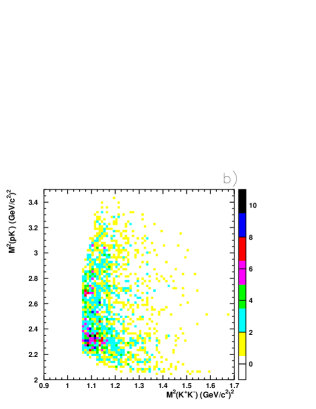
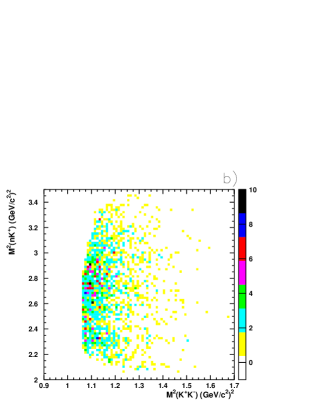
A total of 2078 events passed the exclusion cut, and the MMSA is applied to obtain by assuming the spectator is a neutron. The Dalitz plots ( vs. before and after the exclusion cut are shown in Fig. 9. The (1520) yield at GeV/ is higher in the lower region due to the LEPS detector acceptance. However, the events are not concentrated near the cut boundary.
Fig. 10(a) shows the distribution. For the shape analysis, three RMM spectra are generated by setting the seed boundaries at 1.48 GeV/ and 1.56 GeV/ in . A fit to the RMM spectra gives a -2ln value of 110.2 for =58. The -2ln value is improved to 55.1 by including a Gaussian function with a fixed width of 16 MeV/c2 as the (1520) contribution. The (-2ln of 55.1 for =2 corresponds to a statistical significance of 7.1. The signal yield is determined to be 28938 events from the fit. The fit result with the (1520) contribution is represented by the solid curve. The dotted line is the sum of the RMM spectra, which represents the background. The dashed line shows a fitting result without the (1520) contribution.
The data points of the and distributions for the LH2 runs are shown in Fig. 10(b) as closed circles and open circles, respectively. The (1520) peak becomes narrow because of no Fermi motion effect. No significant peak structure is observed in the distribution. The mass distribution in the region of 1.47 GeV/ 1.65 GeV/ is fitted to a second-order polynomial. The result gives -2ln=32.3 for =27. An excess of the yield over the yield is seen near the mass threshold. The excess of the yield in the high mass regions is due to the reflections of the (1520) events. The distribution is fitted to a Gaussian function plus a second-order polynomial, and the (1520) yield is estimated to be 14317 from the fit. The LD2/LH2 ratio of the (1520) yield is 2.020.36. This is consistent with the estimated ratio of 1.93 from the integrated numbers of incident photons and the target proton densities.
VII ANALYSIS OF THE REACTION
For the analysis of the reaction, events with a 3rd charged track in addition to and tracks are removed. This condition changes the total number of events from 2078 to 1967. Most of the removed events are due to reactions with a neutron as a spectator, for which the LEPS detector has a finite acceptance to detect all the charged particles in the final state.
Dalitz plots of vs. before and after the exclusion cut are shown in Fig. 11. No concentration of events near the cut boundary is seen. The distribution for the final candidate events is shown in Fig. 12(a). There is a narrow peak structure near 1.52-1.53 GeV/. The distribution is fitted to a mass distribution consisting of three RMM distributions with seed regions of 1.50 GeV/ , 1.50 GeV/ 1.55 GeV/, and 1.55 GeV/. The -2ln value of the fit changes from 104.7 (for =66) to 73.64 (for =64) by including a Gaussian function with the estimated width of 11 MeV/ to represent the signals. The statistical significance of the signal estimated from (-2ln) is 5.2. The peak position for the best fit is GeV/, where the systematic shift of the peak position by +3 MeV/ due to the MMSA and the exclusion cut is given as a systematic uncertainty. The signal yield is estimated to be 116 21 events from the fitted peak height and its uncertainty. The detector acceptance has been calculated by assuming the isotropic production of the in the center-of-mass system, and the differential cross-section for the reaction is estimated to be nb/sr in the LEPS angular range.
There is a dip near 1.56 GeV/ even with the contribution. However, with the current limited statistics, it is not clear if the dip is due to fluctuations or due to some interference effects. Since we assume the branching ratio B()=0.5 in the calculation of the differential cross-section, possible interference effects between the signal and background amplitudes could result in a change of the estimated value.
A fit of the distribution to the mass distribution using a Gaussian function with a free width parameter has been carried out, and the best fit is obtained with a width of 12.7 2.8 MeV/, which is consistent with the estimated width of 11 MeV/.
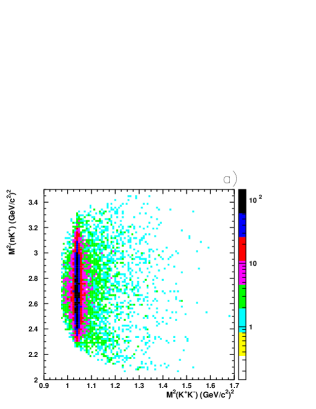
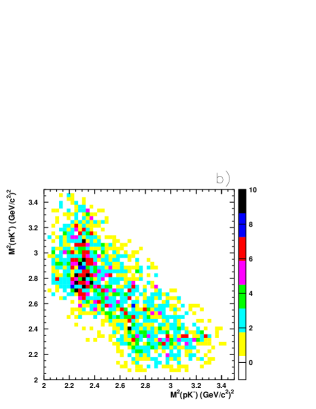
Fig. 12(b) shows the Dalitz plot of vs. . Note a proton is assumed to be a spectator for the calculation of and a neutron is assumed to be a spectator for the calculation of . The relatively large -2ln values for the fits of the distribution could be due to the reflections of the (1520) events which might be responsible for the remaining structure near 1.65 GeV/. To avoid a possible effect due to the reflection, we require events to satisfy 1.55 GeV/ and restrict the fit region up to 1.65 GeV/. The fit qualities are improved, giving -2ln/=55.2/33 and -2ln/=24.8/31 for the cases with and without the contribution, respectively. The significance is unchanged because the change in (-2ln) is small. Fig. 13(a) shows the distribution after the exclusion cut.
To study the model dependence, we have varied the boundaries of the seed regions for the RMM spectrum generation: the narrow signal region case with the boundaries at 1.51 GeV/ and 1.54 GeV/, and the wide signal region case with the boundaries at 1.48 GeV/ and 1.57 GeV/. The fit results are essentially unchanged, giving a statistical significance of 5.2 for the narrow signal region case, and a significance of 5.1 for the wide signal region case. Although the shape and magnitude of each RMM spectrum vary case by case, the resultant summed background spectrum for the best fit is similar to each other as shown in Fig. 13(b). Fine structures in the original distribution compared to a typical mass spread of 30 MeV/ due to Fermi motion are smoothed by using the RMM. The weak dependence of the fit results on the seed boundary condition is a consequence of the smooth nature of the uncorrelated background. The maximum difference in the fitted peak height with the various background models is approximately 5 , which is much smaller than the fitting uncertainty of 18 , and, therefore, neglected.
We have also examined a fit to the mass distribution using a second-order polynomial to represent the background. Note the number of the fitting parameters for the fit is the same as the fit with three RMM background spectra. Fig. 14 shows the comparison of the fit results for the cases with the fitting regions of 1.43 GeV/ 1.65 GeV/ and 1.47 GeV/c1.65 GeV/c2. Fit quality is always better with the RMM than with the polynomial background function. By using the polynomial background function, the -2ln/ndf values for the wide fitting region are obtained to be 65.1/33 and 28.1/31 without and with the contribution, respectively. The (-2ln of 37.0 corresponds to a 5.7 significance. For the narrow fitting region case, the -2ln/ndf values for the fits without and with the contribution are 58.4/27 and 23.1/25, resulting in a 5.6 significance. For the same fitting region, the -2ln/ndf values using the RMM are 51.2/27 and 21.2/25, giving a significance of 5.1 . Thus, the statistical significances estimated from the fit results with RMM are smaller than those with the polynomial functions. The difference is caused by poor modeling of a background shape with the polynomial functions, especially without the contribution. The fit results with the various background models are summarized in Table 1. The smallest significance of 5.1 is considered as the significance with the systematics taken into account.
| Background model | cont. | Fit region | -2ln/ | -2ln/ | Significance |
|---|---|---|---|---|---|
| (GeV/) | without | with | |||
| RMM spectra, default seed sets. | not excluded | [1.43,1.85] | 104.7/66 | 73.64/64 | 5.2 |
| RMM spectra, default seed sets. | excluded | 55.2/33 | 24.8/31 | 5.2 | |
| RMM spectra, wide signal region. | excluded | 54.5/33 | 24.3/31 | 5.1 | |
| RMM spectra, narrow signal region. | excluded | 55.9/33 | 24.8/31 | 5.2 | |
| RMM spectra, default seed sets. | excluded | 51.2/27 | 21.2/25 | 5.1 | |
| 2nd-order polynomial. | excluded | 65.1/33 | 28.1/31 | 5.7 | |
| 2nd-order polynomial. | excluded | 58.4/27 | 23.1/25 | 5.6 |
The validity of the statistical significance estimated from the (-2ln value is checked with sample mass distributions generated by a toy Monte-Carlo simulation program by assuming a spectrum shape for the non-resonant events. The generated distributions are fitted to the mass distribution which uses the polynomial background function. The difference of the -2ln values with and without a Gaussian function with the width of 11 MeV/ is checked. The numbers of the samples with a significance of more than 4 and 5 are 10 and 2, respectively. These numbers are consistent with the expected number of occurrences of high-significance samples due to statistical fluctuations.
A background spectrum for and distributions can be obtained by using the RMM in a reversed way, where a measured ( and a randomized are used to simulate (. The missing mass distributions with a fit to the reversed RMM functions are shown in Fig. 15. Both and distributions are well reproduced by the background functions with -2ln/=79.7/67 and 60.2/66, respectively. Since the -2ln values are not reduced by more than by including a Gaussian function with a fixed width of 30 MeV/, the corresponding significances are less than 1. This demonstrates the importance of the narrowness of the width and the consistency between the measured and estimated values for the shape analysis.
A photon energy independent exclusion cut with the condition of 1.05 GeV/ is also tried, and the resultant and distributions are shown in Fig. 16. Both distributions are well fitted to the mass distributions with the RMM and Gaussian functions with -2ln/ ratios of less than 1. The peak positions have not been changed, and the signal yields for the and (1520) are reduced by a factor of 25% and 35%, respectively, compared to those obtained by the original exclusion cut.
Events with a 3rd charged track are examined to check if the narrow peak in the distribution is due to quasi-free reactions with a spectator proton. The ratio of the number of events with a 3rd track to the total number of events is 2.90.9 % in the mass region of 1.50 GeV/ 1.55 GeV/, while it is 8.81.2% in the mass region of 1.50 GeV/ 1.55 GeV/, where the (1520) events dominate. The 3rd track ratios in the adjacent regions of 1.55 GeV/ 1.60 GeV/ and 1.55 GeV/ 1.60 GeV/ are 7.21.6 % and 6.41.4 %, respectively. A fit to the distribution for events without the 3rd track exclusion shows that the peak height varies only by +0.9 %, while the background level increases by +4.6%. The (1520) peak height decreases by 8.9 % by removing events with a 3rd track. These observations indicate the peak is likely due to quasi-free reactions.
In our previous paper, the statistical significance has been estimated from the ratio of , where and are the numbers of the signal and background events, respectively LEPS . The toy Monte-Carlo study has shown this method results in large overestimation of the significance. The magnitude of the overestimation is still large when using instead of . In the current analysis, the value in the mass region of 1.50 GeV/ 1.55 GeV/ is 6.9, which is larger than the significance estimated from the (-2ln) by approximately 2. The ratio of the peak height to its fitting uncertainty gives a significance of 5.4 which is slightly (5%) higher than that estimated from (-2ln).
VIII CONCLUSIONS AND DISCUSSIONS
We have observed a narrow peak near 1.53 GeV/c2 in the invariant mass distribution from quasi-free reactions. The Fermi-motion corrected mass distribution is obtained by using the newly developed minimum momentum spectator approximation (MMSA). The validity of the MMSA is checked by analyzing the quasi-free reactions. The effect of the Fermi-motion on the nK+ invariant mass is studied by using the randomized minimum momentum method (RMM), and it has been shown a narrow peak with a width much less than 30 MeV/ cannot be generated by corrections nor selection cuts. The statistical significance of the peak has been estimated by a spectrum shape analysis using the RMM background functions as well as polynomial functions. The statistical significance from the shape analysis is 5.1 .
The yield is estimated to be events in the events. The differential cross-section is estimated to be nb/sr in the LEPS angular range by assuming the isotropic production of the in the center-of-mass system.
The ratio of is consistent with that of obtained by the previous measurement although the detector acceptance is smaller in the current experiment due to a longer distance from the target to the spectrometer LEPS . However, the significance of the contributions in the previous study is highly overestimated because it was calculated from the ratio.
The yield ratio of the to the (1520) is 0.400.09. By considering the partial decay branching ratios of and the acceptance difference, the production ratio of the to the (1520) is estimated to be 0.150.03 in our detector acceptance.
The upper limit on the production cross-section obtained by the CLAS collaboration is 3 nb McKinnon2006 . However, due to the different nature of the measurements at CLAS and LEPS, the CLAS upper limit is very difficult to compare with the present results, since the re-scattering mechanism of the spectator proton (required by CLAS) is unknown and the detector acceptances are almost exclusive. Hence we see no conflict between the present results and those published by CLAS.
The LEPS collaboration will analyze new data which were collected with the same detector setup and an improved luminosity (by a factor of 3). Detailed investigation of the angular and energy dependencies of the photo-production will become possible if the peak is confirmed in the new data set.
IX ACKNOWLEDGEMENT
We thank the staff at SPring-8 for providing a stable beam and excellent experimental conditions. We thank Dr. A. Hosaka and Dr. A. I. Titov for helpful discussions. This research was supported in part by the Ministry of Education, Science, Sports and Culture of Japan, by the National Science Council of the Republic of China (Taiwan), by the National Science Foundation (USA), and by the Korea Research Foundation (Korea).

|

|

|

|

|

|

|

|

|

|
|
|
|

|
|

|

|

|

|
|

|

|
|
|

|

|
|
|

|
|

|

|

|

|

|

|

|

|

|

|
References
- (1) T. Nakano et al., Phys. Rev. Lett. 91, 012002 (2003).
- (2) D. Diakonov, V. Petrov, M. Polyakov, Z. Phys. A 359, 305 (1997).
- (3) V.V. Barmin et al., Phys. Atom. Nucl. 66, 1715 (2003).
- (4) S. Stepanyan et al., Phys. Rev. Lett. 91, 252001 (2003).
- (5) J. Barth et al., Phys. Lett. B 572, 127 (2003).
- (6) V. Kubarovsky et al., Phys. Rev. Lett. 92, 032001 (2004).
- (7) A. E. Asratayn, A.G. Dolgolenko and M.A. Kubantsev, Phys. Atom. Nucl. 67, 682 (2004).
- (8) A. Airapetian et al., Phys. Lett. B 585, 213 (2004).
- (9) S. Chekanov et al., Phys. Lett. B 591, 7 (2004).
- (10) M. Abdel-Bary et al., Phys. Lett. B 595, 127 (2004).
- (11) A. Aleev et al., Phys. At. Nucl. 68, 974 (2005).
- (12) M.J. Longo et al., Phys. Rev. D70, 111101(R) (2004).
- (13) I. Abt et al., Phys. Rev. Lett. 93, 212003 (2004).
- (14) S. Schael et al., Phys. Lett. B 599, 1 (2004).
- (15) J.Z. Bai et al., Phys. Rev. D 70, 012004 (2004).
- (16) B. Aubert et al., hep-ex/0502004.
- (17) D.O. Litvintsev et al., Nucl. Phys. B (Proc. Suppl.) 142, 374 (2005).
- (18) Yu.M. Antipov et al., Eur. Phys. J. A21, 455 (2004).
- (19) A. I. Titov, A. Hosaka, S. Dat’e, and Y. Ohashi, Phys. Rev. C 70, 042202(R) (2004).
- (20) R. De Vita et al., Phys. Rev. D 74, 032001 (2006).
- (21) Y. I. Azimov, V. Kuznetsov, M. V. Polyakov and I. Strakovsky, Phys. Rev. D 75, 054014 (2007).
- (22) S. I. Nam, A. Hosaka and H. C. Kim, Phys. Lett. B 633, 483 (2006).
- (23) B. McKinnon et al., Phys. Rev. Lett. 96, 212001 (2006).
- (24) K. Miwa et al., Phys. Lett. B 635, 72 (2006).
- (25) K. Miwa et al., Phys. Rev. C 77, 045203 (2008).
- (26) M. Abdel-Bary et al., Phys. Lett. B 649, 252 (2007).
- (27) V. V. Barmin et al., Phys. Atom. Nucl. 70, 35 (2007).
- (28) K. Abe et al., Phys. Lett. B 632, 173 (2006).
- (29) M. Sumihama et al., Phys. Rev. C 73, 035214 (2006).
- (30) W. C. Chang et al., Phys. Lett. B 658, 209 (2008).
- (31) M. Lacombe et al., Phys. Lett. B 101, 139 (1981).