Exploring the powering source of the TeV X-ray binary LS 5039
Abstract:
LS 5039 is one of the four TeV emitting X-ray binaries detected up to now. The powering source of its multi-wavelength emission can be accretion in a microquasar scenario or wind interaction in a young non-accreting pulsar scenario. These two scenarios predict different morphologic and peak position changes along the orbital cycle of 3.9 days, which can be tested at milliarcsecond scales using VLBI techniques. Here we present a campaign of 5 GHz VLBA observations conducted in June 2000 (2 runs five days apart). The results show a core component with a constant flux density, and a fast change in the morphology and the position angle of the elongated extended emission, but maintaining a stable flux density. These results are difficult to fit comfortably within a microquasar scenario, whereas they appear to be compatible with the predicted behavior for a non-accreting pulsar.
1 Introduction
Very High Energy (VHE) gamma-ray emission in the TeV range has been detected in four massive X-ray binaries. PSR 125963 contains a young non-accreting millisecond (ms) radio pulsar [1]. The accreting/ejecting microquasar Cygnus X-1 has recently been found to be a TeV emitter [2]. LS I +61 303 [3], suggested to be a fast precessing microquasar [13], displays a changing milliarcsecond (mas) radio morphology that Dhawan et al. [8] interpreted in the context of the interaction between the wind of the companion and the relativistic wind of a young non-accreting ms pulsar [9]. Finally, the nature of the powering source in LS 5039, whether accretion or rotation, is unknown.
2 The binary system LS 5039
| Symbol | Parameter | value | |
|---|---|---|---|
| Orbital period, [days] | |||
| Periastron passage, HJD2400000 | |||
| Eccentricity | |||
| Argument of periastron, [∘] | |||
| Systemic radial velocity, [km s-1] | |||
| Velocity semi-amplitude [km s-1] | |||
| Projected semi-major axis, [] | |||
| Mass function, [] | |||
| Projected rotational velocity, [km s-1] | |||
| System distance, [kpc] | |||
| Compact object mass, [] | –– | ||
| Stellar mass, [] | |||
| Stellar radius, [] | |||
| Stellar luminosity, [erg s-1] | |||
| Stellar mass loss rate, [ yr-1] | 7 |
The optical star LS 5039 is a main-sequence young star with a luminosity , and an effective temperature of K. The visual magnitude of the star is . Approximate values of the radius and mass are and . The complete spectral type of the star is ON6.5 V((f)). The orbital parameters of the system obtained from the spectroscopic observations in [6] are summarized in Table 1. The mass of the compact object depends on the inclination of the orbit, which can be between 11 and 75∘, and is in the range 1.5–8 . The compact object can thus be a black hole or a neutron star. Based on the mass function and inclination, the probability of being a black hole is %. The rotational velocity of the optical star sets the lower limit of the inclination, and the absence of X-ray eclipses sets the upper limit, assuming that the emission is produced in the vicinity of the compact object. This upper limit can be higher if the emission takes place far away from the compact object. In this slightly eccentric system, the objects are separated 0.1 AU at periastron and 0.2 AU at apastron. In case the optical companion is pseudo-synchronized, i.e. its rotational and orbital angular velocities are synchronized at the periastron, the compact object mass would be in the range 3.14–4.35 (corresponding to an inclination of ), and therefore it would be a black hole. For a system like LS 5039, the synchronization timescale is Myr after the supernova explosion.
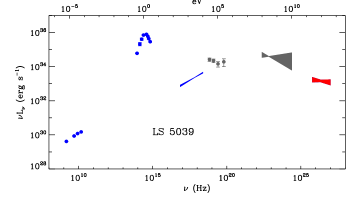
The broadband emission of LS 5039 is shown in Fig. 1. The output is dominated by the emission above 1 MeV, allowing us to consider the system as a gamma-ray binary. In this work we are interested in studying the behavior of the radio emission at mas scales.
3 Possible scenarios
The HE/VHE emission of gamma-ray binaries is basically interpreted as the result of inverse Compton upscattering of stellar UV photons by relativistic electrons. Two excluding scenarios have been proposed to explain the acceleration mechanism that powers the relativistic electrons. In the first one electrons are accelerated in the jets of a microquasar powered by accretion. In the second one they are accelerated in the shock between the relativistic wind of a non-accreting pulsar and the wind of the stellar companion.
Microquasars are X-ray binary systems containing a black hole or a neutron star and a companion star, from which material is accreted by the compact object. They display bipolar relativistic collimated plasma jets. The electrons in the jets produce synchrotron radiation when they interact with the magnetic fields present in the jet. In this scenario the VHE emission is produced by inverse Compton scattering when the jet particles collide with stellar UV photons. Some models also take into account hadronic processes, in which accelerated protons collide with stellar wind ions. For detailed models of the broadband emission from microquasars see [5], [18], and [22].
In the non-accreting pulsar scenario the relativistic wind of a young millisecond pulsar collides with the stellar wind of the bright companion. The region where the wind pressures are balanced defines the standoff distance, which is close to the compact object. The high energy emission is produced in this region, while a nebula of accelareted particles forms behind the pulsar. The cooling processes of these accelarated particles along the adiabatically expanding flow produces the non-thermal broadband emission. The morphology is similar to the one expected in isolated pulsars moving through the ISM. Information on this scenario can be found in [11], [9], and [23].
4 Testing at mas scales
The expected behavior of the radio emission at mas scales is different in each scenario, allowing us to test the scenarios by means of high resolution radio images. In the microquasar scenario we have a central core with extended jet-like radio emission. The projection effects and the Doppler boosting of the relativistic jets produce a flux and distance asymmetry that can be measured [14], [10]. The extended emission can be one sided for highly relativistic jets or if the direction of the flow is near the line of sight. The direction of the jets should remain constant during an orbital cycle, although it can display long-term precession. The dense stellar wind of the bright companion can interact with the relativistic jets, producing the bending and disruption of the jets [19].
In the non-accreting pulsar scenario the shocked material is contained by the stellar wind behind the pulsar, producing a ’bow’ shaped nebula extending away from the stellar companion. As a consequence of this, the tail of the flow at a few AU follows an elliptical path during the orbital cycle, while at larger scales we see the accumulated contribution of electrons accelerated during several orbital cycles. At mas scales, it is expected that the direction of the extended emission changes with the pulsar’s orbital motion. The peak of the radio emission, located at a few AU behind the pulsar, should follow an elliptic orbit 10 times bigger than the size of the orbit of the system (the size depends on the magnetization of the pulsar wind), [9].
5 Previous radio observations
The unresolved radio emission of LS 5039 is persistent, non-thermal, and variable, although no strong radio outburst or periodic variability have been detected so far [20, 7]. A multi-wavelength study between 1.4 GHz and 15 GHz using the VLA in its A configuration was performed in Martí et al. [12], always showing an unresolved point-like source (). The source spectral index resulted to be , very suggestive of non-thermal radio emission. No radio pulses have been detected at 1.4 GHz [15]. The system might still contain a pulsar, but in this case free-free absorption with the stellar wind would prevent us to detect the pulsations. New observations at higher frequencies may be required to search for pulsations.
The discovery of the radio structure of the source was presented in Paredes et al. [16], where observations at 5 GHz were performed using the VLBA and the VLA in its phased array mode. The observation took place on May 8, 1999, which correspond to orbital phases in the range 0.12–0.15, when computed with the ephemeris from [6]. The final synthesis map (see Fig. 2) shows two-sided extended emission emerging from a central core. The deconvolved angular size of the core is 2 mas, and it accounts for the 80% of the total flux density recovered, which is 16 mJy. The extended emission is aligned towards a direction with Position Angle (PA) , measured from north to east. The source extends over 6 mas on the plane of the sky. Three main components can be fitted by the following model: a central core of 12.8 mJy, a south-east component located at an angular distance of mas from the core and with a flux density of mJy, and a north-west component located at mas from the core and with a flux density of mJy. We can see in Fig. 2 that the core is not point-like and seems to be resolved or to present some extended structure. However, this emission is too faint to analyze it in the model fit.
Simultaneous observations at 5 GHz using the EVN and MERLIN were reported in Paredes et al. [17]. The orbital phase of the system was in the range 0.35–0.39 during the observations. The images show bipolar extended emission emanating from a central core, like the VLBA maps. In both images the south-east emission is brighter and larger than the north-west one. The extended emission was detected up to 35 mas (100 AU) and 175 mas (400 AU) in PA of 140∘ and 150∘ respectively, which suggest that the extended emission could be bent.

6 VLBA observations in June 2000
We observed LS 5039 with the Very Long Baseline Array (VLBA) and the Very Large Array (VLA), of the National Radio Astronomy Observatory (NRAO), at 5 GHz frequency on 2000 June 3 and 8. The project codes for these Global VLBI observations are GR021A and GR021B, respectively. The VLA data was correlated twice: first as a connected interferometer, which provides low resolution images to obtain detailed flux density information, and secondly in its phased array observing mode, serving as an additional single antenna for VLBI.
The two observing sessions, hereafter run A and run B, spanned from 4:30 to 12:30 UT on the corresponding dates, and were thus centered on MJD 51698.4 and MJD 51703.4, respectively. The two runs, performed 5 days apart, took place in consecutive orbital cycles. The orbital phases of the system were in the range 0.43–0.51 for run A and in the range 0.71–0.79 of the following orbital cycle for run B. During run A, the compact object was arriving to the apastron, whereas during run B it was located after the inferior conjunction.
The observations were performed switching between the target source LS 5039 and the phase reference calibrator J18251718, with cycling times of 5.5 minutes. The 3.5 Jy ICRF source J19112006, located at 11.9∘ from LS 5039, was observed every 22 minutes in order to monitor the performance of the observations. The position used hereafter for the phase reference source J18251718, obtained by means of dedicated geodetic VLBI observations, is ( mas) and ( mas). This position was provided by observations from the joint NASA/USNO/NRAO geodetic/astrometric program. The coordinates are in the frame of ICRF-Ext.1. However, this information was not available at the time of correlation, which was performed for a calibrator position shifted by mas and mas. In the case of LS 5039, due to its proper motion, the source was found to be mas and mas away from the correlated position.
The post-correlation data reduction was performed using the Astronomical Image Processing System (aips) software package, developed and maintained by NRAO. Corrections of 0.1 mm were applied to the positions of some of the VLBA antennas, although the VLA position had to be corrected by 0.43 m, according to later geodetic measurements. The positions of J18251718 and LS 5039 were corrected using the task clcor. As recommended for phase-referencing experiments, we applied ionospheric and Earth Orientation Parameters corrections to the visibility data using the task clcor. A priori visibility amplitude calibration was done using the antenna gains and the system temperatures measured at each station. The fringe finder was then used to calibrate the instrumental phase and delay offsets between the different intermediate frequency (IF) channels. The fringe fitting (fring) of the residual delays and fringe rates was performed for all the sources. Very good solutions were found for tha calibrators J19112006 and J18251718. Fringes for 15 and 25% of the baselines were missing for the target source LS 5039 and for the astrometric check source J18371532, respectively. Typical data inspection and flagging were performed. An independent reduction of the VLA data was performed using standard procedures within aips.
7 Results
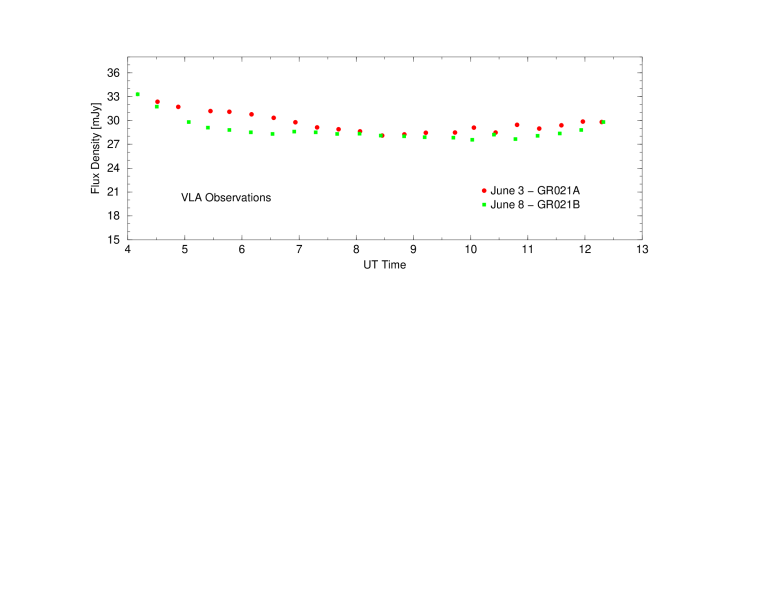
The VLA data correlated as an independent interferometer provided low resolution images and very precise flux density information. The VLA data of LS 5039 were compatible with a point-like source for the obtained synthesized beam of in PA . We measured the flux density of the source every 30 minutes and obtained a mean of 29.4 mJy with a standard deviation of =1.1 mJy during the 8 hours of run A, and 28.4 mJy with =0.7 mJy for run B. The obtained fluxes are plotted in Fig. 3.
We show the final VLBA+phased VLA self-calibrated images in Fig. 4. The image obtained for run A displays a central core and a bipolar and nearly symmetric extended emission with PA , with brightest component towards the south-east. The total flux density recovered by the VLBA, obtained with the task tvstat within aips, is 25 mJy, representing 85% of the VLA one. The peak flux density of the core is 10.5 mJy beam-1. The image is similar to the one obtained with the same array in 1999 May 8, corresponding to orbital phases 0.12–0.15, which showed a slightly more asymmetric extended emission in PA, as can be seen in Fig. 2. In contrast, the image obtained for run B displays a core and a bipolar but clearly asymmetric structure with PA and the brightest component towards the north-west. The total flux density recovered is 24 mJy, or 85% of the VLA one. The peak flux density of the core is 10.5 mJy beam-1, as in run A. To characterize the extended emission we used UVFIT and JMFIT within aips, as well as model fitting tools within Difmap to check the reliability of the obtained results. The preferred model for run A data consisted of 3 Gaussian components to account for the core (Core1), the south-east (SE1), and the north-west (NW1) components. A similar model could fit the data for run B, although the south-east (SE2) component is marginally fitted. The fitted parameters are quoted in Table 2. See also [21].
We splitted the 8 hours of data in each run into 4-hour data sets. For each of them we model fitted the visibilities of the self-calibrated data. Although not all the components were well fitted (NW1 is marginally fitted and SE2 is not detected in the partial images), no significant morphological differences are measured between the two halves in any of the two runs. The peak position of the component SE1 with respect to Core1 is stable in 4 hours within the errors ( mas, mas). For run B the distance between Core2 and NW2 is also stable in 4 hours within the errors ( mas, mas).
There are no reliable astrometric results obtained with the phase-referenced images of current data. The resolution of the images of LS 5039 and the check-source is limited by the scatter broadening of the phase-reference source. Furthermore, the offset of 60.9 mas in the correlated position of J18251819 produces an instrumental drift of the position of the target source of mas during the 8-h runs, in the same direction as the line joining the positions of the source and the phase-reference calibrator (see [21]). Accounting for these errors, the measured position of LS 5039 for run A is (or 0.15 mas), and (or 1.5 mas). For run B the source is splitted in two components during the observation, preventing us to obtain an accurate position of the source.

| Run | Comp. | Peak | PA | ||||||||||
| [mJy beam-1] | [mJy] | [mas] | [∘] | [mas] | [mas] | ||||||||
| A | Core1 | 10.54 | 0.08 | 20.0 | 0.2 | — | — | — | — | ||||
| SE1 | 1.11 | 0.08 | 2.6 | 0.2 | 3.67 | 0.08 | 115.9 | 1.7 | 3.30 | 0.07 | 1.60 | 0.12 | |
| NW1 | 0.88 | 0.08 | 1.5 | 0.2 | 3.29 | 0.09 | 63 | 2 | 2.92 | 0.08 | 1.52 | 0.14 | |
| B | Core2 | 10.45 | 0.11 | 17.6 | 0.3 | — | — | — | — | ||||
| SE2 | 0.75 | 0.11 | 1.8 | 0.4 | 2.8 | 0.2 | 129 | 5 | 2.17 | 0.13 | 1.8 | 0.3 | |
| NW2 | 2.22 | 0.11 | 3.9 | 0.3 | 2.94 | 0.06 | 52.2 | 1.4 | 2.32 | 0.04 | 1.80 | 0.09 | |
8 Discussion
The observations of LS 5039 reported here, obtained with the VLBA on two runs separated by 5 days, show a changing morphology at mas scales. In both runs there is a core component with a constant flux density within errors, and elongated emission with a PA that changes by between both runs. The brightest component in run A is towards south-east, and in run B towards north-west. The source is nearly symmetric in run A and asymmetric in run B (see Fig. 4).
In the microquasar scenario, and assuming ballistic motions of adiabatically expanding plasma clouds without shocks [14], the morphology of run A can be interpreted as a double-sided jet emanating from a central core with the southeast component as the approaching one, whereas in run B the northwest component would be the approaching one. We can compute the projected bulk velocity of the jets from the distance and flux asymmetry. The results, shown in Table 3, are compatible with a mildly relativistic jet with a projected bulk velocity of 0.1c. However, the distances from Core2 to the components NW2 and SE2 are very similar and do not imply any significant relativistic motion.
We can compute, for different angles, the expected displacement of the approaching components with respect to the respective cores in 4 hours using the measured value for the flux asymmetry. The lack of proper motions (see upper limits in Sect. 7) implies that, for the measured flux asymmetries, the SE1 jet should be pointing at , and the NW2 jet at . In this context, jet precession is needed to explain this behavior. If the precession axis is close to the plane of the sky, as in SS 433 [4], the precession cone should have a semi-opening angle to fulfill the limits quoted above. If the precession axis is close to the line of sight, a small precession of a few degrees could explain the images of runs A and B. However, in both cases the PA of the jet should vary considerably, in contrast to the small range covered by all observed values at mas scale, between 115 and 140∘ [16, 17].
| Distance asymmetry | Flux asymmetry | ||||||||
| continuous (k=2) | discrete (k=3) | ||||||||
| run | |||||||||
| A | |||||||||
| B | symmetric | ||||||||
Alternatively, the morphology detected in run B could be the result of a discrete ejection where Core2 is the approaching component and NW2 the receding one, while there is no radio emission at the origin of the ejection. However, large X-ray and radio flux density variations are expected during discrete ejections (see [10] and references therein), while the peak and total radio flux densities of LS 5039 are strikingly constant (see also [20] and [7]) and there is no evidence of an X-ray flare in 11.5 years of RXTE/ASM data. Although not yet explored in detail, the morphology changes can be due to the interaction between the jets and a clumpy or dense stellar wind [19].
In the non-accreting pulsar scenario, the different morphologies we have detected at different orbital phases could be due to the change of the relative positions between the pulsar and the companion star along the orbit (see details in [9]). Observations at different orbital phases have always revealed a very similar PA for the extended emission, which would correspond to an inclination of the orbit as seen nearly edge on (90∘). On the other hand, the absence of X-ray eclipses places an upper limit of in this scenario. Therefore, these two restrictions imply an inclination angle that should be close to the upper limit of 75∘.
In conclusion, a simple and shockless microquasar scenario cannot easily explain the observed changes in morphology. On the other hand, an interpretation within the young non-accreting pulsar scenario requires the inclination of the binary system to be very close to the upper limit imposed by the absence of X-ray eclipses. Precise phase-referenced VLBI observations covering a whole orbital cycle are necessary to trace possible periodic displacements of the peak position, expected in this last scenario, and to obtain morphological information along the orbit. These will ultimately reveal the nature of the powering source in this gamma-ray binary.
Acknowledgments.
The NRAO is a facility of the National Science Foundation operated under cooperative agreement by Associated Universities, Inc. J.M., M.R., J.M.P., and J.M. acknowledge support by DGI of the Spanish Ministerio de Educación y Ciencia (MEC) under grants AYA2007-68034-C03-01 and AYA2007-68034-C03-02 and FEDER funds. J.M. was supported by MEC under fellowship BES-2008-004564. M.R. acknowledges financial support from MEC and European Social Funds through a Ramón y Cajal fellowship. J.M. is also supported by Plan Andaluz de Investigación of Junta de Andalucía as research group FQM322.References
- [1] Aharonian, F., Akhperjanian, A. G., Aye, K.-M., et al. 2005, A&A, 442, 1
- [2] Albert, J., Aliu, E., Anderhub, H., et al. 2007, ApJ, 665, L51
- [3] Albert, J., Aliu, E., Anderhub, H., et al. 2006, Science, 312, 1771
- [4] Blundell, K. M., & Bowler, M. G. 2004, ApJ, 616, L159
- [5] Bosch-Ramon, V., Romero, G. E., & Paredes, J. M. 2006, A&A, 447, 263
- [6] Casares, J., Ribó, M., Ribas, I., et al. 2005, MNRAS, 364, 899
- [7] Clark, J. S., Reig, P., Goodwin, S. P., et al. 2001, A&A, 376, 476
- [8] Dhawan, V., Mioduszewski, A., & Rupen, M. 2006, PoS, Proceedings of the VI Microquasar Workshop: Microquasars and Beyond, ed. T. Belloni, p.52.1 \posPoS(MQW6)052
- [9] Dubus, G. 2006, A&A, 456, 801
- [10] Fender, R. P. 2006, Compact Stellar X-Ray Sources, ed. W. H. G. Lewin & M. van der Klis (Cambridge University Press)
- [11] Maraschi, L., & Treves, A. 1981, MNRAS, 194, 1P
- [12] Martí, J., Paredes, J. M., & Ribó, M. 1998, A&A, 338, L71
- [13] Massi, M., Ribó, M., Paredes, J. M., et al. 2004, A&A, 414, L1
- [14] Mirabel, I. F., & Rodríguez, L. F. 1999, ARA&A, 37, 409
- [15] Morris, D. J., Hobbs, G., Lyne, A. G., et al. 2002, MNRAS, 335, 275
- [16] Paredes, J. M., Martí, J., Ribó, M., & Massi, M. 2000, Science, 288, 2340
- [17] Paredes, J. M., Ribó, M., Ros, E., Martí, J., & Massi, M. 2002, A&A, 393, L99
- [18] Paredes, J. M., Bosch-Ramon, V., & Romero, G. E. 2006, A&A, 451, 259
- [19] Perucho, M., & Bosch-Ramon, V. 2008, A&A, 482, 917
- [20] Ribó, M., Reig, P., Martí, J., & Paredes, J. M. 1999, A&A, 347, 518
- [21] Ribó, M., Paredes, J. M., Moldón, J., Martí, J., & Massi, M. 2008, A&A, 481, 17
- [22] Romero, G. E., Torres, D. F., Kaufman Bernadó, M. M., & Mirabel, I. F. 2003, A&A, 410, L1
- [23] Sierpowska-Bartosik, A., & Torres, D. F. 2007, ApJ, 671, L145