In search of progenitors for supernova-less GRBs 060505 and 060614: re-examination of their afterglows ††thanks: Based on observations collected at the European Organisation for Astronomical Research in the Southern Hemisphere, Chile, under programs 077.D-0661 and 177.A-0591.
Abstract
GRB 060505 and GRB 060614 are nearby long-duration gamma-ray bursts (LGRBs) without accompanying supernovae (SNe) down to very strict limits. They thereby challenge the conventional LGRB-SN connection and naturally give rise to the question: are there other peculiar features in their afterglows which would help shed light on their progenitors? To answer this question, we combine new observational data with published data and investigate the multi-band temporal and spectral properties of the two afterglows. We find that both afterglows can be well interpreted within the framework of the jetted standard external shock wave model, and that the afterglow parameters for both bursts fall well within the range observed for other LGRBs. Hence, from the properties of the afterglows there is nothing to suggest that these bursts should have another progenitor than other LGRBs. Recently, Swift-discovered GRB 080503 also has the spike tail structure during its prompt -ray emission seemingly similar to GRB 060614. We analyse the prompt emission of this burst and find that this GRB is actually a hard-spike hard-tail burst with a spectral lag of 0.80.4 s during its tail emission. Thus, the properties of the prompt emission of GRB 060614 and GRB 080503 are clearly different, motivating further thinking of GRB classification. Finally we note that, whereas the progenitor of the two SN-less bursts remains uncertain, the core-collapse origin for the SN-less bursts would be quite certain if a wind-like environment can be observationally established, e.g, from an optical decay faster than the X-ray decay in the afterglow’s slow cooling phase.
1 Introduction
Gamma-ray bursts (GRBs) are the most luminous explosions in the Universe since the Big Bang. They fall into two (partially overlapping) populations according to their observed duration: -ray durations (measured as the time in which 90% of the fluence is emitted) longer than 2 s are defined as long GRBs (LGRBs) while bursts with duration shorter than 2 s are defined as short GRBs (SGRBs; Kouveliotou et al. 1993). It is widely accepted that at least the majority of LGRBs are driven by the collapse of massive stars (e.g., Woosley & Bloom 2006), although some LGRBs may be generated by the merger of compact objects (e.g., Kluźniak & Ruderman 1998; Rosswog et al. 2003). The strongest evidence for the collapsar scenario is the detection of bright Ic SN component photometrically and spectroscopically associated with nearby LGRBs such as GRB 980425, GRB 030329, GRB 031203, and XRF 060218 (Galama et al. 1998; Hjorth et al. 2003; Malesani et al. 2004; Sollerman et al. 2006; Pian et al. 2006; Campana et al. 2006). On the other hand, SGRBs may be powered by the merger of binary compact objects (e.g. Eichler et al. 1989; Narayan et al. 1992). This connection is observationally bolstered by the association of some SGRBs with old stellar populations and lack of accompanying bright SN components in cases such as GRB 050509B (Hjorth et al. 2005a), GRB 050709 (Fox et al. 2005; Hjorth et al. 2005b) and GRB 050724 (Berger et al. 2005; Malesani et al. 2007). However, challenging this simple picture some SGRBs displayed violent X-ray flares occurring at least s after the triggers, e.g., GRB 050709 (Fox et al. 2005) and GRB 050724 (Barthelmy et al. 2005; Campana et al. 2006; Malesani et al. 2007). This suggests long-lasting activity of the central engine and hence the current understanding of the GRB progenitor mechanism may be too simple (e.g., Fan et al. 2005; Dai et al. 2006; Rosswog et al. 2007). There is also evidence for activity of the inner engine on much longer time-scales (several days) for GRB 050709 (Watson et al. 2006) and GRB 070707 (Piranomonte et al. 2008).
The whole picture became more complicated after the discovery of GRB 060505 and GRB 060614, because both bursts are nearby LGRBs according to the conventional taxonomy but they are observationally not associated with SNe down to very strict limits (Fynbo et al. 2006; Della Valle et al. 2006; Gal-Yam et al. 2006). In this sense, they share the expected observational properties of both conventional LGRBs and SGRBs.
GRB 060505 had a fluence of erg cm-2 in the keV band, and a duration of s (Hullinger et al. 2006; McBreen et al. 2008). It was found to be associated with a bright, star-forming H II region within its host galaxy at (Ofek et al. 2007; Thöene et al. 2008). In the compact-star merger scenario the diameter of the H II region and the location of the GRB within it suggest that the delay time from birth to explosion of GRB 060505 was Myr. This is marginally matching the lower limit of the delay-time region for SGRBs (Ofek et al. 2007). On the other hand, the age of the H II region of Myr (Thöene et al. 2008) is consistent with the expectation for core-collapse in a massive star. The prompt emission of GRB 060614 consisted of a hard-spectrum component lasting s followed by a soft-spectrum component lasting s. Mangano et al. (2007) reported a photon index for the time interval [-2.83,-5.62] s since the BAT trigger () and for 5.62-97.0 s since the BAT trigger (). The fluences in the two components are erg cm-2 and erg cm-2 in the 15-350 keV band, respectively (Gehrels et al. 2006). Its host galaxy has a redshift of (Price et al. 2006). The host of GRB 060614 is very faint with an absolute magnitude of about (Fynbo et al. 2006). Its specific star-formation rate is quite low, but within the range covered by LGRB hosts (similar, e.g., to that of the GRB 050824 host galaxy, Sollerman et al. 2007).
The spectral lag has been invoked as a quantity that can be used to classify bursts such that SGRBs have zero lag and LGRBs fall on a well defined lag-luminosity relation (Norris et al., 2000, 2006). For GRB 060614 Gehrels et al. (2006) found that the spectral lags for the hard and soft components in the prompt -ray emission are both consistent with zero lag, falling entirely within the range for SGRBs. For GRB 060505, on the other hand, McBreen et al. (2008) found using the Suzaku/WAM and Swift/BAT data that the spectral lag for the prompt -ray emission is s, consistent with a LGRB identity. Furthermore, lags of LGRBs and SGRBs, regardless of their physical origins, appear to overlap quite significantly according to statistics of 265 Swift bursts (see Fig. 1 in Bloom et al. 2008). Alternatively, the so-called Amati relation can be used to provide hints on which class GRB 060505 and GRB 060614 belong to. According to this relation derived from the observed GRBs with sufficient data, all SGRBs are outliers because of their relatively higher peak energy, while all LGRBs, except the peculiar long GRB 980425, are consistent with this relation. Amati et al. (2007) find that GRB 060614 follows the relation whereas GRB 060505 does not. Hence, based on properties of the prompt emission other than the duration it seems impossible to establish clear evidence about which class of bursts GRB 060505 and GRB 060614 belong to.
To gain further insight on this topic, in this work we add our own observational data to already published data and study the afterglows of GRB 060505 and GRB 060614. We aim to determine from the afterglow properties whether these two bursts differ from other LGRBs, besides being SN-less, to provide further clues to the nature of their progenitors. The observations of the two afterglows and data reduction are presented in § 2.1 and § 2.2. At the beginning of § 3, we briefly introduce the leading external shock wave model employed to explain GRB afterglows, and apply it to GRB 060505 in § 3.1. GRB 060614 has been studied by Mangano et al. (2007); in § 3.2 and § 3.3 we re-analyze this burst and provide analytical and numerical constraints on the afterglow parameters, respectively. In § 4 we discuss possible progenitors of these two bursts in comparison with the recently discovered GRB 080503, which we define as the first hard-spike hard-tail Swift GRB.
Throughout this paper we use the notation for the afterglow monochromatic flux as a function of time, where represents the observed frequency and is the energy index which is related to the photon index in the form of . The convention has been adopted in cgs. In addition, we consider a standard cosmology model with km s-1 Mpc-1, , and .
2 Observations and data reduction
2.1 GRB 060505
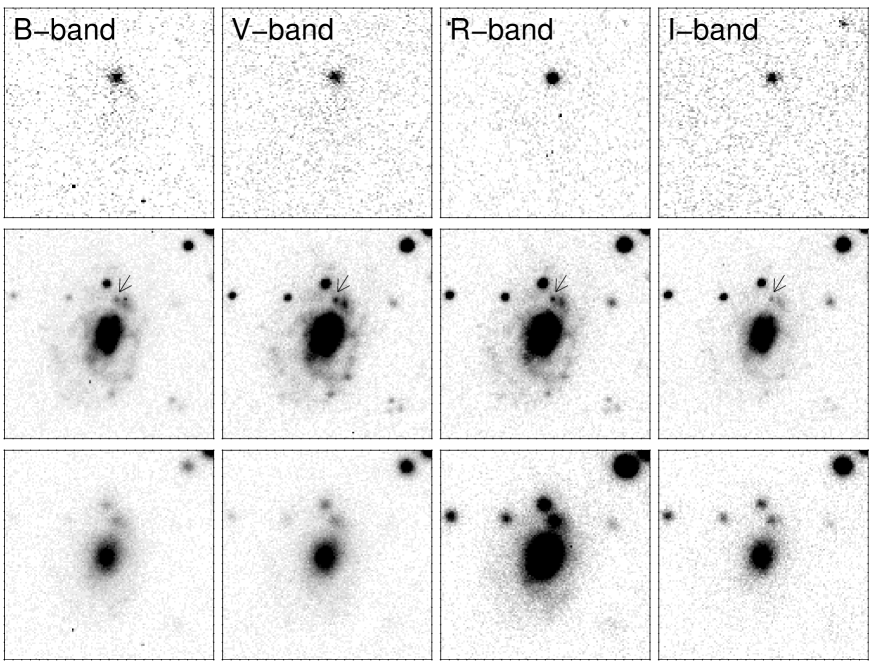
The field of GRB 060505 was observed with the European Southern Observatory (ESO) Very Large Telescope (VLT) and the FORS1 instrument on two epochs (see also Fynbo et al. 2006). On May 6.4, slightly more than one day after the burst, the field was observed in the and bands. In order to be able to subtract the underlying host galaxy, in particular the hosting star-forming region within the host galaxy (Thöene et al. 2008), the field was observed again on September 14.2, again in the and bands. The journal of observations is given in Table 1. Due to strong fringing and lack of calibration data we decided not to include the band data in the analysis.
The optical data were corrected for bias and flat-fielded using standard techniques. In order to subtract the underlying emission from the host galaxy we used the ISIS software (Alard & Lupton 1998). In Fig. 1 we show the result of the image subtraction. As can be seen, the afterglow is clearly detected in all four bands. We then performed photometry on the afterglow in the following way. We first duplicated an isolated, non-saturated star in each of the the first epoch images to a new empty position such that it also appeared in the subtracted image. We then used Daophot (Stetson 1987) to perform relative photometry between the afterglow and the star. Finally, we obtained the photometry on the standard system by measuring the magnitude of the comparison star using aperture photometry and the photometric zeropoints obtained based on Landolt stars by the ESO observatory calibration plan on the same night.
The Swift/XRT data were processed in a standard way using the Swift software version 29 (released 2008 June 29 as part of HEAsoft 6.5.1). We also included in the analysis the Swift/UVOT data points/upper limits and the late X-ray data point using the ACIS-S detector on board the Chandra X-ray observatory in Ofek et al. (2007).
2.2 GRB 060614
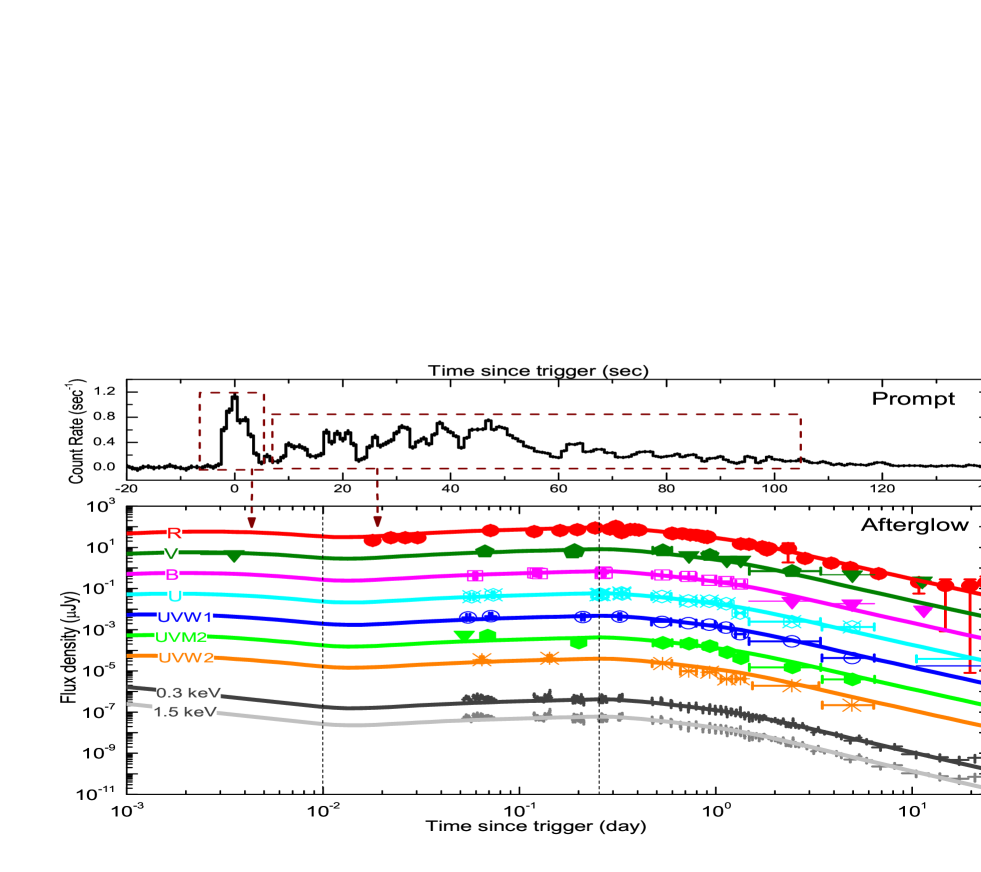
Table In search of progenitors for supernova-less GRBs 060505 and 060614: re-examination of their afterglows ††thanks: Based on observations collected at the European Organisation for Astronomical Research in the Southern Hemisphere, Chile, under programs 077.D-0661 and 177.A-0591. shows the comprehensive -band data of the afterglow of GRB 060614 from the Watcher 0.4m telescope, DFOSC at the Danish 1.5m telescope (D1.5m), the 1m telescope at the Siding Spring Observatory (SSO), VLT/FORS1, and VLT/FORS2. The -band data by the Watcher telescope were processed and made public for the first time, which not only are consistent with other -band data but provide the accurate peak time, 0.3 days since the BAT trigger, of the -band afterglow lightcurve. We have applied the correction for the Galactic extinction, mag (Schlegel et al. 1998), and subtracted the contribution of host galaxy, (Della Valle et al. 2006).
We collected Swift/UVOT data from Mangano et al. (2007). For the UVOT bands, we also applied the correction for Galactic extinction and subtracted the contribution of host galaxy using the template in Mangano et al. (2007).
The Swift/XRT lightcurve and spectrum data were collected from the UK Swift Science Data Centre (Evans et al. 2007). The X-ray lightcurves at 0.3 keV and 1.5 keV are shown in Fig. 5 so that the spectral slope, , in the 0.3-10 keV band is taken into account when we performed the numerical fitting.
The Swift/BAT lightcurve in the 15-350 keV band was processed with the batgrbproduct task of the HEAsoft 6.5.1.
3 Interpretation of the two afterglows
Suppose the radial density profile of the circumburst medium takes the form , then if the medium is interstellar medium-like (ISM-like) while if the medium stellar wind-like (WIND-like).
We use the standard fireball afterglow theory reviewed by, e.g., Piran (2005), with the simple microphysical assumptions of constant energy fractions imparted to the swept-up electrons, , and to the generated magnetic field, , respectively. For the evolution of the synchrotron spectrum, we adopt the prefactors of equation (1) in Yost et al. (2003) for the ISM scenario, and those of equations (11-14) in Chevalier & Li (2000) for the WIND scenario. We note that both cases lead to the afterglow closure relations made of the temporal decay index and the spectral index , depending upon the spectral segment and the electron energy distribution index, (see Tables II and IV of Piran 2005).
For numerical calculation, we follow the general treatment of Huang et al. (2000) and Fan & Piran (2006), that is, one first calculates the overall dynamical evolution of the GRB outflow, and then calculates the synchrotron radiation at different times, including different corrections such as, e.g., the equal-arrival-time-surface effect and the synchrotron-self-absorption effect.
3.1 Constraints on GRB 060505
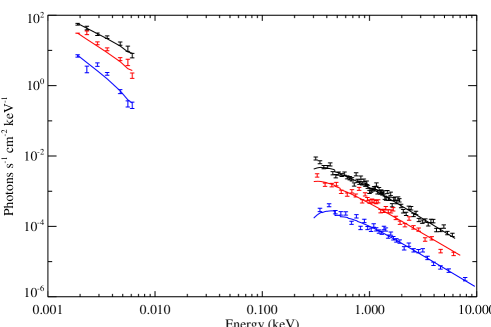
To establish a broadband spectral energy distribution (SED) we extrapolate the X-ray flux to the epoch of the optical data (i.e., 1.125 days after the burst). The optical data were corrected for foreground Galactic extinction of , , , (Schlegel et al., 1998). We fit the SED in count space (see Starling et al. 2007) with an absorbed power law model, where Galactic absorption in the X-rays is fixed at cm-2 (Kalberla et al., 2005) and intrinsic X-ray absorption and optical/UV extinction in the host galaxy are free parameters. Solar metallicity is assumed in the X-ray absorption model, and extinction in the host is assumed to be SMC-like (Pei, 1992). The resulting SED is shown in Fig. 2. The derived spectral slope is . The host galaxy extinction is consistent with zero, but with a best fitting value of mag and a 90% upper limit of mag, while the X-ray absorption is found to be cm-2 (where errors are quoted at the 90 % confidence level). The fit has a /dof of 5.3/4.
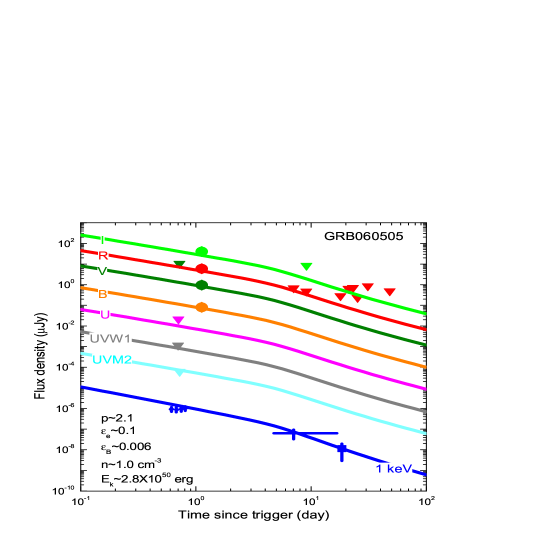
The index indicates that the cooling frequency is already below the optical at this time and the energy spectral index is slightly larger than 2. Indeed, the numerical fit, shown in Fig. 3, yields , and other afterglow parameters are , , , , and the half-opening jet angle . These parameters are within the range of LGRB afterglows, but the limited data prevent us from getting more insight on the properties of this afterglow. Both the SED measurement and the numerical fit tend to render it unnecessary to employ ad hoc models (e.g., macronova in Ofek et al. 2007) to interpret this afterglow.
3.2 Preliminary constraints on GRB 060614
We constructed afterglow SEDs in GRB 060614 at three epochs, i.e., 0.187 days, 0.798 days, and 1.905 days. The results are listed in Table 3 and shown in Fig. 4. Our SEDs are fully consistent with those in Mangano et al. (2007) measured at 0.116, 0.347, 0.694, and 1.736 days. Both works show that there exists a spectral break between the optical and the X-ray before 0.26 days while afterwards both the optical and the X-ray are in the same spectral segment with the spectral index .
The afterglow lightcurves show that energy injection exists between and days, which presumably would change the SED during this period. If the injection frequency is between the optical and the X-ray, then it may lead to that the lightcurves have a very shallow rising in the optical band and a very shallow decay in the X-ray band. Indeed, the observational data fit this interpretation very well (Mangano et al. 2007). We found that this optical-to-Xray lightcurve behavior still holds after performing different corrections. The result of our analysis shows that a flat or gradually increasing lightcurve is generally a description as good as a slow decaying except in the X-ray band. A temporal peak, clearly shown in optical bands, exists days after the burst. Afterwards the afterglow decays with until days when it steepens significantly to . There is only one -band upper limit before days, the starting time of energy injection. Therefore, to constrain the afterglow properties we use data after days.
The index after days indicates that the afterglow is in the slow cooling case of
until at least a few days. Using the afterglow closure relations we find , which gives the energy spectral index , which then gives the decay index , in good agreement with the observed decay law (). Furthermore, this value of is very close to the observed decay index of after days, in good agreement with the theoretically predicted decay law after a jet break, i.e., at any wavelength from X-ray to optical. Therefore, as discussed by Mangano et al. 2007, the break at days is likely the so-called jet break (Rhoads 1999; Sari et al. 1999; Zhang et al. 2006; Nousek et al. 2006).
Since the optical decay is never faster than the X-ray decay, there is no indication of a WIND-like circumburst medium for this afterglow. Also since radio data are not available, analytical constraint on is impossible for this afterglow. Using the earliest useful data, we put a lower limit on and an upper limit on as
| (1) |
and
| (2) |
where and . Using the latest useful data, we put the lower limit on as
| (3) |
where . In detail, the above three equations give rise to the constraints
| (4) |
3.3 Numerical constraints on GRB 060614
We find that the afterglow data can be reasonably reproduced by the following parameters (see Fig. 5 for a plot of our fit): , , , erg, , and rad. The energy injection takes place at s and ends at s after the burst, and the energy injection is nearly a constant with a rate . Substituting these parameters into equation (8), the numerical constraint is in agreement with the analytical constraint.
If the energy injection is from the wind of a millisecond magnetar, to fit the observational data at the late stage of the whole energy injection period, the magnetar is required to have dipole radiation , where is the dipole magnetic field strength of the magnetar, is the radius of the magnetar, is the initial angular frequency of radiation, s is the initial spin-down timescale of the magnetar, and is the typical moment of inertia of the magnetar (Pacini 1967). However, because the optical flux is roughly proportional to , where is the sum of the isotropic-equivalent kinetic energy and the injected energy, then the predicted optical flux at the early stage of the energy injection period (e.g., days in Fig. 5) would be much higher than the observed flux. In detail, at day, there would be , indicating that the predicted optical flux should be 3 times the observed flux. Therefore the magnetar model is not convincing.
Note that the prompt ray lightcurve may have two components: the earlier hard spike with an isotropic energy erg and the latter soft tail (sometimes called extended emission) with an isotropic energy erg. The early part is spectrally hard thus the outflow might be ultra-relativistic, while the latter part is spectrally soft suggesting the bulk Lorentz factor of the outflow became lower. This is because the optically thin condition yields a lower limit on , where is the total luminosity of the outflow, and is the typical variability timescale of the late soft ray emission (Rees & Mészáros 1994). In our numerical calculation, we find the bulk Lorentz factor of the forward shock at s while at s. If the energy carried by the material of the late time GRB ejecta satisfies the relation (Rees & Mészáros 1998) for , the constant energy injection form taken in the afterglow modeling can be reproduced (Zhang et al. 2006). In this model, for the outflow accounting for the hard spike emission the energy efficiency is , while for the outflow accounting for the soft tail emission, the energy efficiency is . The decreasing efficiencies from early spike to late tail may be due to the smaller contrast between the Lorentz factors of the fast material and that of the slow material.
4 Discussion and conclusion
As shown in several early papers, for GRB 060505 (Fynbo et al. 2006) and GRB 060614 (Fynbo et al. 2006; Della Valle et al. 2006; Gal-Yam et al. 2006) there is no accompanying SN emission, down to limits hundreds of times fainter than the archetypical SN 1998bw that accompanied GRB 980425, and fainter than any Type Ic SN ever observed. Multi-wavelength observations of the early afterglow exclude the possibility of significant dust obscuration. For GRB 060505 the properties of the host galaxy (Ofek et al. 2007; Thöene et al. 2008) as well as the spectral lag of the prompt emission (McBreen et al. 2008) is most consistent with the properties expected for the long-duration class of GRBs. For GRB 060614 the duration of the prompt emission places the burst firmly within the long-duration class of GRBs, but the negligible spectral lag (Gehrels et al. 2006) and the relatively modest star-formation activity of the host galaxy is more similar to the expected properties for the short-duration class of GRBs. In this paper we have investigated whether or not the properties of the two afterglows could provide some hints to the most likely progenitor types for these bursts.
For GRB 060505, the numerical fit of its afterglow shows that the standard jetted external shock wave model is consistent with the data, yielding a typical interstellar medium density of , a wide jet angle , and a possible jet break at days. For GRB 060614, the standard external shock wave model is again consistent with the data, but apparently needing to invoke energy injection. The afterglow shows the clearest achromatic jet break among all Swift bursts studied so far, decaying in a broken power-law from to at days. An achromatic peak, especially in the UBVR bands, occurs at days, which we interpret as resulting from an episode of strong energy injection as Mangano et al. (2007) suggested. Numerical fit yields a circumburst density of , being consistent with the inferred value in Caito et al. (2008), and a jet angle of . The inferred afterglow parameters for the two bursts fall within the range for other LGRBs. If it had not been for the observed absence of associated SNe we would have no reason, from the afterglow properties, to question their classification as LGRBs.
After discovery of these two GRBs, to reconcile all SN-observed and SN-less GRBs within the conventional framework of short ( s) and long ( s) GRBs, a new classification was proposed, in which GRBs featuring a short-hard spike and a (possible) long-soft tail would be ascribed to the conventional short class, or Type I in the new taxonomy, while all other GRBs, or Type II, would comprise the conventional long class (Zhang et al. 2007, see also Kann et al. 2007). The new classification expands the range of the conventional short class, and is applicable to GRB 060505 and GRB 060614, which then would be SN-less due to a merger-related progenitor rather than SN-less massive stellar death.
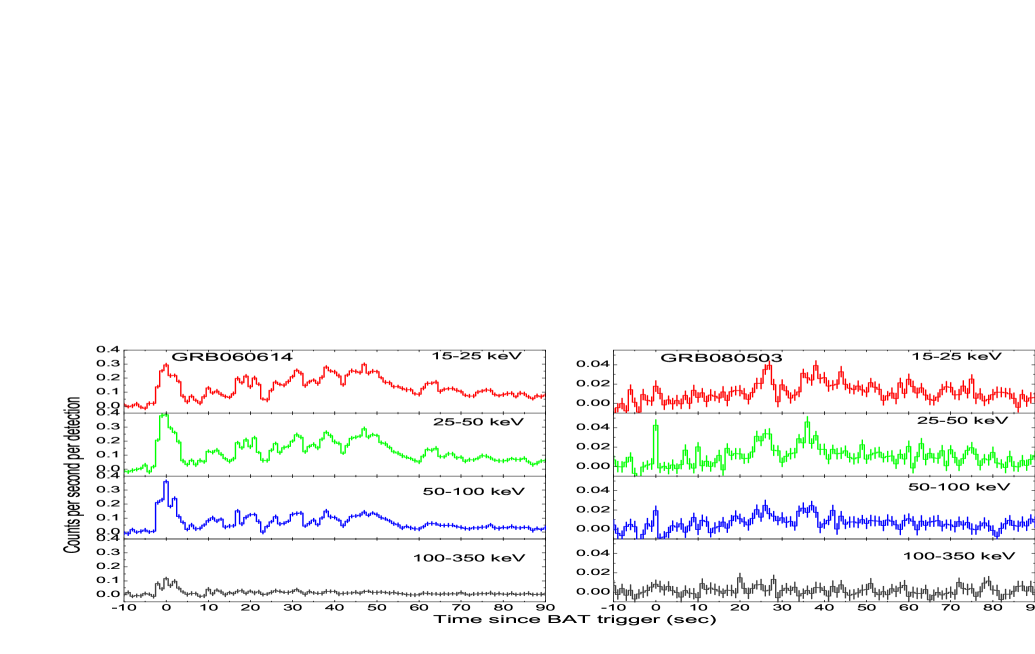
However, a recent burst, GRB 080503, seems to challenge the new classification. This burst also has a temporal spike tail structure in the prompt emission phase. The values of the initial spike and the total emission in the 15-150 keV band are s and s, respectively (Perley et al. 2008). The fluence of the non-spike emission measured from 5 s to 140 s after the BAT trigger in the 15-150 keV band is , being around 30 times that of the spike emission in the same band. This fluence ratio is much higher than the ratio of around 6 for GRB 060614, and higher than any previous similar Swift GRB. For GRB 060614 and GRB 080503 we extracted the BAT lightcurves in different energy bins, shown in Fig. 6, for comparison study. For GRB 080503 we have analysed the spectral evolution during the prompt emission period by BAT and XRT and list our analysis and that of other groups in Table In search of progenitors for supernova-less GRBs 060505 and 060614: re-examination of their afterglows ††thanks: Based on observations collected at the European Organisation for Astronomical Research in the Southern Hemisphere, Chile, under programs 077.D-0661 and 177.A-0591.. From these we conclude that: (1) The results of different groups are fully consistent with each other. (2) The photon indices for the spike and non-spike emissions are consistent within their error regions ( confidence level). A strong spectral softening from the spike phase to the non-spike phase can be excluded. A cutoff power-law fit does not improve the fitting, yielding the error of larger than 100%. (3) During the BAT-XRT overlap period, the XRT spectra are always harder than the BAT spectra, which implies that the BATXRT spectra (0.3-150 keV) would be harder than the BAT spectra (15-150 keV) alone. This adds more evidence that from spike to non-spike the spectra did not soften considerably. In addition, note that for all conventional LGRBs (e.g., from BATSE), there is a general trend that the spectra during the prompt emission would soften mildly from the beginning time to the ending time (Norris et al. 2000). Therefore, the prompt spectral evolution of GRB 080503 is different from that of GRB 060614.
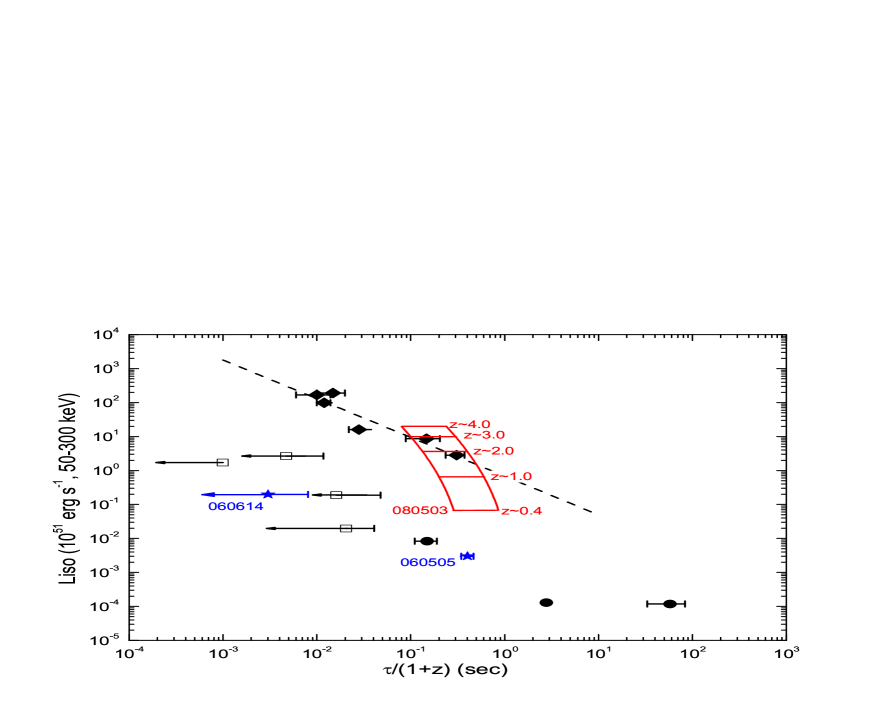
In addition, we computed the spectral lags in different energy bands using the 64 ms binning lightcurves, following the method in Norris et al. (2000) and Chen et al. (2005). The lag during the initial spike phase is consistent with zero. From 5 to 50 s since BAT trigger, the lags are s for the 25-50 keV vs. 15-25 keV band and s for the 50-100 keV vs. 15-25 keV band respectively, both well above the lag range for SGRBs. Again the lag of GRB 080503 is in contrast with that of GRB 060614. The redshift of GRB 080503 was not measured mainly because its optical and X-ray afterglows became very faint shortly after the BAT trigger (never exceeding 25 mag in deep observations starting at hr since trigger), but the g-band photometric detection imposes a limit of approximately z4 (Perley et al. 2008). In Fig. 7 we show the possible position of GRB 080503 in the spectral lag-peak luminosity plane relative to the positions of previous LGRBs and SGRBs. As can be seen, for the extended emission of GRB 080503, its position is outside the SGRB population at a very high confidence level regardless of its redshfit. For the spike emission of GRB 080503, its position is within the SGRB population because of a peak luminosity comparable to that of the extended emission, as well as a negligible spectral lag.
The very faint optical and X-ray afterglows of GRB 080503 may indicate the circumburst density is very low. This is consistent with the fact that the afterglow is located away from any host galaxy down to 28.5 mag in deep Hubble Space Telescope imaging (Perley et al. 2008). These observational signatures contribute to put GRB 080503 into the merger class. If we ignore the lag function in classifying GRBs and relax the restriction of “soft-tail” for a Type I GRB to “either soft- or hard- tail”, then it would be (even more) ambiguous, also operationally difficult to define the type of spiketail GRBs among all long GRBs, especially among those at for which a SN search in their afterglows is difficult or impossible. Bearing in mind that GRBs can be either luminous or under-luminous, and the redshift could be either high or low, then the problems would be: up to what duration should be classified as a spike, and how much should the flux ratio be for the spike component over the non-spike component? If GRB 080503 is interpreted as a merger burst, then it enhances the possibility that a merger could produce a long GRB, at least in the prompt emission phase, mimicking the one produced by a collapsar. GRB 080503 is a dark burst with the optical-to-Xray spectral slope well below 0.5, the critical value for defining a dark burst (Jakobsson et al. 2004), at 0.05 days after the burst. We speculate that some other dark bursts may have their progenitor same as GRB 080503.
The progenitors of GRB 060505 and GRB 060614 remain uncertain based on their observations and the current GRB and SN theory. Other than the lack of a SN component, their afterglows are actually not peculiar when compared with the afterglows of other LGRBs. According to the current theoretical study, in the core-collapse scenario the “fallback”-formed black holes or progenitors with relatively low angular momentum could produce such SN-less GRBs (e.g., Fryer et al. 2006; Sumiyoshi et al. 2006; Nakazato et al. 2008; Kochanek et al. 2008; Valenti et al. 2009 for observational existence of an extremely faint Ibc SN), or in the merger scenario the two compact objects also could produce such SN-less GRBs if the formed remnant, a differentially rotating neutron star or an uniformly rotating magnetar, has not collapsed into a black hole immediately (Kluźniak & Ruderman, 1998; Rosswog et al., 2003). A difference existing in the afterglows between these two scenarios is that the collapsar model predicts a WIND-like circumburst medium created by the Wolf-Rayet progenitor star while the merger model does not. As a matter of fact the WIND signature is not clearly evident in most LGRBs, but this should not necessarily lead to the merger origin for these bursts because the definite WIND signature is an ideal case for a constant wind off a massive star. If lucky enough, the core-collapse origin for a SN-less GRB (no matter whether it has the hard-spike soft-tail structure) will be quite certain if in the afterglow, either the X-ray flux decays as with its spectrum as for the phase (normally in early afterglow), or the optical decay index is larger than the X-ray decay index by a factor of for the slow cooling phase of the WIND scenario.
References
- Alard & Lupton (1998) Alard, C., & Lupton, R. H., 1998, ApJ, 503, 325
- Amati et al. (2007) Amati, L., et al., 2007, A&A, 463, 913
- Barthelmy et al. (2005) Barthelmy, S. D., et al., 2005, Nature, 438, 994
- Berger et al. (2005) Berger, E., et al., 2005, Nature, 438, 988
- Bloom et al. (2008) Bloom, J. S., Butler, N. R., & Perley, D. A., 2008, arXiv:0804.0965
- Caito et al. (2008) Caito, L. et al., 2008, A&A submitted, arXiv:0810.4855v2
- Campana et al. (2006) Campana, S., et al., 2006, Nature, 442, 1008
- Chevalier & Li (2000) Chevalier, R. A., & Li, Z. Y., 2000, ApJ, 536, 195
- Chen et al. (2005) Chen, L., Lou, Y. Q., Wu, M. et al., 2005, ApJ, 619, 983
- Dai et al. (2006) Dai, Z. G., Wang, X. Y., Wu, X. F., & Zhang, B. 2006, Science, 311, 1127
- Della Valle et al. (2006) Della Valle, M., et al., 2006, Nature, 444, 1050
- Eichler et al. (1989) Eichler, D., Livio, M., Piran, T., & Schramm, D. N., 1989, Nature, 340, 126
- Evans et al. (2007) Evans, P. A., et al., 2007, A&A, 469, 379
- Fan et al. (2005) Fan, Y. Z., Zhang, B., & Proga, D., 2005, ApJ, 635, L129
- Fan & Piran (2006) Fan, Y. Z., & Piran, T., 2006, MNRAS, 369, 197
- Fox et al. (2005) Fox, D. B., et al., 2005, Nature, 437, 845
- Fryer et al. (2006) Fryer, C. L., Young, P. A., & Hungerford, A. L., 2006, ApJ, 650, 1028
- Fynbo et al. (2006) Fynbo, J. P. U., et al. 2006, Nature, 444, 1047
- Galama et al. (1998) Galama, T. J., et al., 1998, Nature, 395, 670
- Gal-Yam et al. (2006) Gal-Yam, A., et al. 2006, Nature, 444, 1053
- Gehrels et al. (2006) Gehrels, N., et al. 2006, Nature, 444, 1044
- Hjorth et al. (2003) Hjorth, J., et al., 2003, Nature, 423, 847
- Hjorth et al. (2005a) Hjorth, J., et al., 2005a, ApJ, 630, L117
- Hjorth et al. (2005b) Hjorth, J., et al., 2005b, Nature, 437, 859
- Huang et al. (2000) Huang, Y. F., Dai, Z. G., & Lu, T., 2000, MNRAS, 316, 943
- Hullinger et al. (2006) Hullinger, D., et al. 2006, GCN Circ. 5142
- Jakobsson et al. (2004) Jakobsson, P., Hjorth, J., Fynbo, J. P. U., et al., 2004, ApJ, 617, L21
- Kalberla et al. (2005) Kalberla, P. M. W., Burton, W. B., Hartmann, D., et al., 2005, A&A, 440, 775
- Kann et al. (2007) Kann, D. A., et al., 2007, ApJ submitted, (arXiv:0712.2186)
- King et al. (2007) King, A., Olsson, E., & Davies, M. B., 2007, MNRAS, 374, L34
- Kluźniak & Ruderman (1998) Kluźniak, W., & Ruderman, M., 1998, ApJ, 505, L113
- Kochanek et al. (2008) Kochanek, C. S., et al., 2008, ApJ, 684, 1336
- Kouveliotou et al. (1993) Kouveliotou, C., Meegan, C. A., Fishman, G. J., et al., 1993, ApJ, 413, L101
- Mao et al. (2008) Mao, J., et al., 2008, GCN Rep. 138.1
- Malesani et al. (2004) Malesani, D., et al., 2004, ApJ, 609, L5
- Malesani et al. (2007) Malesani, D., et al., 2007, A&A, 473, 77
- Mangano et al. (2007) Mangano, M., et al., 2007, A&A, 470, 105
- McBreen et al. (2008) McBreen, S., Foley, S., Watson, D., et al., 2008, ApJ, 677, L85
- Nakazato et al. (2008) Nakazato, K., 2008, PRD, in press (arXiv:0810.3734)
- Narayan et al. (1992) Narayan, R., Paczyński, B. & Piran, T., 1992, ApJ, 395, L83
- Nomoto et al. (2007) Nomoto, K., Tanaka, M., Tominaga, N., et al., 2007, arXiv:0707.2219
- Norris et al. (2000) Norris, J. P., et al., 2000, ApJ, 534, 248
- Norris et al. (2006) Norris, J. P., & Bonnell, J. T., 2006, ApJ, 643, 266
- Nousek et al. (2006) Nousek J. A., et al., 2006, ApJ, 642, 389
- Ofek et al. (2007) Ofek, E. O., Cenko, S. B., Gal-Yam, A., et al., 2007, ApJ, 662, 1129
- Pacini (1967) Pacini, F., 1967, Nature, 216, 567
- Pei (1992) Pei, Y. C., 1992, ApJ, 395, 130
- Perley et al. (2008) Perley, D. A., et al., 2008, arXiv:0811.1044
- Pian et al. (2006) Pian, E., et al., 2006, Nature, 442, 1011
- Piran (2005) Piran, T., 2005, Rev. of Modern Phys., 76, 1143
- Piranomonte et al. (2008) Piranomonte, S., D’Avanzo, P., Covino, S., et al., 2007, A&A, 491, 183
- Price et al. (2006) Price, P. A., Berger, E., & Fox, D. B., 2006, GCN Circ. 5275
- Rees & Mészáros (1994) Rees, M. J., Mészáros, P., 1994, ApJ, 430, L93
- Rees & Mészáros (1998) Rees, M. J., Mészáros, P., 1998, ApJ, 496, L1
- Rhoads (1999) Rhoads, J. E., 1999, ApJ, 525, 737
- Rosswog et al. (2003) Rosswog, S., Ramirez-ruiz, E., & Davis, M., 2003, MNRAS, 345, 1077
- Rosswog et al. (2007) Rosswog, S., 2007, MNRAS, 376, L48
- Sari et al. (1998) Sari, R., Piran, T., & Narayan, R., 1998, ApJ, 597, L17
- Sari et al. (1999) Sari, R., Piran, T., & Halpern, J. P., 1999, ApJ, 519, L17
- Schmidt et al. (2006) Schmidt, B., Peterson, B., & Lewis, K., 2006, GCN Circ. 5258
- Schlegel et al. (1998) Schlegel, D. J., Finkbeiner, D. P., & Davis, M., 1998, ApJ, 500, 525
- Sollerman et al. (2006) Sollerman, J., et al., 2006, A&A, 454, 503
- Sollerman et al. (2007) Sollerman, J., et al., 2007, A&A, 466, 839
- Starling et al. (2007) Starling, R. L. C., Wijers, R. A. M. J., Wiersema, K., et al., 2007, ApJ, 661, 787
- Stetson (1987) Stetson, P. B., 1987, PASP, 99, 191
- Sumiyoshi et al. (2006) Sumiyoshi, K., et al., 2006, PRL, 97, 1101
- Thöene et al. (2008) Thöene, C. C., Fynbo, J. P. U., Oestlin, G., et al., 2008, ApJ, 676, 1151
- Tominaga et al. (2007) Tominaga, N., et al., 2007, ApJ, 657, L77
- Valenti et al. (2009) Valenti, S., et al., 2009, Nature submitted, (arXiv:0901.2074)
- Watson et al. (2006) Watson, D., Hjorth, J., Jakobsson, P., et al., 2006, A&A, 454, L123
- Woosley & Bloom (2006) Woosley, S. E., & Bloom, J. S., 2006, ARA&A, 44, 507
- Yost et al. (2003) Yost, S. A., Harrison, F. A., Sari, R., & Frail, D. A., 2003, ApJ, 597, 459
- Zhang et al. (2006) Zhang, B., Fan, Y. Z., Dyks, J., et al., 2006, ApJ, 642, 354
- Zhang et al. (2007) Zhang, B., et al., 2007, ApJ, 655, L25

| Timea | Bandpass | Vega Magb | (mag) | Instrument | Ref |
|---|---|---|---|---|---|
| [day] | |||||
| 0.702 | UVW1 | 20.71 | – | UVOT | 1 |
| 0.706 | U | 20.31 | – | UVOT | 1 |
| 0.721 | V | 20.34 | – | UVOT | 1 |
| 0.724 | UVM2 | 22.05 | – | UVOT | 1 |
| 1.102 | r | 21.65 | 0.16 | GMOS | 1 |
| 1.118 | g | 22.37 | 0.08 | GMOS | 1 |
| 1.125 | I | 21.21 | 0.04 | VLT+FORS1 | 2 |
| 1.125 | R | 21.74 | 0.04 | VLT+FORS1 | 2 |
| 1.125 | V | 22.14 | 0.04 | VLT+FORS1 | 2 |
| 1.125 | B | 22.48 | 0.04 | VLT+FORS1 | 2 |
| 7.041 | g | 24.74 | – | GMOS | 1 |
| 7.055 | r | 24.02 | – | GMOS | 1 |
| 9.078 | g | 24.54 | – | GMOS | 1 |
| 9.092 | r | 24.32 | – | GMOS | 1 |
| 9.105 | i | 22.96 | – | GMOS | 1 |
| 18.025 | R | 24.95 | – | VLT+FORS2 | 3 |
| 21.125 | R | 24.05 | – | D1.5m+DFOSC | 3 |
| 23.125 | R | 23.95 | – | D1.5m+DFOSC | 3 |
| 25.325 | R | 25.15 | – | Keck+LRIS | 3 |
| 31.125 | R | 23.75 | – | D1.5m+DFOSC | 3 |
| 48.125 | R | 24.35 | – | D1.5m+DFOSC | 3 |
| Datea | Veg Magb | (mag) | Instrument | Ref |
|---|---|---|---|---|
| [days] | ||||
| 0.67347 | 19.45 | 0.01 | D1.5m+DFOSC | 1 |
| 0.74059 | 19.60 | 0.01 | D1.5m+DFOSC | 1 |
| 0.79292 | 19.64 | 0.01 | D1.5m+DFOSC | 1 |
| 0.84034 | 19.73 | 0.01 | D1.5m+DFOSC | 1 |
| 0.89998 | 19.86 | 0.01 | D1.5m+DFOSC | 1 |
| 0.9037 | 19.88 | 0.01 | D1.5m+DFOSC | 1 |
| 0.90743 | 19.80 | 0.01 | D1.5m+DFOSC | 1 |
| 0.91146 | 19.92 | 0.01 | D1.5m+DFOSC | 1 |
| 1.82138 | 21.45 | 0.06 | D1.5m+DFOSC | 1 |
| 0.0179 | 20.29 | 0.34 | SSO | 2 |
| 0.0221 | 19.95 | 0.22 | SSO | 2 |
| 0.0262 | 19.95 | 0.22 | SSO | 2 |
| 0.0303 | 19.95 | 0.22 | SSO | 2 |
| 0.0713 | 19.10 | 0.10 | SSO | 2 |
| 0.1188 | 19.20 | 0.11 | SSO | 2 |
| 0.1608 | 19.10 | 0.10 | SSO | 2 |
| 0.1968 | 18.99 | 0.10 | SSO | 2 |
| 0.2427 | 18.79 | 0.10 | SSO | 2 |
| 0.28938 | 18.92 | 0.17 | Watcher | 3 |
| 0.30887 | 18.58 | 0.11 | Watcher | 3 |
| 0.36713 | 18.97 | 0.10 | Watcher | 3 |
| 0.38661 | 18.96 | 0.11 | Watcher | 3 |
| 0.40613 | 19.04 | 0.11 | Watcher | 3 |
| 0.33131 | 19.33 | 0.30 | Watcher | 3 |
| 1.33851 | 20.69 | 0.21 | Watcher | 3 |
| 1.47729 | 20.75 | 0.26 | Watcher | 3 |
| 2.33615 | 21.27 | 0.86 | Watcher | 3 |
| 0.59715 | 19.42 | 0.03 | VLT+FORS2 | 4 |
| 0.59885 | 19.43 | 0.02 | VLT+FORS2 | 4 |
| 0.59989 | 19.42 | 0.02 | VLT+FORS2 | 4 |
| 0.60094 | 19.45 | 0.02 | VLT+FORS2 | 4 |
| 0.602 | 19.45 | 0.02 | VLT+FORS2 | 4 |
| 0.60313 | 19.43 | 0.02 | VLT+FORS2 | 4 |
| 0.60418 | 19.46 | 0.02 | VLT+FORS2 | 4 |
| 0.60524 | 19.45 | 0.03 | VLT+FORS2 | 4 |
| 0.6063 | 19.45 | 0.02 | VLT+FORS2 | 4 |
| 0.8701 | 19.88 | 0.03 | VLT+FORS2 | 4 |
| 0.89996 | 19.92 | 0.02 | VLT+FORS2 | 4 |
| 1.72583 | 21.07 | 0.02 | VLT+FORS1 | 4 |
| 1.86974 | 21.25 | 0.02 | VLT+FORS1 | 4 |
| 2.84199 | 22.47 | 0.06 | VLT+FORS1 | 4 |
| 3.86899 | 23.04 | 0.09 | VLT+FORS1 | 4 |
| 4.84365 | 23.58 | 0.19 | VLT+FORS1 | 4 |
| 6.74083 | 24.32 | 0.30 | VLT+FORS1 | 4 |
| 10.81441 | 25.40 | 0.77 | VLT+FORS1 | 4 |
| 14.77259 | 25.78 | 1.08 | VLT+FORS1 | 4 |
| Model | /dof | |||||
|---|---|---|---|---|---|---|
| mag | (1022 cm-2) | keV | ||||
| Epoch 1 | ||||||
| PL+SMC | 0.02 | 0.02 | 1.750.02 | - | - | 60/68 |
| BKNPL+SMC | 0.2 | 0.03 | 0.90.4 | 0.005 | 1.90.1 | 49/66 |
| BKNPL+SMC | 0.04 | 0.03 | -0.5 | 0.012 | 1.86 | 50/67 |
| Epoch 2 | ||||||
| PL+SMC | 0.04 | 0.03 | 1.78 | - | - | 42/36 |
| BKNPL+SMC | 0.3 | 0.10 | 1.3 | 0.005 | 2.20.2 | 27/34 |
| BKNPL+SMC | 0.08 | 0.09 | -0.5 | 0.2 | 2.1 | 31/35 |
| Epoch 3 | ||||||
| PL+SMC | 0.09 | 0.06 | 1.810.04 | - | - | 26/35 |
| BKNPL+SMC | 0.20.1 | 0.08 | 0.1 | unbounded | 1.90.1 | 24/33 |
| BKNPL+SMC | 0.13 | 0.070.03 | -0.5 | 0.008 | 1.86 | 24/34 |
| GRB | Time Interval | Photon Index | Index Errora | Bandpass | Ref | |
|---|---|---|---|---|---|---|
| s | keV | |||||
| GRB 060614 | -2.83-5.62 | 1.63 | 0.07 | 15-150 | 1 | |
| – | 5.62-97.0 | 2.21 | 0.04 | 15-150 | 1 | |
| – | 97.0-176.5 | 2.37 | 0.13 | 15-150 | 1 | |
| GRB 080503 | 0.2-0.6 | 1.74 | 0.28 | 15-150 | 2 | |
| – | 10-200 | 1.93 | 0.14 | 15-150 | 2 | |
| – | 0.0-0.7 | 1.59 | 0.28 | 15-150 | 3 | |
| – | 10-170 | 1.91 | 0.12 | 15-150 | 3 | |
| – | 81-282 | 1.27 | 0.03 | – | 0.3-10 | 3 |
| – | 81-280 | 1.33 | 0.05 | 0.3-10 | 4 | |
| – | 83-107 | 1.00 | 0.13 | – | 0.3-10 | 5 |
| – | 107-128 | 1.11 | 0.13 | – | 0.3-10 | 5 |
| – | 128-150 | 1.42 | 0.14 | – | 0.3-10 | 5 |
| – | 150-185 | 1.66 | 0.16 | – | 0.3-10 | 5 |
| – | 185-256 | 1.77 | 0.16 | – | 0.3-10 | 5 |