AGB Stars in the Fornax Dwarf Spheroidal Galaxy
Abstract
We report on a multi-epoch study of the Fornax dwarf spheroidal galaxy, made with the Infrared Survey Facility, over an area of about . The colour-magnitude diagram shows a broad well-populated giant branch with a tip that slopes down-wards from red to blue, as might be expected given Fornax’s known range of age and metallicity. The extensive AGB includes seven Mira variables and ten periodic semi-regular variables. Five of the seven Miras are known to be carbon rich. Their pulsation periods range from 215 to 470 days, indicating a range of initial masses. Three of the Fornax Miras are redder than typical LMC Miras of similar period, probably indicating particularly heavy mass-loss rates. Many, but not all, of the characteristics of the AGB are reproduced by isochrones from Marigo et al. for a 2 Gyr population with a metallicity of Z=0.0025.
An application of the Mira period-luminosity relation to these stars yields a distance modulus for Fornax of 20.69 (internal), (total) (on a scale that puts the LMC at 18.39 mag) in good agreement with other determinations. Various estimates of the distance to Fornax are reviewed.
keywords:
1 Introduction
The Fornax dwarf spheroidal galaxy (, ) is one of the most populous dwarf spheroidal companions to the Milky Way, second only to the disrupting Sagittarius dwarf. It shows evidence for a very extended history of star formation that ceased only a few million years ago (e.g. Gallart et al. 2005; Coleman & de Jong 2008) and a significant range of metallicity (e.g. Battaglia et al. 2006). It has its own system of five metal deficient globular clusters (Buonanno et al. 1999; Letarte et al. 2006), an extended asymptotic giant branch (AGB) with numerous carbon stars (e.g. Westerlund, Edvardsson & Lundgren 1987; Lundgren 1990) and evidence of substructure, possibly a consequence of merging with another galaxy (Coleman et al. 2004; Olszewski et al. 2006). The young stars are more concentrated towards the centre of the galaxy (Coleman & de Jong 2008) and there is an anti-correlation between the iron content and the velocity dispersion (Battaglia et al. 2006), suggestive of an age metallicity relation.
This paper is one of a series aimed at finding and characterizing luminous AGB variables within Local Group galaxies; it follows similar work on Leo I and Phoenix (Menzies et al. 2002, 2008). Here we report on multi-epoch photometry which enables us to identify the AGB variables within Fornax. The large-amplitude variables, generally known as Miras are of particular interest, first, because they tell us about the intermediate age population of which they are the most luminous representatives, secondly because they provide an independent distance calibration and thirdly because they will be major contributors to the processed material currently entering the interstellar medium of Fornax and are therefore an important source of enrichment.
Estimates for the interstellar extinction towards Fornax are mostly in the range mag (e.g. Greco et al. 2007 and references therein). Here we use a value near the middle of this range, mag, which amounts to and is therefore almost negligible in our work.
2 Observations
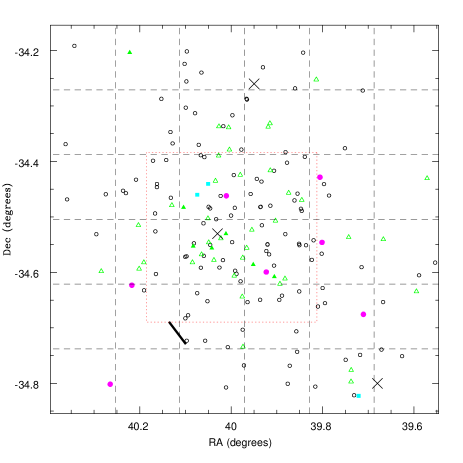
Observations were made with the SIRIUS camera on the Japanese-SAAO Infrared Survey Facility (IRSF) at Sutherland. The camera produces simultaneous , and images covering what is typically a arcmin square field (after dithering) with a scale of 0.45 arcsec/pixel. To cover most of the Fornax galaxy, a grid was used, with successive image centres displaced by 7 arcmin in RA along a row and successive rows displaced by 7 arcmin in Dec (see Fig. 1).
Since the aim was to find long-period variables, observations were made at about 15 epochs spread over 3 years in the central grid; poor weather and other constraints reduced this number to about 11 in the outer ring of 20 fields. In each field, 10 dithered images were combined after flat-fielding and dark and sky subtraction. Typical exposures were of either 10 or 20 s, depending on the seeing and on the brightness of the sky in the band. Photometry was performed using DoPHOT (Schechter et al. 1993) in ‘fixed-position’ mode, using the best-seeing -band image in each field as templates. Aladin was used to correct the coordinate system on each template and RA and Dec were determined for each measured star. This allowed a cross-correlation to be made with the 2MASS catalogue (Cutri et al. 2003), and photometric zero points were determined by comparison of our photometry with that of 2MASS. In each field, stars in common with the 2MASS catalogue with photometric quality A in each colour were identified and the IRSF zero point was adjusted to match that of 2MASS. The number of common stars per field varies from over 20 in the middle four fields to as few as four in field 26; only 5 fields have fewer than 7 stars in common with 2MASS. The mean standard deviation over all fields of the differences between IRSF and 2MASS are 0.06 mag in and and 0.08 mag in . No account was taken of possible colour transformations, such as in Kato et al. (2007). Those transformations were derived using highly reddened objects to define the red end and it is not obvious that the same transformations will apply to carbon stars.
For a given field, 10 dithered frames were median averaged to produce an image for measurement. Stars near the edge of a frame tend to have lower photometric precision since they might not have appeared on all 10 dithered frames. Variables appearing in the overlap regions between fields may have been missed because of this effect, though this is unlikely for large amplitude very red variables.
3 Colour-Magnitude and Colour-Colour Diagrams
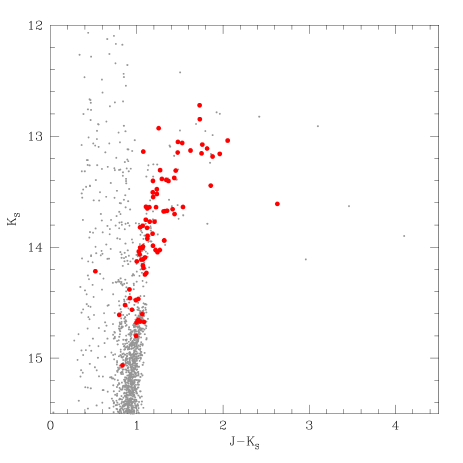
Fig. 2 shows the diagram and Fig. 3 the diagram for stars selected as follows: for bright stars, i.e. those with , or mag, standard deviations mag; for fainter stars the limit depends on the magnitude: for it is , and for it is and for it is . Mean magnitudes from all of our observations are used in all of these plots. Selecting the stars in this way is intended to reject any poor quality photometry, but it also eliminates large amplitudes variables. The latter are extracted separately, by examining the light curves of the bright stars with large scatter, and are shown in the figures as different symbols.
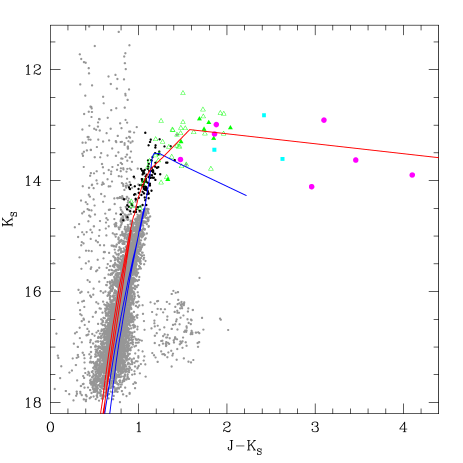
In Fig. 2 foreground contamination is seen as a broad band with over the whole magnitude range with a few bluer points appearing at fainter magnitudes.
Unresolved galaxies provide background contamination and we can compare with the galaxies discussed by Morris et al. (2007), who list 2MASS magnitudes for 228 confirmed galaxies with in the central 2.9 square degrees of the Fornax cluster of galaxies. These are point sources with velocities which indicate that they are behind the Fornax galaxy cluster. These sources, which have mean colours of mag and mag and a mean mag, are clearly magnitude limited. If the source density were the same behind the Fornax dwarf spheroidal we would expect to see about thirty in our area of 0.4 square degrees. In fact in the sample illustrated in Fig. 2 there is only one object with mag that stands clear from the dwarf spheroidal giant branch. What we do find is over 130 sources, with similar colours to the Morris et al. sample, in the magnitude range mag (magnitude limited at ), i.e. about 1.5 mag fainter at than the Morris et al. sources. In the two-colour diagram, Fig. 3, these sources can be seen to the right of the giant branch sources with the same mean colours as those of the Morris et al. sample (at 1.5 mag further the volume covered is 8 times larger). The most probable explanation of this is that we resolved galaxies of the brightness that were unresolved by Morris et al. and therefore rejected them early on in our analysis that was focused on stars. Indeed there are 2MASS sources with colours and magnitudes similar to the Morris et al. unresolved galaxies, which we do not find because they are resolved.
The bulk of the stars fall on the Fornax giant branch with mag, while the AGB is represented by a group of stars immediately above the tip of the red giant branch (TRGB) and by variable stars extending out to mag. The AGB stars are discussed in detail below.
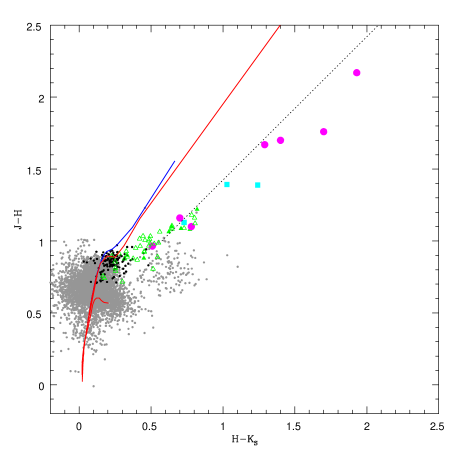
It is clear that the TRGB is sloped, being brighter at the red side ( mag at mag) than at the blue side ( mag at mag). See also Figs. 4 and 6 which show the TRGB at a larger scale. This is to be expected in a galaxy which contains stars with a range of ages and metallicities. Battaglia et al. (2006) find evidence for a young (few hundred Myr), an intermediate age (2 to 8 Gyr) and an old ( Gyr) population. The same authors quote earlier work as showing that the giant branch peaks at , but has a metal poor tail extending to and a metal rich one extending beyond . We anticipate that our own results will be dominated by the large intermediate age population. Two models from Marigo et al. (2008) are overplotted on Figs. 2 and 3 providing a useful qualitative comparison. A distance modulus of 20.69 mag is assumed (see section 8 for a detailed discussion of the distance). The isochrone which goes through the variable stars (in Fig. 2) is that for a population with an age of 2 Gyr and a metallicity of Z=0.0025 (). For this model the TRGB is at mag and . mag The other curve represents a population with an age of 10 Gyr and the same metallicity; its TRGB is at mag and mag. These two curves bracket the giant branch observations and most of the stars are probably in this 2 to 10 Gyr age range, as others have pointed out before (e.g. Gallart et al. 2005; Coleman & de Jong 2008). The failure of the models to come close to the observations of the dust enshrouded AGB stars in Fig. 3 is presumably the result of an incorrect choice of dust properties (in particular the composition and/or particle size/shape etc.). The models offer alternative dust compositions, but none of them results in isochrones that fit all aspects of the observations. As we refine our understanding of the dust chemistry it will become easier to include the appropriate parameters in the models.
4 Asymptotic Giant Branch
We limit our discussion to those stars which are above the TRGB as we have no systematic way of determining which of the lower luminosity objects are actually on the AGB. The selection of variables, most of which will be AGB stars, is described below. Other probable AGB members are selected with , and mag (this last condition being to minimize the contribution from foreground dwarfs). These are the stars that are shown in black in Figs. 2 and 3. Our selection criteria will certainly miss a few real AGB stars, particularly those in the overlap parts of our fields where the photometry was not so good, and will probably contain a few foreground stars, but the contamination should be small.
| RA | Dec | F | 2MASS | Sp | other names | ||||||||
|---|---|---|---|---|---|---|---|---|---|---|---|---|---|
| (equinox 2000) | (mag) | ||||||||||||
| 2 | 38 | 12.8 | –34 | 34 | 56.6 | 29009 | 15.54 | 14.83 | 14.71 | 0.83 | 02381284-3434561 | ||
| 2 | 38 | 21.3 | –34 | 36 | 18.5 | 29006 | 15.39 | 14.67 | 14.52 | 0.87 | 02382132-3436180 | BW5 | |
| 2 | 38 | 30.2 | –34 | 45 | 3.3 | 31012 | 15.34 | 14.53 | 14.25 | 1.10 | 02383024-3445030 | BW9 for08_006 | |
| 2 | 38 | 40.2 | –34 | 39 | 12.1 | 30010 | 15.53 | 14.75 | 14.44 | 1.09 | 02384018-3439121 | ET0229 | |
| 2 | 38 | 41.1 | –34 | 44 | 20.7 | 31013 | 15.54 | 14.82 | 14.57 | 0.97 | 02384113-3444205 | ||
| 2 | 38 | 50.9 | –34 | 16 | 19.5 | 25005 | 15.20 | 14.32 | 14.24 | 0.96 | 02385093-3416192 | ||
| 2 | 38 | 51.6 | –34 | 35 | 25.9 | 12006 | 14.79 | 13.91 | 13.64 | 1.15 | 02385157-3435253 | S2/5 | DK32 BW14 S8 |
| 2 | 38 | 52.3 | –34 | 44 | 55.2 | 32012 | 15.22 | 14.39 | 14.22 | 1.00 | 02385229-3444553 | for08_001 | |
| 2 | 38 | 55.4 | –34 | 49 | 16.8 | 32003 | 14.21 | 13.34 | 13.14 | 1.08 | 02385547-3449166 | BW16 | |
| 2 | 38 | 59.9 | –34 | 45 | 26.8 | 32011 | 15.29 | 14.45 | 14.26 | 1.03 | 02385991-3445268 | ||
| 2 | 39 | 0.3 | –34 | 22 | 34.0 | 10009 | 15.09 | 14.18 | 14.02 | 1.06 | 02390030-3422334 | ||
| 2 | 39 | 8.6 | –34 | 27 | 40.8 | 11009 | 14.48 | 13.57 | 13.36 | 1.11 | 02390862-3427407 | ||
| 2 | 39 | 10.7 | –34 | 39 | 19.4 | 13010 | 14.86 | 14.10 | 13.82 | 1.04 | 02391074-3439196 | BW21 S18 DI26 | |
| 2 | 39 | 11.2 | –34 | 26 | 26.8 | 11018 | 15.15 | 14.23 | 14.04 | 1.11 | 02391126-3426268 | ||
| 2 | 39 | 12.0 | –34 | 37 | 41.3 | 12012 | 15.23 | 14.38 | 14.14 | 1.09 | 02391201-3437414 | BW23 S20 DK30 DI24 | |
| 2 | 39 | 12.5 | –34 | 33 | 58.8 | 12008 | 15.02 | 14.16 | 13.90 | 1.13 | 02391249-3433587 | BW24 S21 DK35 DI21 | |
| 2 | 39 | 14.5 | –34 | 39 | 41.3 | 13009 | 14.73 | 13.88 | 13.58 | 1.16 | 02391445-3439416 | ||
| 2 | 39 | 15.8 | –34 | 48 | 20.9 | 32009 | 14.82 | 13.98 | 13.79 | 1.03 | 02391582-3448206 | ||
| 2 | 39 | 16.7 | –34 | 32 | 31.3 | 12027 | 15.47 | 14.72 | 14.48 | 0.99 | 02391676-3432313 | BW25 DI18 | |
| 2 | 39 | 17.6 | –34 | 34 | 38.5 | 12007 | 15.09 | 14.21 | 13.95 | 1.14 | 02391767-3434384 | S3/2 | DK34 |
| 2 | 39 | 20.7 | –34 | 33 | 3.2 | 3023 | 14.55 | 13.66 | 13.36 | 1.19 | 02392068-3433030 | M | WEL-M2 |
| 2 | 39 | 21.3 | –34 | 23 | 29.9 | 9008 | 15.10 | 14.26 | 14.08 | 1.01 | 02392133-3423292 | BW27 S28 ET0215 | |
| 2 | 39 | 22.2 | –34 | 12 | 13.7 | 24013 | 15.46 | 14.61 | 14.55 | 0.91 | 02392221-3412133 | ET0096 | |
| 2 | 39 | 23.0 | –34 | 29 | 20.3 | 2045 | 15.38 | 14.59 | 14.45 | 0.93 | 02392297-3429198 | ||
| 2 | 39 | 23.4 | –34 | 29 | 7.3 | 2018 | 14.59 | 13.71 | 13.40 | 1.19 | 02392337-3429069 | C | WEL-C15 BW29 S30 |
| 2 | 39 | 24.2 | –34 | 33 | 2.7 | 3024 | 15.06 | 14.22 | 13.88 | 1.18 | 02392418-3433021 | C | DK33 BW30 S31 |
| 2 | 39 | 24.2 | –34 | 38 | 3.4 | 14014 | 14.74 | 13.90 | 13.64 | 1.11 | 02392423-3438027 | C | DK29 BW31 |
| 2 | 39 | 24.4 | –34 | 32 | 53.6 | 3026 | 15.12 | 14.30 | 14.09 | 1.04 | 02392438-3432530 | ||
| 2 | 39 | 25.2 | –34 | 27 | 28.7 | 2022 | 14.89 | 14.04 | 13.83 | 1.06 | 02392514-3427283 | ||
| 2 | 39 | 25.4 | –34 | 44 | 35.3 | 33004 | 15.04 | 14.16 | 14.00 | 1.04 | 02392535-3444353 | M | BW32 DK24 |
| 2 | 39 | 25.8 | –34 | 42 | 22.5 | 14010 | 14.88 | 14.04 | 13.81 | 1.07 | 02392578-3442220 | BW33 S36 | |
| 2 | 39 | 26.5 | –34 | 16 | 5.9 | 9044 | 15.36 | 14.50 | 14.47 | 0.89 | 02392646-3416054 | ET0099 | |
| 2 | 39 | 26.8 | –34 | 28 | 12.6 | 2051 | 15.51 | 14.72 | 14.56 | 0.94 | 02392675-3428121 | BW34 S38 | |
| 2 | 39 | 29.3 | –34 | 46 | 5.7 | 33016 | 15.41 | 14.69 | 14.61 | 0.80 | 02392925-3446057 | BW35 | |
| 2 | 39 | 30.3 | –34 | 48 | 2.6 | 33003 | 14.99 | 14.27 | 14.08 | 0.91 | 02393033-3448026 | M | WEL-M26 |
| 2 | 39 | 30.7 | –34 | 24 | 8.1 | 2068 | 15.13 | 14.32 | 14.07 | 1.06 | 02393065-3424078 | ||
| 2 | 39 | 31.5 | –34 | 22 | 59.3 | 9009 | 15.12 | 14.26 | 14.08 | 1.04 | 02393145-3422586 | ||
| 2 | 39 | 31.6 | –34 | 31 | 51.4 | 3027 | 15.01 | 14.15 | 13.93 | 1.08 | 02393155-3431509 | C | WEL-C14 |
| 2 | 39 | 33.3 | –34 | 38 | 30.7 | 14032 | 15.21 | 14.38 | 14.15 | 1.06 | 02393333-3438302 | C | DK28 |
| 2 | 39 | 34.7 | –34 | 38 | 58.0 | 14013 | 15.04 | 14.10 | 13.63 | 1.41 | C | DK17 | |
| 2 | 39 | 37.5 | –34 | 25 | 0.3 | 2025 | 14.81 | 13.94 | 13.70 | 1.11 | 02393752-3425000 | ||
| 2 | 39 | 37.5 | –34 | 35 | 15.6 | 3043 | 15.30 | 14.42 | 14.19 | 1.10 | 02393755-3435149 | ||
| 2 | 39 | 39.5 | –34 | 28 | 47.0 | 2020 | 14.43 | 13.56 | 13.30 | 1.13 | 02393946-3428468 | ||
| 2 | 39 | 40.1 | –34 | 34 | 2.9 | 3020 | 15.21 | 14.33 | 14.09 | 1.13 | 02394011-3434024 | ||
| 2 | 39 | 40.9 | –34 | 32 | 59.5 | 3053 | 15.33 | 14.46 | 14.22 | 1.11 | |||
| 2 | 39 | 40.9 | –34 | 32 | 57.0 | 3025 | 14.99 | 14.09 | 13.83 | 1.17 | 02394094-3432569 | ||
| 2 | 39 | 41.5 | –34 | 33 | 41.0 | 3021 | 15.00 | 14.04 | 13.68 | 1.33 | 02394154-3433404 | BW40 S61 | |
| 2 | 39 | 43.3 | –34 | 13 | 48.7 | 24011 | 15.15 | 14.28 | 14.15 | 1.00 | 02394336-3413485 | ||
| 2 | 39 | 43.9 | –34 | 30 | 54.1 | 3029 | 15.24 | 14.41 | 14.16 | 1.07 | 02394386-3430534 | BW41 | |
| 2 | 39 | 44.1 | –34 | 26 | 10.3 | 2024 | 14.92 | 14.02 | 13.77 | 1.15 | 02394408-3426101 | BW42 S63 ET0076 | |
| 2 | 39 | 44.5 | –34 | 28 | 54.2 | 2047 | 15.37 | 14.52 | 14.30 | 1.07 | |||
| 2 | 39 | 44.7 | –34 | 28 | 55.5 | 2019 | 14.99 | 14.16 | 13.90 | 1.09 | 02394470-3428552 | ||
| 2 | 39 | 44.8 | –34 | 38 | 57.7 | 14012 | 14.78 | 13.90 | 13.63 | 1.14 | 02394486-3438572 | M | DK27 |
| 2 | 39 | 46.5 | –34 | 25 | 52.9 | 2061 | 15.05 | 14.31 | 14.15 | 0.90 | 02394652-3425527 | ||
| 2 | 39 | 49.8 | –34 | 27 | 30.6 | 2056 | 15.21 | 14.33 | 14.13 | 1.08 | 02394978-3427304 | ||
| 2 | 39 | 51.4 | –34 | 39 | 12.9 | 14031 | 15.17 | 14.34 | 14.11 | 1.05 | 02395144-3439126 | BW45 S72 DI25 | |
| 2 | 39 | 51.8 | –34 | 17 | 18.0 | 9013 | 14.93 | 14.13 | 13.89 | 1.04 | 02395179-3417174 | ||
| 2 | 39 | 52.0 | –34 | 17 | 13.0 | 9014 | 15.29 | 14.43 | 14.23 | 1.06 | 02395200-3417123 | ET0102 | |
| 2 | 39 | 53.3 | –34 | 46 | 2.6 | 34013 | 15.18 | 14.30 | 13.99 | 1.19 | 02395331-3446026 | C | DK10 BW47 S76 |
| 2 | 39 | 54.0 | –34 | 42 | 11.5 | 15017 | 15.01 | 14.15 | 13.97 | 1.04 | 02395400-3442111 | ||
| 2 | 39 | 54.6 | –34 | 22 | 42.8 | 2028 | 14.99 | 14.16 | 13.68 | 1.31 | 02395462-3422426 | C | DK43 BW48 S80 |
| 2 | 39 | 55.1 | –34 | 36 | 57.6 | 4038 | 15.17 | 14.46 | 14.34 | 0.83 | 02395512-3436571 | ||
| 2 | 39 | 57.2 | –34 | 36 | 9.1 | 4014 | 14.89 | 14.00 | 13.79 | 1.10 | 02395721-3436085 | ||
| 2 | 39 | 58.0 | –34 | 35 | 49.1 | 4015 | 15.20 | 14.31 | 14.12 | 1.08 | 02395749-3435485 | ||
| 2 | 39 | 58.1 | –34 | 29 | 0.9 | 1015 | 15.02 | 14.29 | 14.12 | 0.89 | 02395807-3429007 | M | WEL-M14 |
| 2 | 39 | 58.7 | –34 | 25 | 28.1 | 1018 | 14.69 | 13.77 | 13.51 | 1.19 | 02395861-3425279 | SC4/8 | WEL-M11 BW49 S87 |
| 2 | 39 | 59.4 | –34 | 19 | 0.1 | 8013 | 14.88 | 14.11 | 13.93 | 0.94 | 02395941-3418596 | ||
| 2 | 39 | 59.5 | –34 | 32 | 43.7 | 4029 | 15.10 | 14.20 | 14.01 | 1.08 | 02395951-3432432 | ||
| 2 | 40 | 0.1 | –34 | 29 | 50.9 | 1030 | 15.48 | 14.62 | 14.44 | 1.04 | 02400007-3429507 | ||
| 2 | 40 | 1.8 | –34 | 44 | 4.4 | 34016 | 15.21 | 14.39 | 14.26 | 0.95 | 02400181-3444039 | ||
| 2 | 40 | 2.7 | –34 | 48 | 26.1 | 34010 | 15.35 | 14.54 | 14.23 | 1.11 | 02400272-3448257 | C | DK5 BW54 S93 |
| 2 | 40 | 4.1 | –34 | 20 | 11.3 | 8012 | 15.18 | 14.29 | 14.06 | 1.13 | 02400414-3420108 | ||
| 2 | 40 | 4.4 | –34 | 34 | 40.1 | 4019 | 14.49 | 13.59 | 13.26 | 1.24 | 02400435-3434397 | C | DK64 |
| 2 | 40 | 5.6 | –34 | 27 | 43.3 | 1002 | 14.68 | 13.72 | 13.38 | 1.29 | 02400553-3427432 | SC2/8 | DK54 BW56 |
| 2 | 40 | 6.2 | –34 | 35 | 28.1 | 4051 | 15.20 | 14.37 | 14.12 | 1.08 | 02400618-3435276 | C | WEL-C6 |
| 2 | 40 | 7.9 | –34 | 30 | 14.4 | 1013 | 15.13 | 14.26 | 13.88 | 1.24 | 02400789-3430142 | C | WEL-C11 |
| 2 | 40 | 11.0 | –34 | 33 | 0.8 | 4059 | 15.43 | 14.57 | 14.35 | 1.08 | 02401104-3433004 | ||
| 2 | 40 | 11.1 | –34 | 29 | 4.3 | 1034 | 15.49 | 14.66 | 14.47 | 1.02 | 02401102-3429042 | BW63 | |
| 2 | 40 | 11.9 | –34 | 28 | 54.4 | 1016 | 15.11 | 14.25 | 14.03 | 1.09 | 02401186-3428544 | ||
| 2 | 40 | 12.5 | –34 | 39 | 6.2 | 15021 | 14.85 | 13.99 | 13.75 | 1.11 | 02401246-3439057 | ||
| 2 | 40 | 13.7 | –34 | 43 | 23.2 | 15016 | 14.93 | 14.10 | 13.87 | 1.06 | 02401368-3443228 | ||
| 2 | 40 | 14.1 | –34 | 23 | 31.5 | 8006 | 15.01 | 14.13 | 13.85 | 1.16 | 02401403-3423316 | ||
| 2 | 40 | 14.4 | –34 | 34 | 12.6 | 4023 | 14.97 | 14.08 | 13.81 | 1.16 | 02401438-3434122 | M | WEL-M3 |
| 2 | 40 | 14.6 | –34 | 30 | 41.2 | 1012 | 14.87 | 13.94 | 13.68 | 1.19 | 02401454-3430410 | M | WEL-M7 |
| 2 | 40 | 15.7 | –34 | 14 | 23.2 | 23005 | 15.32 | 14.56 | 14.44 | 0.87 | 02401565-3414227 | ||
| 2 | 40 | 16.0 | –34 | 35 | 29.7 | 4017 | 15.05 | 14.17 | 13.97 | 1.08 | 02401595-3435293 | ||
| 2 | 40 | 16.0 | –34 | 23 | 19.4 | 8022 | 15.55 | 14.71 | 14.54 | 1.01 | 02401603-3423189 | ||
| 2 | 40 | 17.1 | –34 | 22 | 12.2 | 8009 | 14.95 | 14.10 | 13.83 | 1.12 | 02401709-3422118 | M2S | DK49 BW68 S116 |
| 2 | 40 | 17.9 | –34 | 38 | 14.6 | 15022 | 15.51 | 14.72 | 14.56 | 0.95 | 02401789-3438142 | ||
| 2 | 40 | 19.0 | –34 | 18 | 46.7 | 8015 | 14.71 | 13.74 | 13.48 | 1.23 | 02401904-3418465 | SC3/8 | WEL-M19 BW70 S119 |
| 2 | 40 | 19.6 | –34 | 32 | 50.9 | 4061 | 15.31 | 14.51 | 14.34 | 0.97 | M | WEL-M4 | |
| 2 | 40 | 22.7 | –34 | 40 | 37.7 | 15019 | 15.07 | 14.21 | 13.99 | 1.07 | 02402267-3440373 | BW73 S124 | |
| 2 | 40 | 23.3 | –34 | 12 | 5.8 | 23009 | 15.29 | 14.43 | 14.33 | 0.97 | 02402332-3412058 | ||
| 2 | 40 | 23.4 | –34 | 43 | 23.0 | 15006 | 14.74 | 13.83 | 13.38 | 1.36 | 02402342-3443225 | C | WEL-C17 |
| 2 | 40 | 23.4 | –34 | 34 | 15.2 | 4022 | 15.07 | 14.24 | 14.02 | 1.05 | 02402345-3434148 | ||
| 2 | 40 | 23.5 | –34 | 15 | 20.5 | 23004 | 15.25 | 14.32 | 14.20 | 1.04 | 02402354-3415204 | ET0161 | |
| 2 | 40 | 23.9 | –34 | 18 | 10.9 | 8017 | 15.10 | 14.19 | 13.95 | 1.16 | 02402389-3418108 | ||
| 2 | 40 | 24.1 | –34 | 40 | 57.7 | 15018 | 15.31 | 14.51 | 14.31 | 1.00 | 02402411-3440572 | ||
| 2 | 40 | 24.1 | –34 | 34 | 18.5 | 5013 | 14.98 | 14.11 | 13.76 | 1.22 | 02402415-3434182 | C | WEL-C16 |
| 2 | 40 | 24.5 | –34 | 13 | 26.8 | 23006 | 15.34 | 14.57 | 14.42 | 0.92 | 02402450-3413268 | ||
| 2 | 40 | 30.8 | –34 | 22 | 3.1 | 7010 | 15.49 | 14.75 | 14.52 | 0.97 | 02403081-3422028 | ||
| 2 | 40 | 31.7 | –34 | 27 | 55.6 | 6020 | 14.90 | 14.04 | 13.85 | 1.05 | |||
| 2 | 40 | 32.0 | –34 | 20 | 48.9 | 7012 | 14.98 | 14.09 | 13.77 | 1.21 | 02403195-3420487 | ||
| 2 | 40 | 34.1 | –34 | 23 | 50.6 | 6028 | 15.12 | 14.26 | 13.95 | 1.17 | 02403414-3423503 | C | DK51 |
| 2 | 40 | 36.7 | –34 | 17 | 13.7 | 7015 | 15.05 | 14.22 | 13.90 | 1.15 | 02403668-3417137 | ||
| 2 | 40 | 39.0 | –34 | 26 | 26.0 | 6025 | 15.53 | 14.81 | 14.66 | 0.87 | 02403902-3426257 | ||
| 2 | 40 | 39.0 | –34 | 26 | 46.5 | 6024 | 15.35 | 14.44 | 14.24 | 1.11 | 02403907-3426461 | ||
| 2 | 40 | 39.6 | –34 | 36 | 10.0 | 5011 | 15.10 | 14.20 | 14.04 | 1.06 | 02403957-3436095 | ||
| 2 | 40 | 39.8 | –34 | 31 | 33.5 | 5015 | 15.18 | 14.35 | 14.11 | 1.08 | 02403983-3431330 | ||
| 2 | 40 | 40.0 | –34 | 29 | 37.4 | 6009 | 14.97 | 14.06 | 13.82 | 1.14 | 02404004-3429370 | ||
| 2 | 40 | 41.1 | –34 | 23 | 55.2 | 6027 | 15.43 | 14.64 | 14.32 | 1.11 | 02404109-3423549 | ||
| 2 | 40 | 45.8 | –34 | 37 | 55.9 | 16006 | 15.06 | 14.21 | 14.10 | 0.96 | 02404579-3437560 | ||
| 2 | 40 | 50.0 | –34 | 25 | 58.4 | 6015 | 14.76 | 13.85 | 13.53 | 1.23 | 02405005-3425580 | ||
| 2 | 40 | 55.3 | –34 | 27 | 25.7 | 6022 | 15.33 | 14.40 | 14.18 | 1.15 | 02405536-3427252 | ||
| 2 | 40 | 56.8 | –34 | 27 | 9.7 | 6014 | 15.11 | 14.18 | 13.95 | 1.16 | 02405687-3427093 | ||
| 2 | 41 | 5.9 | –34 | 27 | 32.4 | 19004 | 15.05 | 14.20 | 13.94 | 1.11 | 02410593-3427318 | ||
| 2 | 41 | 10.8 | –34 | 31 | 51.9 | 18009 | 15.05 | 14.16 | 13.92 | 1.12 | 02411082-3431518 | BW84 S153 DI16 | |
| 2 | 41 | 22.4 | –34 | 11 | 29.9 | 21012 | 15.26 | 14.34 | 14.17 | 1.09 | 02412242-3411296 | ||
| 2 | 41 | 26.2 | –34 | 28 | 6.0 | 19003 | 14.40 | 13.53 | 13.26 | 1.14 | 02412623-3428056 | ||
| 2 | 41 | 27.0 | –34 | 22 | 7.7 | 20009 | 14.94 | 14.04 | 13.75 | 1.19 | 02412701-3422074 | ||
| Notes: The column following RA and Dec, headed F, contains a running number unique to the star within our system. | |||||||||||||
| The column labeled Sp contains the spectral type where this is available; other names are as follows: numbers preceded by S are | |||||||||||||
| from Stetson et al. (1998), DK from Demers & Kunkel (1979), DI from Demers & Irwin (1987), BW from Bersier & Wood (2002), | |||||||||||||
| WEL from Westerlund et al. (1987), DDB from Demers et al. (2002), GLM from Groenewegen et al. (2008), | |||||||||||||
| ‘for” and “ET” come from Battaglia et al. (2006). | |||||||||||||
Table LABEL:agb lists all 120 of the AGB candidates (omitting the variables listed in Tables 2 and 3), together with their 2MASS and other names and spectral types when available. The mean of these stars shows very little scatter ( mag), so if they are variables they have low infrared amplitudes. Thirty of these are in fact in Bersier & Wood’s (2002) list of candidate long-period variables, so they may have larger amplitudes at shorter wavelengths. Nine of the AGB stars are in common with Battaglia et al. (2006) and all are radial velocity members of Fornax. Their metallicities, derived from CaII, fall in the range , with a mean [Fe/H]=–0.86, i.e. essentially identical with the models illustrated in the colour-magnitude diagram (Fig. 2).
Fig. 1 shows the positions of the upper AGB candidates and AGB variables on the sky. Note that Fornax extends well beyond the area that our observations cover; the tidal radius is (Irwin & Hatzidimitriou 1993) and globular clusters numbers 1 and 5 fall outside our region (see also Coleman & de Jong’s (2008) figs. 1 and 3). The overall distribution is more or less as one would expect given the well known ellipsoidal shape of the galaxy. It is interesting that the Miras, which are probably representative of the intermediate age population, are not highly concentrated towards the centre.
The Marigo et al. (2008) models, discussed above, fit these AGB stars much better than any models published previously. One of the major improvements is the use of proper molecular opacities as convective dredge up occurs, another is the incorporation of dust into the radiative transfer calculations for the AGB, and several different prescriptions for the dust composition are allowed. For the illustrated isochrone the dust was a mixture of silicates (for O-rich stars) and graphites (for C-rich stars) from Bressan et al. (1998). Using the alternative dust combinations from Groenewegen (2006) results in an AGB that terminates at mag, before it reaches the reddest of our AGB stars, but is closer to the observed points in the two-colour diagram (Fig. 3). The illustrated isochrone becomes carbon rich as it goes brighter than mag. As discussed below most (although not all) of the stars brighter than this, that have spectra, are indeed C-rich. Isochrones of 1 or 3 Gyr or with Z=0.001 and 0.005 do not pass through as many of the observed points. Note that stars on the 10 Gyr track never become carbon rich.
The isochrone fits are discussed further in section 7 in relation to the long-period variable stars.
5 Stars with spectral types
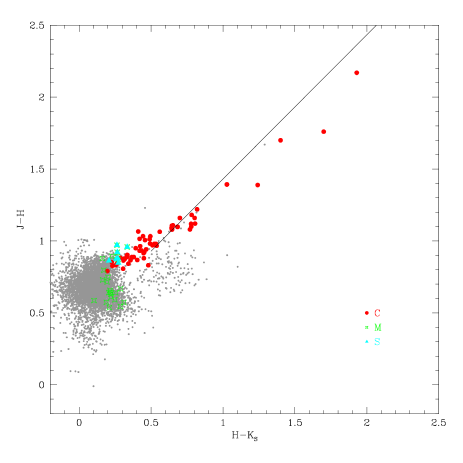
An extensive spectroscopic survey of Fornax by Westerlund et al. (1987) and by Lundgren (1990) confirmed the presence of some known carbon stars and led to the discovery of many others. Furthermore, M-type spectra were found for a large number of their survey stars, while S characteristics were found for a small number. In Fig. 4 we show all the C, S and M stars from these surveys over-plotted on our colour-magnitude diagram.
Demers et al. (2002) examined 2MASS sources within a narrow colour-magnitude range and identified 5 new carbon stars. Mauron et al. (2004) confirmed one of these (their M30). Groenewegen et al. (2008) identified further C-stars, including some of the variables discussed below, from near-infrared spectra of 2MASS sources. Matsuura et al. (2007) observed five stars from Fornax, selected from our survey, with the infrared spectrometer on the Spitzer Space Telescope, demonstrating all to be C-rich. These stars are cross identified in Tables LABEL:agb, 2 and 3 as well as being marked in Fig. 4. Note that those G/K stars identified by Groenewegen et al. (2008) that are within the area that we surveyed are all below the TRGB.

During the later stages of AGB evolution thermal pulsing results in the dredge up of carbon to the surface of the star. The surface C/O-ratio will gradually increase, and the star will go from being O-rich (spectral type M or S) to C-rich (spectral type C). Stars with S-type spectra have C/O ratios less than, but very close to, one (although see Lebzelter et al. (2008) for an exception to this). If the initial metallicity of the star is low it will take very little dredge-up to bring C/O to more than one and this transition therefore tends to occur earlier in metal-weak populations. There is also a mass dependence, in that this so called “third dredge-up” does not occur at all in low mass stars (Iben & Renzini 1983).
The transition from O-rich to C-rich thus obviously depends on the mass and metallicity of the parent population. The luminosity at which this transition occurs is predicted by the models and it is therefore of interest to establish the maximum luminosity for the O-rich stars and the minimum for C-rich stars. Within that context it is important to establish the luminosity range over which M, C and S stars are found. Note that it is also possible to get extrinsic C or S stars, when enriched material is deposited onto the surface of another star to give that star the appearance of having undergone dredge-up before it actually does so. This is generally thought to be the explanation for low luminosity S and C stars.
There are nine spectroscopically confirmed M stars in our sample with luminosities in the range mag, all with similar colours mag. There are also seven stars in our sample with S characteristics (S, SC or MS spectral types). Six of these are listed in Table LABEL:agb, the seventh, DK54, is fainter than the TRGB and must therefore be assumed to be extrinsic, as dredge-up is not predicted to occur so low on the AGB. The other six have and mag. None of these M or S stars has colours suggesting significant mass loss and their ranges in bolometric luminosity will be similar to their ranges in luminosity. The mix of spectral types and luminosities among the S stars, e.g. the faintest two are SC type and the brightest two are S type, suggests that these stars cannot be from a single population, but must have a range of masses and/or metallicities. However, Lebzelter et al. (2008) who do a detailed abundance analysis of AGB stars in the intermediate age LMC cluster, NGC 1846, find a similar mixture of luminosity and C/O ratios for the O-rich stars in their study. In view of the fact that NGC 1846 is not expected to have the large spread in ages that Fornax does (although it is probably not a single age population) they suggest this is the result of some of the stars being in low luminosity phases following a shell flash and dredge-up. A similar explanation may contribute to the luminosity spread among the S stars in Fornax.
It seems possible that some of the M stars could be in the foreground and not members of Fornax, and some could be representatives of the younger ( Gyr) Fornax population known to be present. It is highly unlikely that the S stars are anything but members of the Fornax intermediate age population.
There is a carbon star as faint as mag, (F23007 = WEL-C19), which is not in Table LABEL:agb (it is shown in Fig. 4) as it is just fainter than our selection criterion. It may be on the AGB or it may be extrinsic. The rest of the C stars are brighter than mag and there are four with mag, which seems to be the lower luminosity limit for most of the C-stars. This coincides with the predicted lower luminosity limit for the Marigo et al. (2008) model for a population of 2 Gyr and a metallicity of Z=0.0025. Nevertheless, the mix of S and C stars of comparable luminosity suggest we are sampling the AGB of a population spanning a range of mass and/or metallicity.
6 Variable stars
An extensive search for variable stars in Fornax by Bersier & Wood (2002) (hereafter BW) yielded many RR Lyrae stars, anomalous Cepheids and Population II Cepheids, together with 85 candidate long-period variables. We have cross-identified the candidate long-period variables (8 lie outside our survey area) with our catalogue and display the result in Fig. 6. It seems that most stars on the upper AGB, as well as some at the tip of the giant branch are variable. These latter stars are probably very similar to those found by Ita et al. (2002) in the LMC. The variables identified in the present study are listed in Tables 2 and 3. For those in the latter table, it was not possible to derive periods, but the observed peak to valley range is given (). Potential variables were required to have a range of at least 0.1 mag and to show similar behaviour at each epoch in each waveband.
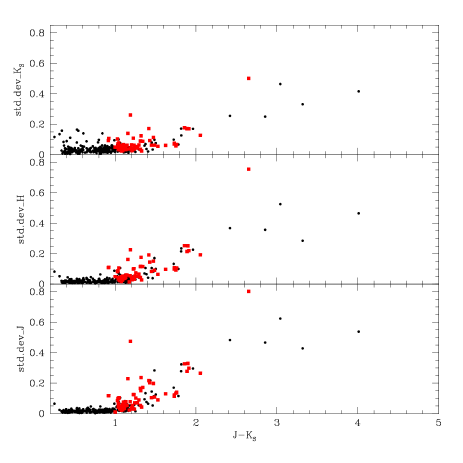
It is worth checking that the stars in common with BW are indeed variable in the infrared. As a first step, we show in Fig. 7 the standard deviation for stars brighter than mag as a function of . Until about mag, the standard deviation is approximately constant, and thereafter increases steadily in all bands indicating variability with increasing amplitude.
7 Long-period Variables
| F | P | Sp | 2MASS | other names | ||||||||
|---|---|---|---|---|---|---|---|---|---|---|---|---|
| (day) | (mag) | |||||||||||
| Miras | ||||||||||||
| 5010 | 215 | 15.19 | 0.62 | 14.11 | 0.54 | 13.62 | 0.56 | 16.98 | –3.72 | - | 02405224–3437230 | BW82 DK23 |
| 11020 | 258 | 17.07 | 1.18 | 15.40 | 0.96 | 14.11 | 0.74 | 17.27 | –3.43 | - | 02391340–3425421 | |
| 1003 | 267 | 15.02 | 0.87 | 13.86 | 0.65 | 13.16 | 0.42 | 16.64 | –4.06 | C | 02400252–3427426 | DK55 S92 BW52 |
| 36008 | 280 | 14.87 | 0.69 | 13.77 | 0.56 | 12.99 | 0.52 | 16.48 | –4.22 | C | 02410355–3448053 | BW83 DDB26 GLM27 M30 |
| 13023 | 350 | 17.09 | 1.28 | 15.33 | 1.24 | 13.63 | 1.02 | 16.30 | –4.40 | C | 02385056–3440319 | (13-23) GLM34 |
| 3099 | 400 | 18.00 | 1.64 | 15.83 | 1.43 | 13.90 | 1.16 | 16.06 | –4.63 | C | 02394160–3435567 | (3-129) |
| 12010 | 470 | 16.01 | 1.44 | 14.31 | 1.14 | 12.91 | 0.96 | 15.95 | –4.75 | C | 02391232–3432450 | (12-4) GLM25 |
| SRs | ||||||||||||
| 4057 | 171 | 15.31 | 0.58 | 14.43 | 0.44 | 13.98 | 0.30 | 17.26 | –3.44 | C | 02401994–3433097 | WEL-C9 S122 DI19 BW72 |
| 22006 | 230 | 15.09 | 0.85 | 14.01 | 0.60 | 13.24 | 0.31 | 16.72 | –3.98 | C | 02405333–3412130 | DDB24 GLM11 |
| 1001 | 235 | 14.78 | 0.47 | 13.81 | 0.38 | 13.30 | 0.27 | 16.66 | –4.04 | C | 02402504–3428583 | S131 DK56 BW74 WEL201 |
| 3005 | 255 | 14.86 | 0.34 | 13.65 | 0.29 | 12.94 | 0.22 | 16.42 | –4.27 | C | 02393738–3436268 | WEL-C1 |
| 3006 | 284 | 14.68 | 0.48 | 13.50 | 0.37 | 12.88 | 0.28 | 16.33 | –4.37 | C | 02394845–3435078 | |
| 4032 | 303 | 14.92 | 0.36 | 13.71 | 0.27 | 13.07 | 0.17 | 16.53 | –4.17 | C | 02400274–3431489 | DK62 BW53 |
| 4025 | 320 | 15.09 | 0.64 | 13.87 | 0.43 | 13.05 | 0.26 | 16.54 | –4.16 | C | 02401016–3433218 | (4-25) WEL-C10 S105 DI20 BW62 |
| SRs+trend | ||||||||||||
| 32007 | 255 | 15.30 | 14.17 | 13.45 | - | 02385309–3449199 | DK8 BW15 | |||||
| 1105 | 340 | 16.24 | 14.85 | 13.61 | C | 02401778–3427357 | GLM21 BW69 | |||||
| 1006 | 375 | 15.24 | 13.85 | 12.82 | C | 02401207–3426255 | WEL-C12 GLM20 | |||||
Table 2 lists the Fourier mean magnitudes for the periodic variables together with the peak-to-peak amplitudes () of the best fitting second-order sine curves (i.e. the period determined from a Fourier analysis plus its first harmonic – this because most of the curves show asymmetries between the rising and falling branches). The light curves of the Miras are illustrated in Fig. 8, from which it is clear that some of the periods are more regular than others. Fig. 8 also shows the 2MASS photometry, which was obtained from observations on JD2451147, about 1000 days before the first of our IRSF measurements. We also attempted to redetermine the periods using the combined data set, but the results were unsatisfactory. The fact that some of the 2MASS points do not lie on the light curves is not in itself surprising. The periods are only good to between 5 and 10 percent so the phase information will not be perfect after a gap of over 1000 days (3 or 4 cycles). In addition, while the periods of most Miras are very stable the light curves do not repeat exactly from one cycle to the next, and erratic changes and long term trends are a feature of C-rich Miras with dust shells (Whitelock et al. 2006). All of the 2MASS measures are good quality with no indication of confusion.

For F12010 we calculated the period and other parameters without the last observation, which is fainter and redder than any of the earlier values. The 2MASS observation, which predates the IRSF ones by over 1300 days, is brighter and bluer than the IRSF observations. These could be manifestations of a long term trend, but it is impossible to be certain without many more observations.
Following Whitelock et al. (2006), who discussed infrared photometry for Galactic carbon stars, we consider Miras to be stars with peak-to-peak amplitudes at in excess of 0.4 mag, and for which periods can be determined. It is on this basis that the stars in Table 2 were divided into Miras and semiregulars (SRs). The total, peak-to-peak variation of the stars described as “SRs+trend” is large, certainly mag, but the pulsation amplitude is relatively low. They are discussed further in section 7.1.
It seems likely that our survey for Mira variables is complete for the area which we covered. The limiting magnitude on the reference frames is greater than 19 mag. An AGB star in Fornax with an extremely thick shell would probably have or redder. At the limiting magnitude this would correspond to mag, well above the limit of about 18 mag. No stars were found on any of the frames that did not have a counterpart on an frame, so it is unlikely that any extreme Mira has been missed. Furthermore, Hinako Fukushi cross identified objects we discuss here with those detected by AKARI (with the IRC camera in 4 bands between 3 and 11 m) in 500 square arcmin of the area we survey. She found nothing beyond the sources detected by the IRSF.
It is, however, likely that there are some Miras outside of the area that we survey. A search for 2MASS sources with over an area with a radius of one degree centred on the Fornax dSph reveals two sources outside our survey area: 02400946–3406256 and 02380618–3431194. Both of these have been observed by Groenewegen et al. (2008), their sources Fornax15 and Fornax31, respectively, and both are carbon stars. These two are very likely to be Miras and there could easily be one or two other Miras in the same region with .
The 2 Gyr isochrone, which passes through most of the variable stars in Fig. 2, is probably reasonably representative of the bulk of the Fornax AGB population. However, the fact that this isochrone passes close to most of the red variables should not be taken to indicate that all the stars in this plot were formed at the same time. Indeed, given the range of ages and metallicities that are known in Fornax, it would be extraordinary if all the large amplitude variables were from the same population. In the case of oxygen-rich Miras it is known that the pulsation period is a function of mass, as well as, at the shorter periods, of metallicity (Feast & Whitelock 2000). One would reasonably expect the carbon Miras to follow parallel trends and the available evidence is consistent with this. Thus the three Magellanic Cloud clusters discussed by Nishida et al. (2000) have ages of about 1.6 Gyr (Mucciarelli et al. 2007a,b; Glatt et al. 2008) and their three carbon Miras have a mean period of 490 days, whilst van Loon et al. (2003) suggest that the cluster KMHK 1603 has an age of 0.9-1.0 Gyr and contains a carbon Mira of period 680 days. The kinematics of Galactic carbon Miras (Feast et al. 2006) is also consistent with a decreasing age with increasing period.
So far as the isochrones are concerned it is worth noting that the sequence of stars in Fig. 2 is not a sequence of increasing period with colour such as might be expected if the Miras were evolving with period along a single evolutionary track (which would be essentially identical to an isochrone for AGB stars which evolve very rapidly). Furthermore a comparison of the bolometric luminosities of the Fornax Miras with the models in diagrams such as the plot of Marigo et al. (their fig. 1) shows that whilst the fainter, shorter period, stars must be amongst the oldest (lowest initial mass) carbon stars allowed by these models, the age of the brighter, longer period carbon Miras cannot be estimated in this way since it depends on which is known very imprecisely if at all.
The pulsation periods that the Marigo et al. (2008) models associate with the AGB variables bear no relation to the values actually found here. However, stars at this stage evolve rapidly and the isochrones provided by the on-line model go from (P=162) to (P=257) in a single step, so it isn’t practical to match them with the detailed observations. In theory one might expect the pulsation period of a Mira to change as the star evolves and loses mass. In practice the observational evidence, discussed in the previous paragraph, suggests that the period of a Mira depends on its initial mass and does not change significantly with time. This is primarily because a star only becomes a Mira briefly (lifetimes are around yr) at the end of its AGB evolution. It remains possible that the Mira will evolve very rapidly through longer periods before completely leaving the AGB, but that has not been established.
The pulsation periods for the Miras in Fornax, and a comparison with Magellanic Cloud clusters mentioned above, suggest ages of a few Gyr for most of them. The short period ones are probably somewhat older and it is possible that the 215 day Mira, F5010, could be significantly older, around 10 Gyr (it is the bluest of the Miras in Fig. 2), but then it would not be expected to be a carbon star. For stars as blue as this one, , the colours do not allow us to distinguish between O- and C-rich stars, so spectral classification for F5010 would be particularly interesting.
In the following discussion the magnitudes and colours of the Fornax variables are transformed to the SAAO system to allow a comparison with data for the Galaxy and the LMC, and also to apply the colour dependent bolometric corrections (Whitelock et al. 2006). We use Carpenter’s (2001) conversion between the 2MASS and SAAO systems, and specifically the expressions given on the web111www.astro.caltech.edu/jmc/2mass/v3/transformations/.
| F | Sp | 2MASS | other names | |||||||
|---|---|---|---|---|---|---|---|---|---|---|
| 28016 | 15.07 | 0.28 | 14.26 | 0.30 | 14.01 | 0.17 | 1.06 | 02381712–3425482 | BW4 S3 DI13 | |
| 30012 | 15.26 | 0.51 | 14.45 | 0.36 | 13.94 | 0.12 | 1.32 | 02382266–3438040 | BW7 DK15 | |
| 29013 | 15.10 | 0.28 | 14.31 | 0.27 | 14.06 | 0.32 | 1.04 | 02384015–3432254 | BW11 S5 | |
| 32004 | 14.91 | 0.56 | 13.80 | 0.37 | 13.16 | 0.19 | 1.75 | C | 02385700–3446340 | BW17 DI28 GLM32 |
| 32010 | 14.86 | 0.46 | 13.97 | 0.33 | 13.64 | 0.22 | 1.22 | C | 02385704–3447489 | DK7 DI29 BW18 |
| 12011 | 14.62 | 0.32 | 13.64 | 0.27 | 13.15 | 0.20 | 1.48 | C | 02385829–3432117 | DK36 BW19 S11 |
| 25006 | 15.23 | 0.94 | 14.23 | 0.57 | 13.74 | 0.25 | 1.49 | 02391532–3415083 | ||
| 2021 | 14.77 | 0.20 | 13.88 | 0.17 | 13.65 | 0.12 | 1.12 | M | 02392292–3428098 | DK38 BW28 S29 |
| 2023 | 14.86 | 0.20 | 14.00 | 0.18 | 13.75 | 0.16 | 1.11 | 02392984–3427232 | BW36 S39 DI14 | |
| 3015 | 14.61 | 0.46 | 13.72 | 0.38 | 13.18 | 0.25 | 1.43 | C | 02393179–3436399 | DK19 |
| 3001 | 14.46 | 0.36 | 13.54 | 0.27 | 13.08 | 0.18 | 1.38 | C | 02393440–3437140 | DK20 |
| 2012 | 15.25 | 0.45 | 14.26 | 0.34 | 13.71 | 0.28 | 1.54 | C | 02393670–3430247 | WEL-C18 |
| 2026 | 14.95 | 0.44 | 14.03 | 0.36 | 13.57 | 0.26 | 1.37 | C | 02393943–3424578 | DK42 |
| 9006 | 14.75 | 0.45 | 13.85 | 0.30 | 13.52 | 0.19 | 1.23 | C | 02393966–3419522 | DK47 BW38 S55 |
| 9005 | 13.93 | 0.44 | 12.92 | 0.38 | 12.42 | 0.29 | 1.50 | C | 02394061–3420148 | DK46 |
| 3028 | 14.58 | 0.26 | 13.71 | 0.18 | 13.31 | 0.14 | 1.27 | C | 02394916–3431239 | DK37 BW44 |
| 3009 | 14.45 | 0.35 | 13.37 | 0.31 | 12.72 | 0.16 | 1.73 | C | 02395186–3433201 | WEL-C5 BW46 S74 |
| 14017 | 15.61 | 0.90 | 14.52 | 0.70 | 13.79 | 0.25 | 1.82 | 02395389–3444028 | ||
| 4020 | 14.45 | 0.13 | 13.57 | 0.08 | 13.25 | 0.08 | 1.19 | C | 02395398–3434244 | WEL-C4 |
| 14006 | 14.71 | 1.00 | 13.59 | 0.76 | 12.78 | 0.43 | 1.93 | C | 02395421–3438368 | GLM24 |
| 2011 | 14.45 | 0.30 | 13.47 | 0.24 | 12.95 | 0.24 | 1.50 | C | 02395520–3425264 | WEL-C13 |
| 4013 | 14.48 | 0.28 | 13.52 | 0.22 | 13.10 | 0.12 | 1.39 | C | 02395837–3436215 | DK22 |
| 8004 | 14.53 | 0.36 | 13.50 | 0.28 | 13.05 | 0.22 | 1.48 | C | 02400093–3422432 | DK44 BW50 S89 |
| 8011 | 14.81 | 0.66 | 13.80 | 0.45 | 13.38 | 0.24 | 1.43 | C | 02400135–3420189 | DK48 BW51 DI7 S90 |
| 4009 | 14.58 | 0.37 | 13.49 | 0.34 | 12.85 | 0.30 | 1.73 | C | 02400538–3432182 | DK61 BW55 S98 |
| 8030 | 15.38 | 0.30 | 14.63 | 0.24 | 14.46 | 0.32 | 0.92 | 02400650–3420131 | BW58 S101 | |
| 1010 | 14.76 | 0.61 | 13.60 | 0.52 | 12.80 | 0.32 | 1.96 | C | 02400666–3423222 | GLM13 DK52 |
| 1017 | 14.74 | 0.19 | 13.83 | 0.14 | 13.55 | 0.11 | 1.19 | 02400819–3426056 | BW59 S103 | |
| 4006 | 14.59 | 0.32 | 13.56 | 0.16 | 13.06 | 0.20 | 1.53 | C | 02400909–3434398 | WEL-C7 BW61 S104 |
| 4028 | 14.74 | 0.35 | 13.79 | 0.28 | 13.39 | 0.21 | 1.34 | C | 02401178–3432455 | DK60 BW64 S108 |
| 1014 | 15.29 | 0.62 | 14.41 | 0.36 | 14.04 | 0.23 | 1.25 | C | 02401224–3430093 | DK59 BW65 S109 |
| 4024 | 14.75 | 0.48 | 13.69 | 0.37 | 13.13 | 0.20 | 1.62 | C | 02401562–3434030 | DK65 BW67 S115 |
| 4018 | 14.86 | 0.18 | 13.85 | 0.11 | 13.39 | 0.10 | 1.46 | C | 02402037–3434548 | WEL-C8 |
| 6013 | 15.12 | 1.00 | 13.94 | 0.75 | 13.16 | 0.51 | 1.96 | C | 02403123–3428441 | (6-13) GLM17 BW75 |
| 5012 | 15.30 | 0.42 | 14.56 | 0.39 | 14.38 | 0.27 | 0.92 | 02404595–3434542 | BW80 DI22 | |
| 5002 | 14.18 | 0.38 | 13.26 | 0.26 | 12.93 | 0.11 | 1.25 | 02404839–3435364 | BW81 S144 | |
| 5016 | 15.52 | 0.58 | 14.80 | 0.34 | 14.50 | 0.26 | 1.02 | 02404870–3430533 | ||
| 18008 | 14.84 | 0.44 | 13.88 | 0.34 | 13.39 | 0.20 | 1.45 | 02410830–3435525 |
7.1 Long Term Trends
Whitelock et al. (2003) identified C-Miras in the LMC which underwent variations on very long time-scales, while Whitelock et al. (2006) identified both Miras and irregular or semi-regular Galactic variables which behaved similarly (see figs. 18 and 19 of Whitelock et al. 2006). They suggested that the phenomenon is similar to that seen among the hydrogen-deficient RCB stars and is the result of the erratic ejection of puffs of dust in random directions. When a puff is ejected into our line of site the star fades, but the pulsation continues. Two dimensional models for dust-driven winds in AGB stars (Woitke 2006) suggest this is a very plausible explanation.

Fig. 9 shows the light curves of the three Fornax C-stars which show a combination of SR variations and long term trend. The figure caption indicate the combination of periods that are used in the illustrated fit. The shorter of the two periods for each star has an amplitude mag, so we would classify them as SR rather than Mira variables. The longer periods will almost certainly not persist and are simply used here as a tool that allows us to model the trend over a relatively short time and see the underlying periodicity.
Figs. 10 show the light curves of three of the largest amplitude variables from Table 3; all are clearly variable. It is possible that F6013, F1010 and F14006, which are all carbon-stars and all rather red (), are Miras or SRs undergoing extremely erratic mass-loss, such as occurs in the very well studied Galactic carbon Mira, R For, from time to time (Whitelock et al. 1997) and if monitored for long enough would show periodicity and light curves more like those of Fig. Fig. 9.
If we are correct in assuming that the Mira, F11020, is faint in the period luminosity (PL) diagram (see section 7.3) because it is undergoing an obscuration event then it is exhibiting the same phenomenon and we can expect it to brighten at some future time as the obscuring dust expands and becomes optically thin.

7.2 Colours
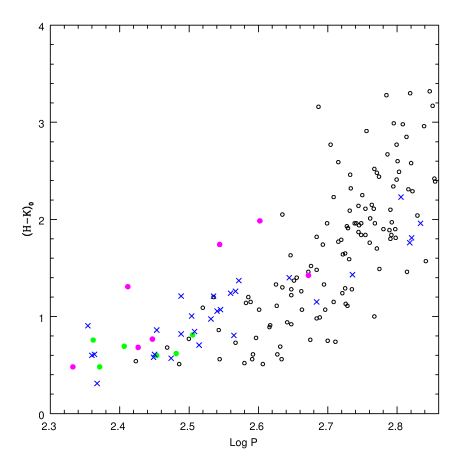
Fig. 11 shows the colour as a function of period for the periodic variables in Fornax. A comparison is provided with the colours of C-rich Miras in the Galaxy (Whitelock et al. 2006) and in the LMC (Feast et al. 1989; Whitelock et al. 2003). While there is a large range of colours at a given period within each galaxy some trends are apparent and the colour-period distribution differs amongst these three galaxies. The LMC stars are, on average, redder than the Galactic ones at short periods and bluer at very long periods (but see below). The Fornax stars are redder than their LMC counterparts at short period; there are no Miras in Fornax with periods above 500 days.
Ita et al. (2004) discuss the characteristics of over 8000 LMC variables with photometry from the SIRIUS camera and periods from OGLE-II. Their on-line data can be used to show that the LMC Miras (selected with mag) overlap the colours of the Galactic sample, so that much of the separation seen in Fig. 11 must be due to the selection effects in the samples studied from the different locations. The three Fornax stars which stand out in Fig. 11 as redder than other stars with the same period range are at the upper envelope of colours of the LMC Miras from the Ita et al. sample, i.e. even with a much larger sample the proportion of very red stars in Fornax is greater than it is in the LMC.
The extreme colours are obviously due to thick dust shells as a consequence of high mass-loss rates. Matsuura et al. (2007) note that two (F13023 and F3099) of these three red stars also have particularly strong acetylene bands at 7.5 m (the third one was not measured) for their colour, indicating strong line blanketing. The longer period Mira (F12010), which has bluer colours, has weaker acetylene absorption, despite having a mass-loss rate that is comparable to the two redder stars. Mass-loss rates among carbon stars are largely independent of metallicity, but strongly dependent on the C/O ratio, as that is what determines the amount of carbon that is free to make dust (e.g. Lagadec & Zijlstra 2008, but see van Loon et al. (2008) for a different view). It may be that some of the differences we observe between the Fornax AGB variables are due to differences in C/O, e.g. because of differences in dredge-up, but considerably more work will be required to clarify this.
7.3 Bolometric Magnitudes and the PL relation
Fig. 12 shows the PL relation for the Fornax periodic variables compared to the PL for C-rich Miras in the LMC, , from Whitelock et al. (2008) on the assumption that the Fornax distance modulus is 20.69 mag (see section 8). Four of the Miras fall well below the LMC PL relation. Fig. 11 shows that the four faint Miras are the reddest and, with the exception of the longest period object, are significantly redder than their LMC counterparts which were used to establish the PL relation. Their colours suggest that circumstellar extinction will affect the luminosity, to an extent that the PL relation will not be useful.
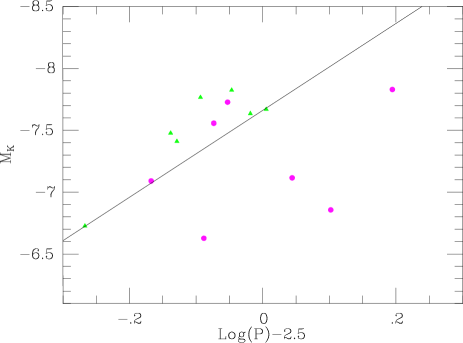
Apparent bolometric magnitudes were calculated using the mean of the bolometric corrections as a function of and (Whitelock et al. 2006 equation 10 and table 5); the results are shown in Table 2, column 9. Various observations, see, e.g. Whitelock et al. (2008), suggest that the same PL relation applies to Miras in very different environments. We therefore use the PL relation for the LMC (equation 1 of the appendix) to find the distance modulus for Fornax. Using the 7 Mira variables, we find mag (internal error). Omitting F11020, which is clearly fainter than the others, we obtain mag (internal error). Fig. 13 shows the PL relation, using the distance modulus just derived from the six Miras. The straight line is equation 1 from the appendix. Note that if the Kato et al. (2007) colour transformations were applied (see section 2) then it would make the distance modulus larger by only 0.01 mag.
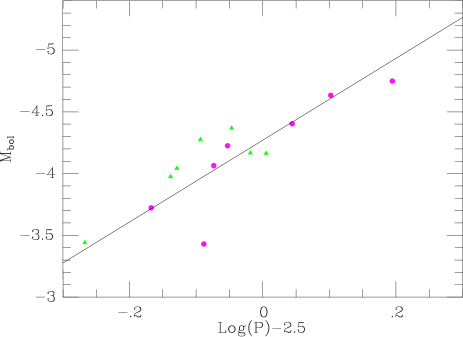
For the absolute error we must take into account the scatter on the PL relation determined in the appendix, , and the uncertainty of the adopted distance to the LMC, (van Leeuwen et al. 2007). Taking these into account the distance to Fornax is mag (or mag, if the faint Mira is included). This is in good agreement with other determinations, discussed below.
It is not certain why F11020 is fainter than the PL relation, but in view of its colour it seems possible that it was experiencing an obscuration event of the kind that is common in C-rich Galactic Miras (see also section 7.1). Whitelock et al. (2006) estimated that at least one third of C-rich Miras in the Galaxy underwent such obscuration events, so it is not surprising that one out of seven Miras in Fornax was caught in the act of ejecting a puff into the line of site.
Matsuura et al. (2007) fit model SEDs to 2MASS data and mid-infrared Spitzer spectra to estimate the bolometric magnitude of several stars in Fornax. The three stars with the strongest mid-infrared emission are the three longest period variables: F13023 (their 13-23), F12010 (their 12-4) and F3099 (their 3-129) for which they determine bolometric magnitudes of, –4.87, –5.49 and –4.92, respectively (after correcting for the differences in our assumed distance modulus) that are significantly brighter than our values. Lagadec et al. (2008)222Lagadec et al. have the two stars 13023 (For1) and 12010 (For2) confused in their table 2. and Groenewegen et al. (2008) found bolometric magnitudes roughly midway between the values from Matsuura et al. and ours of and (for F13023) and and (for F12010), respectively, from the 2MASS magnitudes and the same dependent bolometric correction that we used, so about half the difference between our values and those of Matsuura et al. can be attributed to the bright 2MASS magnitudes. In fact the best agreement is for F3099 where the 2MASS magnitudes are close to our mean values, despite the fact that in this star the mid-infrared provides a significant contribution to the total luminosity. Note that a star with (the value Matsuura et al. found for F12010), would have a period of 740 days if it fell on a period-luminosity relation. There is nothing in the m measurement from Lagadec et al. to suggest extraordinarily strong mid-infrared emission, so we suspect that using the code DUSTY to fit the SED for single epoch observations obtained on widely different dates has led to an unreasonably high total flux for these stars.
Once it is possible to monitor these extreme AGB stars around their light cycles at mid-infrared wavelength we will be able to determine better mean bolometric luminosities for them. That is, however, not critically important for determining distances. For that purpose what is important is to follow the identical procedure for the target stars, in this case the Fornax Miras, and the calibrating stars, in this case the LMC Miras. If that is done, as it has been here, differences in the SED of the target and calibrating stars may be a small problem, but the major source of uncertainty is the distance to the LMC itself.
Fig. 13 also shows the positions of the SR variables on the PL relation and shows that some fall very close the relation defined by the Miras. This is perhaps not surprising given the similarity of C-rich Miras and SRs mentioned above. Those that fall above the PL are probably less evolved and may be pulsating in the first overtone. This can be compared to the situation for LMC variables where SR variables are known to fall on various PL() relations, mostly above that occupied by Miras (Wood 2000; Ita et al. 2004 fig. 1).
8 The Distance to Fornax
The literature contains a large number of estimates of the distance to the Fornax dwarf spheroidal. It is not always straightforward to compare these as they are often based on different or even mutually contradictory assumptions. We therefore reanalyze the major works here and, as far as is possible, put them on the same zero-point so that they may be inter-compared.
Table 4 lists various recent distance estimates made by different methods which can be categorized as follows: (1) the luminosity of the TRGB; (2) the luminosity of the horizontal branch (HB) (including red HB, the RR Lyrae variables (RRs) and RRs in clusters; (3) red clump luminosity; (4) Sct variables. The waveband in which the measurement is made is given in brackets after the abbreviation of the method, e.g. , or .
As discussed in section 3 we find that the TRGB varies from at to mag at mag. These values obviously bracket the mag adopted by Gullieuszik et al. 2007, who quote errors of (random) and (systematic) associated with their value. It would obviously be possible to use our values to determine a distance as did Gullieuszik et al. using an expression from Valenti et al. (2004) that links the TRGB with the metallicity and apply a correction for age. However, without a better indication and what the ranges of age and metallicity actually are we don’t believe that such an estimate will significantly advance our understanding of the distance to Fornax.
The values are quoted in the column labeled “ orig”, as they were listed in the original paper, together with the error given. Many of the standard errors are internal estimates and do not include the uncertainty of the absolute calibration. For the TRGB, Bellazzini (2008) writes “…the Zero Point is known with uncertainties of , in the best case; TRGB distance moduli with error bars smaller than this figure neglect part of the actual error budget”. In the case of the observations, uncertainty in the reddening is important (e.g. Rizzi et al. (2007b) note that their HB modulus is reduced by 0.1 mag if is 0.05 rather than 0.03).
The TRGB moduli (items 1 to 3 in Table 4) and the HB moduli (items 4 to 8 of Table 4) were calibrated by the original workers using some adopted absolute magnitude for the HB or RR Lyrae variables (see notes to Table 4). In the column “ rev” these have all been reduced to a common zero-point based on the apparent magnitudes of RR Lyrae variables in the LMC (Gratton et al. 2003) together with an LMC modulus of 18.39 mag derived by van Leeuwen et al. (2007) using parallaxes of classical Cepheids (see also Feast et al. 2008). Since these estimates are not independent, they are average as indicated in the last column of Table 4 and this mean is given unit weight. The results of the present paper depend on the same LMC modulus together with data on the carbon-rich Miras in the LMC (Whitelock et al. 2008 and section 7.3 above). They are therefore partially independent of items 1 to 8 in zero-point and are treated separately. The results for the red clump and for Scuti stars depend on parallaxes of local stars of these types (see notes to Table 4) and are taken directly from the original sources. Each of the various methods in Table 4 has its own assumptions and uncertainties. Our final result depends on the mean of the four estimates in heavy type in the last column of table 4. This is 20.69 mag with a range of 20.58 to 20.78. If the TRGB and HB were each given unit weight the mean result would be 20.67 mag. Given the various uncertainties this is not significantly different from our adopted value. Further improvement in the Fornax modulus will come both from improvements in basic calibrations and in greater understanding of the corrections necessary in at least some of the cases for age and metallicity effects.
| No. | Reference | Method | orig | rev | Means |
|---|---|---|---|---|---|
| 1 | Gullieuszik et al. (2007) | TRGB() | 20.59 | ||
| 2 | Rizzi et al. (2007a) | TRGB() | 20.55 | ||
| 3 | Rizzi et al. (2007b) | TRGB() | 20.57 | ||
| Mean methods using the TRGB (1, 2 and 3) | 20.57 | ||||
| 4 | Savianne et al. (2000) | red HB() | 20.66 | ||
| 5 | Greco et al. (2005) | RRs() | 20.54 | ||
| 6 | Rizzi et al. (2007b) | HB() | 20.6 | ||
| 7 | Greco et al. (2007) | cluster RRs() | 20.55 | ||
| 8 | Mackey & Gilmore (2003) | cluster RRs() | 20.56 | ||
| Mean of methods using the HB (4, 5, 6, 7, 8) | 20.59 | ||||
| Mean of methods using the HB and TRGB | 20.58 | ||||
| 9 | Pietrzynski et al. (2003) | RC() | 20.86 | ||
| 10 | Gullieuszik et al. (2007) | RC() | 20.74 | ||
| 11 | Rizzi et al. (2007b) | RC() | 20.73 | ||
| Mean of methods using the RC (9, 10, 11) | 20.78 | ||||
| 12 | Poretti et al. (2008) | Sct | 20.70 | ||
| Method using Sct stars (12) | 20.70 | ||||
| 13 | This paper | Mira PL | |||
| Method using Mira PL (13) | 20.69 | ||||
| Mean of 4 different methods: | 20.69 | ||||
Acknowledgments
We are grateful to the following people for acquiring images for this programme: Enrico Olivier, Hirofumi Hatano, Shogo Nishiyama, Hideyuki Shimizu. We also thank Martin Groenewegen and colleagues for sending us their paper in advance of publication, Hinako Fukushi for providing information on sources detected by AKARI and the referee, Jacco van Loon for some helpful suggestions.
This research has made use of Aladin. This publication makes use of data products from the Two Micron All Sky Survey, which is a joint project of the University of Massachusetts and the Infrared Processing and Analysis Center/California Institute of Technology, funded by the National Aeronautics and Space Administration and the National Science Foundation.
References
- [] Alves D. R., 2000, ApJ, 539, 732
- [] Battaglia G., et al., 2006, A&A, 459, 423
- [] Bellazzini M., 2008, Mem. S.A.It., 79, 440
- [] Bersier D., Wood P. R., 2002, AJ, 123, 840
- [] Bressan A., Granato G. L., & Silva L., 1998, A&A, 332, 135
- [] Buonanno R., Buonanno R., Corsi C. E., Castellani M., Marconi G., Fusi Pecci F., Zinn R., 1999, AJ, 118, 1671
- [] Carpenter J. M., 2001, AJ, 121, 2851
- [] Carretta E., Gratton R. G., Clementini G., Fusi Pecci F., 2000, ApJ, 533, 215
- [] Coleman M., Da Costa G. S., Bland-Hawthorn J., Martínez-Delgado D., Freeman K. C., Malin, D., 2004, AJ, 127, 832
- [] Coleman M., de Jong J. T. A., 2008, ApJ, 685, 933
- [] Cutri R. M., et al., 2003, University of Massachusetts and Infrared Processing and Analysis Center (IPAC/California Institute of Technology), 2MASS
- [] Demers S., Irwin M. J., 1987, MNRAS, 226, 943
- [] Demers S., Kunkel W. E., 1979, PASP, 91, 761
- [] Demers S., Dallaire M., Battinelli P., 2002, ApJ, 123, 3428
- [] Feast M. W., Glass I. S., Whitelock P. A., Catchpole R. M., 1989, MNRAS, 241, 375
- [] Feast M. W., Whitelock P. A., MNRAS, 2000, 317, 460
- [] Feast M. W., Whitelock P. A., Menzies J. W., MNRAS, 2006, 369, 791
- [] Feast M. W., Laney C. D., Kinman, T. D., van Leeuwen F., Whitelock P. A., 2008, MNRAS, 386, 211
- [] Ferraro F. R., Messineo M., Fusi Pecci F., de Palo M. A., Straniero O., Chieffi A., Limongi M., 1999, AJ, 118, 1738
- [] Gallart C., Aparicio A., Zinn R., Buonanno R., Hardy E., Marconi G., 2005 in (eds.) Jerjen H., Binggeli B., Near-fields cosmology with dwarf elliptical galaxies, IAU Coll., 198, 25, CUP
- [] Glass I. S., Lloyd Evans T., 2003, MNRAS, 343, 67
- [] Glass I. S., Whitelock P. A., Catchpole R. M., Feast M. W., Laney C. D., 1990, SAAO Circ., 14, 63
- [] Glatt K., et al., 2008, AJ, 136, 1703
- [] Gratton R. G., Bragaglia A., Carretta E., Clementini G., Desidera S., Grundahl F., Lucatello S., 2003, A&A, 408, 529
- [] Greco C., et al., 2005, astro-ph/0507244
- [] Greco C., et al., 2007, ApJ, 670, 332
- [] Groenewegen M. A. T., 2006, A&A, 448, 181
- [] Groenewegen M. A. T., Lançon A., Marescaux M., 2008, submitted to A&A
- [] Gullieuszik M., Held E. V., Rizzi L., Saviane I., Momany, Y., Ortolani S., 2007, A&A, 467, 1025
- [] Gullieuszik M., Held E. V., Rizzi L., Girardi L., Marigo P., Momany Y., 2008, MNRAS, 388, 1185
- [] Hodge P., 1961, AJ, 66, 83
- [] Iben I., Renzini A., 1983, ARAA, 21 271
- [] Irwin M., Hatzidimitriou D., 1993, in: eds. G. S. Smith & J. P. Brodie, The Globular Cluster-Galaxy Connection, ASP Conf. Ser., 48, 322
- [] Ita Y., et al., 2002, MNRAS, 337, 31
- [] Ita Y., et al., 2004, MNRAS, 353, 705
- [] Kato D., et al., 2007, PASJ, 59, 615
- [] Lagadec E., Zijlstra A. A., 2008, MNRAS, 390, L59
- [] Lagadec E., Zijlstra A. A., Matsuura, M., Menzies J. W., van Loon J. Th., Whitelock P. A., 2008, MNRAS, 383, 399
- [] Lebzelter T., Lederer M. T., Cristallo S., Hinkle K. H., Straniero O., Aringer B., 2008, A&A, 486, 511
- [] Letarte B., Hill V., Jablonka P., Tolstoy E., François P., Meylan G., 2006, A&A, 453, 547
- [] Lundgren K., 1990, A&A, 233, 21
- [] Mackey A. D., Gilmore G. F., 2003, MNRAS, 345, 747
- [] McNamara D. H., Clementini G., Marconi. M., 2007, AJ, 133, 2752
- [] Marigo P., Giradi L., Bressan A., Groenewegen M. A. T., Silva L., Granato G. L., 2008, A&A, 482, 883
- [] Matsuura M., et al., 2007, MNRAS, 382, 1889
- [] Mauron N., Azzopardi M., Gigoyan K., Kendall T. R., 2004, A&A, 418, 77
- [] Menzies J., Feast M., Tanabé T., Whitelock P., Nakada Y., 2002, MNRAS, 335, 923
- [] Menzies J., Feast M., Whitelock P., Olivier E., Matsunaga N., da Costa G., 2008, MNRAS, 385, 1045
- [] Mucciarelli A., Ferraro F. R., Origlia L., Fusi Pecci F., 2007a, AJ, 133, 2053
- [] Mucciarelli A., Origlia L., Ferraro F. R., 2007b, AJ, 134, 1813
- [] Morris R. A. H., et al., 2007, A&A, 476, 59
- [] Nishida S., Tanabé T., Nakada Y., Matsumoto S., Sekiguchi K., Glass I. S., 2000, MNRAS, 313, 136
- [] Olszewski E. W., Mateo M., Harris J., Walker M. G., Coleman M. G., Da Costa G. S., 2006, AJ, 131, 912
- [] Pietrzyński G., Gieren W., Udalski A., 2003, AJ, 125, 2494
- [] Poretti E., et al., 2008, ApJ, 685, 947
- [] Rizzi L., Tully R. B., Makarov D., Makarova L., Dolphin A. E., Sakai S., Shaya E. J., 2007a, ApJ, 661, 815
- [] Rizzi L., Held E. V., Saviane I., Tully R. B., Gullieuszik M., 2007b, MNRAS, 380, 1255
- [] Schechter P. L., Mateo M., Saha A., 1993, PASP, 105, 1342
- [] Saviane I., Held E. V., Bertelli G., 2000, A&A, 355, 56
- [] Stetson P. B., Hesser J. E., Smecker-Hane T. A., 1998, PASP, 110, 533
- [] Valenti E., Ferraro F. R., Origlia L., 2004, MNRAS, 351 1204
- [] van den Bergh S., 2000, Galaxies of the Local Group, CUP
- [] van Leeuwen F., 2007, Hipparcos, the New Reduction of the Raw Data, Springer ASSL
- [] van Leeuwen F., Feast M. W., Whitelock P. A., Laney C. D., 2007, MNRAS, 379, 723
- [] van Loon J. Th., et al., 2008, A&A, 487, 1055
- [] van Loon J. Th., Marshall J. R., Matsuura M., Zijlstra A. A., 2003, MNRAS, 341, 1205
- [] Westerlund B. E., Edvardsson B., Lundgren K., 1987, A&A, 178, 41
- [] Whitelock P. A., Feast M. W., Marang F., Overbeek M. D., 1997, MNRAS, 288, 512
- [] Whitelock P. A., Feast M. W., van Loon J. Th., Zijlstra A. A., 2003, MNRAS, 342, 86
- [] Whitelock P. A., Feast M. W., Marang F., Groenewegen M. A. T., 2006 MNRAS 369, 751
- [] Whitelock P. A., Feast M. W., van Leeuwen F., 2008, MNRAS, 386, 313
- [] Woitke P., 2006, A&A, 452, 537
- [] Wood P., 2000, Publ. Astron. Soc. Aust., 17, 18
9 Appendix: LMC PL
In this paper we make use of bolometric magnitudes derived by applying a and a dependent bolometric correction (Whitelock et al. 2006 equation 10) to the mean mag. In order to use these with a PL relation we re-derive the LMC PL relation using bolometric magnitudes derived in the same way.
For this we use only C-rich Mira variables taking the data from Feast et al. (1989), revised according to the periods and classifications given by Glass & Lloyd Evans (2003)333for GRV0519–6454 the period from Glass et al. (1990) is used. together with the 5 C-Miras from Whitelock et al. (2003) which have sufficiently good mags to derive the bolometric correction. The Feast et al. data were converted onto the SAAO system (Carter 1990). Interstellar extinction was corrected for as described by Feast et al. (1989).
If we take mag for the LMC, then fitting a PL relation to these 22 points provides the following:
| (1) |
neglecting the error on the distance modulus of the LMC. The rms scatter about this relation is 0.12 mag. Compared with equation 1 of Whitelock et al. (2006), after correcting to the same LMC distance, this new relation will provide bolometric magnitudes that are 0.18 mag fainter at and 0.05 mag brighter at .