Observation of ferromagnetic resonance in strontium ruthenate (SrRuO3)
Abstract
We report the observation of ferromagnetic resonance (FMR) in SrRuO3 using the time-resolved magneto-optical Kerr effect. The FMR oscillations in the time-domain appear in response to a sudden, optically induced change in the direction of easy-axis anistropy. The high FMR frequency, 250 GHz, and large Gilbert damping parameter, 1, are consistent with strong spin-orbit coupling. We find that the parameters associated with the magnetization dynamics, including , have a non-monotonic temperature dependence, suggestive of a link to the anomalous Hall effect.
pacs:
76.50.+g, 78.47.-p, 75.30.-mUnderstanding and eventually manipulating the electron’s spin degree of freedom is a major goal of contemporary condensed matter physics. As a means to this end, considerable attention is focused on the spin-orbit (SO) interaction, which provides a mechanism for control of spin polarization by applied currents or electric fields Ẑutić et al. (2004). Despite this attention, many aspects of SO coupling are not fully understood, particularly in itinerant ferromagnets where the same electrons are linked to both rapid current fluctuations and slow spin dynamics. In these materials, SO coupling is responsible for spin-wave damping Kamberský (1970); Korenman and Prange (1972), spin-current torque Slonczewski (1996); Berger (1996), the anomalous Hall effect (AHE) Luttinger and Karplus (1954), and magnetocrystalline anisotropy (MCA) Brooks (1940). Ongoing research is aimed toward a quantitative understanding of how bandstructure, disorder, and electron-electron interactions interact to determine the size and temperature dependence of these SO-driven effects.
SrRuO3 (SRO) is a material well known for its dual role as a highly correlated metal and an itinerant ferromagnet with properties that reflect strong SO interaction Klein et al. (1996); Kostic et al. (1998); Marshall et al. (1999). Despite its importance as a model SO-coupled system, there are no previous reports of ferromagnetic resonance (FMR) in SRO. FMR is a powerful probe of SO coupling in ferromagnets, providing a means to measure both MCA and the damping of spin waves in the small wavevector regime Heinrich and Cochran (1993). Here we describe detection of FMR by time-resolved magnetooptic measurements performed on high-quality SRO thin films. We observe a well-defined resonance at a frequency = 250 GHz. This resonant frequency is an order of magnitude higher than in the transition metal ferromagnets, which accounts for the nonobservation by conventional microwave techniques.
10-200 nm thick SRO thin films were grown via pulsed laser deposition between 680-700∘C in 100 mTorr oxygen. High-pressure reflection high-energy electron diffraction (RHEED) was used to monitor the growth of the SRO film in-situ. By monitoring RHEED oscillations, SRO growth was determined to proceed initially in a layer-by-layer mode before transitioning to a step-flow mode. RHEED patterns and atomic force microscopy imaging confirmed the presence of pristine surfaces consisting of atomically flat terraces separated by a single unit cell step ( 3.93 Å). X-ray diffraction indicated fully epitaxial films and x-ray reflectometry was used to verify film thickness. Bulk magnetization measurements using a SQUID magnetometer indicated a Curie temperature, TC, of 150K.
Sensitive detection of FMR by the time-resolved magnetooptic Kerr effect (TRMOKE) has been demonstrated previously Hiebert et al. (1997); Acremann et al. (2000); van Kampen et al. (2002). TRMOKE is an all optical pump-probe technique in which the absorption of an ultrashort laser pulse perturbs the magnetization, M, of a ferromagnet. The subsequent time-evolution of M is determined from the polarization state of a normally incident, time-delayed probe beam that is reflected from the photoexcited region. The rotation angle of the probe polarization caused by absorption of the pump, , is proportional to , where is the direction perpendicular to the plane of the film Shinagawa (2000).
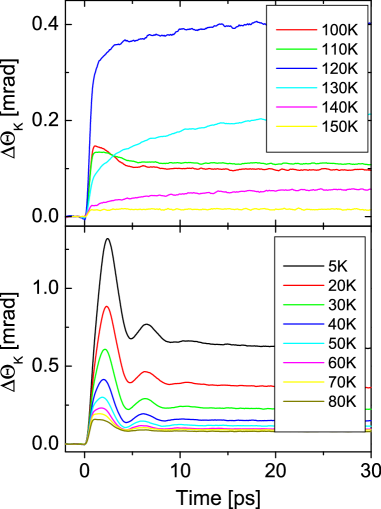
Figs. 1a and 1b show obtained on an SRO film of thickness 200 nm. Very similar results are obtained in films with thickness down to 10 nm. Two distinct types of dynamics are observed, depending on the temperature regime. The curves in Fig. 1a were measured at temperatures near TC. The relatively slow dynamics agree with previous reports for this T regime Ogasawara et al. (2005) and are consistent with critical slowing down in the neighborhood of the transition Kise et al. (2000). The amplitude of the photoinduced change in magnetization has a local maximum near T=115 K. Distinctly different magnetization dynamics are observed as T is reduced below about 80 K, as shown in Fig. 1b. The TRMOKE signal increases again, and damped oscillations with a period of about 4 ps become clearly resolved.
In order to test if these oscillations are in fact the signature of FMR, as opposed to another photoinduced periodic phenomenon such as strain waves, we measured the effect of magnetic field on the TRMOKE signals. Fig. 2a shows for several fields up to 6 T applied normal to the film plane. The frequency clearly increases with increasing magnetic field, confirming that the oscillations are associated with FMR.
The mechanism for the appearance of FMR in TRMOKE experiments is well understood van Kampen et al. (2002). Before photoexcitation, M is oriented parallel to hA. Perturbation of the system by the pump pulse (by local heating for example) generates a sudden change in the direction of the easy axis. In the resulting nonequilibrium state, M and hA are no longer parallel, generating a torque that induces M to precess at the FMR frequency. In the presence of Gilbert damping, M spirals towards the new hA, resulting in the damped oscillations of that appear in the TRMOKE signal.
To analyze the FMR further we Fourier transform (FT) the time-domain data and attempt to extract the real and imaginary parts of the transverse susceptibility, . The magnetization in the time-domain is given by the relation,
| (1) |
where is the impulse response function and is the change in anisotropy field. If is proportional to the -function, is proportional and the FT of the TRMOKE signal yields directly. However, for laser-induced precession one expects that will be more like the step function than the impulse function, as photoinduced local heating can be quite rapid compared with cooling via thermal conduction from the laser-excited region. When is proportional to the step function, is proportional to the FT of the time derivative of , rather than itself. In this case, the observable should be closely related to the real, or dissipative part of .
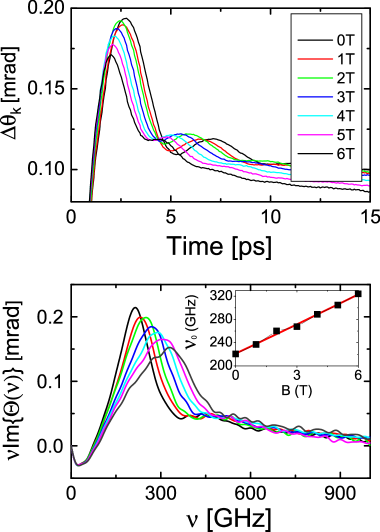
In Fig. 2b we plot for each of the curves shown in Fig. 2a. The spectra shown in Fig. 2b do indeed exhibit features that are expected for Re near the FMR frequency. A well-defined resonance peak is evident, whose frequency increases with magnetic field as expected for FMR. The inset to Fig. 2b shows as a function of applied magnetic field. The solid line through the data points is a fit obtained with parameters 7.2 T and easy axis direction equal to 22 degrees from the film normal. These parameter values agree well with previous estimates based on equilibrium magnetization measurements Klein et al. (1996); Marshall et al. (1999).
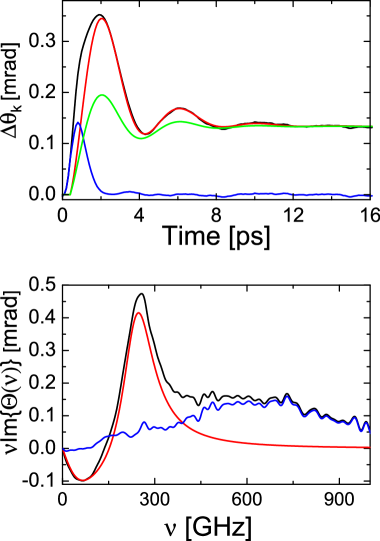
Although the spectra in Fig. 2b are clearly associated with FMR, the sign change at low frequency is not consistent with Re , which is positive definite. We have verified that the negative component is always present in the spectra and is not associated with errors in assigning the =0 point in the time-domain data. The origin of negative component of the FT is made clearer by referring back to the time domain. In Fig. 3a we show typical time-series data measured in zero field at 5 K. For comparison we show the response to a step function change in the easy axis direction predicted by the Landau-Lifschitz-Gilbert (LLG) equations Brown (1963). It is clear that, if the measured and simulated responses are constrained to be equal at large delay times, the observed is much larger than the LLG prediction at small delay.
We have found that can be readily fit by LLG dynamics if we relax the assumption that is a step-function, in particular by allowing the change in easy axis direction to ”overshoot” at short times. The overshoot suggests that the easy-axis direction changes rapidly as the photoexcited electrons approach quasiequilibrium with the phonon and magnon degrees of freedom. The red line in Fig. 3a shows the best fit obtained by modeling by ), where is the step function, is the change in easy-axis direction at , and is the time constant determining the rate of approach to the asymptotic value . The fit is clearly much better when the possibility of overshoot dynamics in is included. The blue line shows the difference between measured and simulated response. With the exception of this very short pulse centered near =0, the observed response is now well described by LLG dynamics. In principle, an alternate explanation for the discrepancy with the step-function assumption would be to consider possible changes in the magnitude as well as direction of M. However, we have found that fitting the data then requires to be larger at ps than , a photoinduced increase that is unphysical for a system in a stable FM phase.
In Fig. 3b we compare data and simulated response in the frequency domain. With the allowance for an overshoot in the spectrum clearly resolves into two components. The peak at 250 GHz and the sign change at low frequency are the both part of the LLG response to . The broad peak or shoulder centered near 600 GHz is the FT of the short pulse component shown in Fig. 3a. We have found this component is essentially linear in pump pulse intensity, and independent of magnetic field and temperature - observations that clearly distinguish it from the FMR response. Its properties are consistent with a photoinduced change in reflectivity due to band-filling, which is well-known to cross-couple into the TRMOKE signal of ferromagnets Koopmans et al. (2000).
By including overshoot dynamics in , we are able to distinguish stimulus from response in the observed TRMOKE signals. Assuming LLG dynamics, we can extract the two parameters that describe the response: and ; and the two parameters that describe the stimulus: and . In Fig. 4 we plot all four parameters as a function of temperature from 5 to 80 K. The T-dependence of the FMR frequency is very weak, with deviating from 250 GHz by only about 5 over the range of the measurement. The Gilbert damping parameter is of order unity at all temperatures, a value that is approximately a factor larger than found in transition metal ferromagnets. Over the same T range the decay of the easy axis overshoot varies from about 2 to 4 ps. We note that the dynamical processes that characterize the response all occur in strongly overlapping time scales, that is the period and damping time of the FMR, and the decay time of the hA overshoot, are each in the 2-5 ps range.
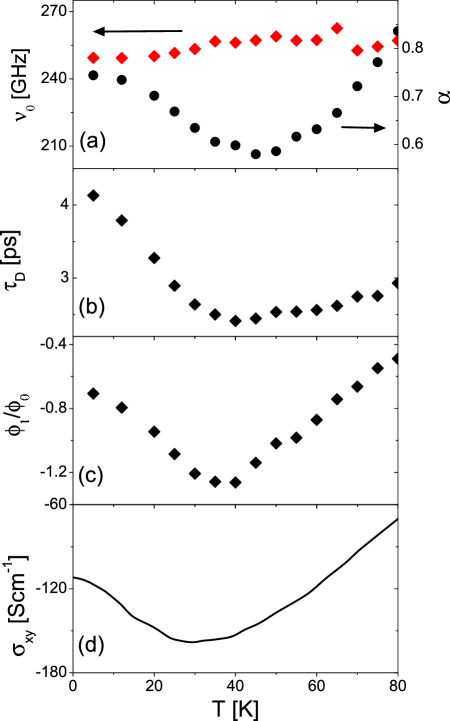
While is essentially independent of T, the parameters , and exhibit structure in their T-dependence near 40 K. This structure is reminiscent of the T-dependence of the anomalous Hall coefficient that has been observed in thin films of SRO Klein et al. (2000); Fang et al. (2003); Mathieu et al. (2004). For comparison, Fig. 4d reproduces reported in Ref. Mathieu et al. (2004) The similarity between the T-dependence of AHE and parameters related to FMR suggests a correlation between the two types of response functions. Recently Nagaosa and Ono Onoda et al. (2008) have discussed the possibility of a close connection between collective spin dynamics at zero wavevector (FMR) and the off-diagonal conductivity (AHE). At a basic level, both effects are nonzero only in the presence of both SO coupling and time-reversal breaking. However, the possibility of a more quantitative connection is suggested by comparison of the Kubo formulas for the two corresponding functions. The off-diagonal conductivity can be written in the form Onoda and Nagaosa (2002),
| (2) |
where is current matrix element between quasiparticle states with band indices and wavevector . The functions and are the energy and occupation difference, respectively, between such states, and is a phenomenological quasiparticle damping rate. FMR is related to the imaginary part of the uniform tranverse susceptibility, with the corresponding Kubo form,
| (3) |
where is the matrix element of the spin operator. In general, and are unrelated, as they involve current and spin matrix elements respectively. However, it has been proposed that in several ferromagnets, including SRO, the k-space sums in Eqs. 2 and 3 are dominated by a small number of band-crossings near the Fermi surface Fang et al. (2003); Wang et al. (2006). If the matrix elements and vary sufficiently smoothly with k, then and may be closely related, with both properties determined by the position of the chemical potential relative to the energy at which the bands cross. Furthermore, as Gilbert damping is related to the zero-frequency limit of , i.e.,
| (4) |
and AHE is the zero-frequency limit of , the band-crossing picture implies a strong correlation between and .
In conclusion, we have reported the observation of FMR in the metallic transition-metal oxide SrRuO3. Both the frequency and damping coefficient are significantly larger than observed in transition metal ferromagnets. Correlations between FMR dynamics and the AHE coefficient suggest that both may be linked to near Fermi surface band-crossings. Further study of these correlations, as Sr is replaced by Ca, or with systematic variation in residual resistance, could be a fruitful approach to understanding the dynamics of magnetization in the presence of strong SO interaction.
Acknowledgements.
This research is supported by the US Department of Energy, Office of Science, under contract No. DE-AC02-05CH1123. Y.H.C. would also like to acknowledge the support of the National Science Council, R.O.C., under Contract No. NSC 97-3114-M-009-001.References
- Ẑutić et al. (2004) I. Ẑutić, J. Fabian, and S. Das Sarma, Rev. Mod. Phys. 76, 323 (2004).
- Korenman and Prange (1972) V. Korenman and R. E. Prange, Phys. Rev. B 6, 2769 (1972).
- Kamberský (1970) V. Kamberský, Can. J. Phys. 48, 2906 (1970).
- Slonczewski (1996) J. C. Slonczewski, J. Magn. Magn. Mater. 159, L1 (1996).
- Berger (1996) L. Berger, Phys. Rev. B 54, 9353 (1996).
- Luttinger and Karplus (1954) J. M. Luttinger and R. Karplus, Phys. Rev. 94, 782 (1954).
- Brooks (1940) H. Brooks, Phys. Rev. 58, 909 (1940).
- Klein et al. (1996) L. Klein, J. S. Dodge, C. H. Ahn, J. W. Reiner, L. Mieville, T. H. Geballe, M. R. Beasley, and A. Kapitulnik, J. Phys. Cond.-Matt. 8, 10111 (1996).
- Kostic et al. (1998) P. Kostic, Y. Okada, N. C. Collins, Z. Schlesinger, J. W. Reiner, L. Klein, A. Kapitulnik, T. H. Geballe, and M. R. Beasley, Phys. Rev. Lett. 81, 2498 (1998).
- Marshall et al. (1999) A. F. Marshall, L. Klein, J. S. Dodge, C. H. Ahn, J. W. Reiner, L. Mieville, L. Antagonazza, A. Kapitulnik, T. H. Geballe, and M. R. Beasley, J. Appl. Phys. 85, 4131 (1999).
- Heinrich and Cochran (1993) B. Heinrich and J. F. Cochran, Adv. Phys. 42, 523 (1993).
- Hiebert et al. (1997) W. K. Hiebert, A. Stankiewicz, and M. R. Freeman, Phys. Rev. Lett. 79, 1134 (1997).
- Acremann et al. (2000) Y. Acremann, C. H. Back, M. Buess, O. Portmann, A. Vaterlaus, D. Pescia, and H. Melchior, Science 290, 492 (2000).
- van Kampen et al. (2002) M. van Kampen, C. Jozsa, J. T. Kohlhepp, P. LeClair, L. Lagae, W. J. M. de Jonge, and B. Koopmans, Phys. Rev. Lett. 88, 227201 (2002).
- Shinagawa (2000) K. Shinagawa, in Magneto-optics, edited by S. Sugano and N. Kojima (Springer-Verlag, Berlin, Germany, 2000).
- Ogasawara et al. (2005) T. Ogasawara, K. Ohgushi, Y. Tomioka, K. S. Takahashi, H. Okamoto, M. Kawasaki, and Y. Tokura, Phys. Rev. Lett. 94, 087202 (2005).
- Kise et al. (2000) T. Kise, T. Ogasawara, M. Ashida, Y. Tomioka, Y. Tokura, and M. Kuwata-Gonokami, Phys. Rev. Lett. 85, 1986 (2000).
- Brown (1963) W. F. Brown, Micromagnetics (Krieger, 1963).
- Koopmans et al. (2000) B. Koopmans, M. van Kampen, J. T. Kohlhepp, and W. J. M. de Jonge, Phys. Rev. Lett. 85, 844 (2000).
- Mathieu et al. (2004) R. Mathieu, A. Asamitsu, H. Yamada, K. S. Takahashi, M. Kawasaki, Z. Fang, N. Nagaosa, and Y. Tokura, Phys. Rev. Lett. 93, 016602 (2004).
- Klein et al. (2000) L. Klein, J. R. Reiner, T. H. Geballe, M. R. Beasley, and A. Kapitulnik, Phys. Rev. B 61, R7842 (2000).
- Fang et al. (2003) Z. Fang, N. Nagaosa, K. Takahashi, A. Asamitsu, R. Mathieu, T. Ogasawara, H. Yamada, M. Kawasaki, Y. Tokura, and K. Terakura, Science 302, 92 (2003).
- Onoda et al. (2008) M. Onoda, A. S. Mishchenko, and N. Nagaosa, J. Phys. Soc. Jap. 77, 013702 (2008).
- Onoda and Nagaosa (2002) M. Onoda and N. Nagaosa, J. Phys. Soc. Jap. 71, 19 (2002).
- Wang et al. (2006) X. Wang, J. R. Yates, I. Souza, and D. Vanderbilt, Phys. Rev. B. 74, 195118 (2006).