Non-equilibrium phase transitions in tubulation by molecular motors
Abstract
The extraction of membrane tubes by molecular motors is known to play an important role for the transport properties of eukaryotic cells. By studying a generic class of models for the tube extraction, we discover a rich phase diagram. In particular we show that the density of motors along the tube can exhibit shocks, inverse shocks and plateaux, depending on parameters which could in principle be probed experimentally. In addition the phase diagram exhibits interesting reentrant behavior.
pacs:
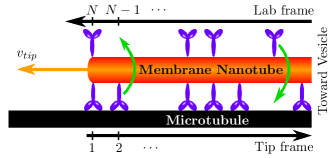
87.16.A-, 05.40.-a,87.16.Nn,64.60.-iMolecular motors play a fundamental role in intracellular traffic Howard2001 , being responsible for the transport of vesicles and the extraction of membrane nanotubes Roux2002 . The latter phenomenon is of particular interest as it requires a cooperative effort between many motors. This remarkable collective behaviour has been demonstrated in vitro only very recently Roux2002 , triggering much interest in the features of the “tubulation”, with a particular focus on the dynamics of the tip region. Objects of study include the conditions for the formation of tubes, their velocities, the load exerted on and by the motors, the distribution of motors along the tube and the role of processivity Roux2002 ; Leduc2004 ; Campas2006 ; SIKSSD2008 . In vitro, a tube can be created when a vesicle coated with kinesins is brought near a microtubule Roux2002 . It is generally believed Leduc2004 that two regimes are then observed depending on the motor density: below a critical density, the motors which bind to the microtubule are not able to extract a tube; above the critical density tubulation occurs and the motors pull a tube out of the vesicle, at steady velocity. During this process motors constantly bind and unbind from the microtubule, while remaining bound to the membrane (see figure 1). In this regime, the density of motors is predicted to be flat, with some structure near the tip region Leduc2004 . The critical density and the velocity of the tube have been shown to be very sensitive to details of the tip region, such as the number of motors clustered there and their coordination Campas2008 .
In this work, on the other hand, we focus on the regime where tubulation is established and study the collective behaviour of motors in the bulk of the system. We consider a generic model of two coupled lattices representing bound and unbound motors. By accounting for excluded volume interactions, neglected in Leduc2004 , we discover a richer phase diagram than previously expected. The tubulation regime now divides into two different phases with re-entrant transitions between them. Both phases could in principle be accessible to experiment by control of the vesicle density. As we show, the phase diagram is governed by the bulk dynamics and the effective tip velocity; it is thus insensitive to the precise details of the dynamics of the tip region.
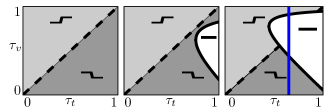
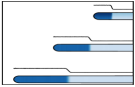
We first describe the phenomenology predicted by our study. The motor density profile comprises two plateaux emerging from the tip of the tube and the vesicle, respectively. These plateaux meet in the bulk of the system which leads to a discontinuity – a kink – in the density profile. The system can be in two different phases, illustrated in figure 2: (i) a kink phase, in which the tip density is either larger or smaller than that of the vesicle, the two plateaux being connected accordingly by a shock or an inverse shock in the bulk of the system, and (ii) a tip phase where the kink travels toward the vesicle and localizes in its viscinity, thus yielding a constant density profile corresponding to the tip density. Apart from a carefully chosen set of parameters, the kink is never at rest, always travelling away from the tip of the tube and either toward (tip phase) or away from the vesicle (kink phase). In the latter case, the kink moves away from both boundaries, which is possible because the tube is extending. The transition between the two different phases, and also the transition from ’shock’ profile to ’inverse-shock’ profiles within the kink phase, can be triggered, for instance, by changing the value of the vesicle’s density (see the phase diagrams in figure 2). Furthermore, the phase diagram is re-entrant: by continuously increasing the vesicle’s density, one can go from the kink phase to the tip phase and back again into the kink phase.
In non-equilibrium statistical physics, shocks play an important role for driven lattice gas models BE07 but the phenomenology described here differs from previously studied biophysical traffic problems LW55 ; reentrance is unusual and previously observed inverse shocks required slow particles, static defects or special current-density relations E95 .
Definition of the model. The microscopic details of the model are as follows (see figure 3). We consider two coupled one-dimensional lattices, for bound and unbound motors, which extend from the vesicle to the tip of the tube. A motor bound to the microtubule steps toward the tip of the tube at rate , provided the arrival site is empty. Each site of the unbound motor lattice accounts for a whole perimeter of the tube, which in experiments exceeds 100 nm Roux2002 and can contain many motors. For sake of clarity we thus neglect the exclusion on this lattice and assume that unbound motors diffuse freely at rate . Partial exclusion could be taken into account: for realistic values of the parameters (see below), it does not modify qualitatively the phase diagram and just obscures the algebra LongVersion . Finally, motors attach at rate to an empty site and detach at rate from the microtubule.
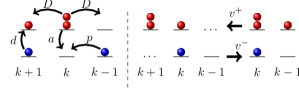
A complete description of the tube dynamics would also include the details of the dynamics in the viscinities of the tip and the vesicle. As shown numerically in Campas2008 , these details are important for establishing the conditions for tubulation. However, as demonstrated below, the form of the phase diagram is insensitive to these details and relies on the fact that the tube has a well defined mean velocity during tubulation. We thus posit that extension and retraction events occur with rates and , yielding a tube velocity . Also, since the viscosity of the membrane is two orders of magnitude larger than that of the buffer Leduc2004 , the unbound motors are dragged every time the tube extends or retracts (see figure 3). Under these conditions our results encompass a whole class of models for the tube dynamics including, for instance, those considered in Campas2008 . We now derive the different phases within a mean-field analysis.
Mean-Field (MF) Theory. In the analysis that follows it will be useful to consider two distinct frames of reference: the lab frame, where the vesicle is stationary and the site labelling starts at the vesicle and increases toward the tip of the tube; the tip frame, which is co-moving with the tip of the tube, and where the site labelling starts at the tip and increases toward the vesicle (see figure 1). In the tip frame, the mean-field equations read
| (1) |
Here, and are the average occupancies of bound and unbound motors at site . The current of bound motors moving between sites and is given by whereas the current of unbound motors reads . Both currents are defined to be positive in the direction of increasing , i.e. when they transport motors away from the tip. Also, in the tip frame, extension and retraction of the tube affects the bound motors throughout the lattice, whence the contribution of and to . Last, is the flux of motors between the two lattices. The counterpart of these equations in the lab frame ( increasing toward the tip) is easily obtained:
| (2) |
where and are the unbound and bound currents. Here also, currents are positive in the direction of increasing .
As we now show, the velocity of the tip of the tube selects plateau densities of bound and unbound motors, which we call and respectively. At the other end, the density of motors on the vesicle selects in general different plateau densities which we call and . To derive the steady-state plateau densities, we assume constant and in either (1) or (2). This yields a zero flux between the two lattices , implying for any pair of plateau densities and
| (3) |
Let us first consider the tip plateau values and using Eq. (1). Adding upper and lower lattice contributions yields a conservation equation for the total flux
| (4) |
The total flux flowing through the tip plateau in the tip frame has to equal zero as nothing can move to the left of site 1. Using the explicit expressions of and in (4) and relation (3) yields
| (5) |
Note that we do not specify equation (or dynamics) near the tip region. Solving such equations will give (generally complicated) relations between the rates at tip region and values of , and while leaving Eq. 5 unmodified. They will therefore not influence our results.
The vesicle plateau, however, is determined by the density of motors on the vesicle and the details of the nearby dynamics. While such equations can be solved for specific models, to analyze the phase diagram it is enough to know that can take any value between and .
Tip and vesicle plateau densities are typically different which suggests the possibility of a kink phase with shock and inverse shock profiles when and respectively. Generally, the kink is not at rest and this phase disappears if it propagates to either end of the system. To analyse this, we consider the kink velocity in the tip frame, , and in the lab frame, . Conservation of mass implies , where and are the total fluxes and densities to the left and right of the kink, in the tip frame. reads . Using (3) and (5) to eliminate and , we obtain in terms of :
| (6) |
In the lab frame, the kink velocity is :
| (7) |
Since are smaller than 1, is necessarily positive, i.e. the kink always propagates away from the tip. Transposed in the lab frame, this means that the kink never catches up with the tip. However, can be negative, i.e. the kink may not propagate away from the vesicle. The tip phase indeed occurs when the kink is localized at the vesicle and the density then equals that of the tip plateau, except in a boundary layer close to the vesicle.
The tip phase thus requires , which reads and can only be satisfied if
| (8) |
The system is then in the tip phase for , where
| (9) |
When is not in or condition (8) is not met, the system is in the kink phase, presenting shock when or inverse shock when . Note that for , one always has and . The phase diagram thus always exhibits reentrance if , i.e. there always exist values of for which a continuous increase of drives the system from the kink phase into the tip phase and back into the kink phase. We present the various possible phase diagrams in figure 2.
Numerics. In order to validate the theoretical predictions, we now turn to the simulation of a concrete model within the class considered here. The bulk dynamics has already been described (see figure 3) and we now specify dynamics in the viscinity of the tip and the vesicle. Our interest lies in verifying the phase diagram and to this end we choose a particularly simple model. The vesicle is represented by reservoirs of bound and unbound motors of densities and . For simplicity, they are chosen to satisfy (3) so that there is no flux between them 111For generic rates, a finite size boundary layer is formed.. At the other end, the tube extends at rate by one lattice site if a bound motor occupies the site next to the tip. When this happens, the new unbound site next to the vesicle is equilibrated with the reservoir of density . If a bound motor does not occupy the site next to the tip the tube retracts with rate . At this site motors can still attach and detach with rate and and unbound motors can hop toward the vesicle, with rate . At long time, this tip dynamics yields average extension and retraction rates and .
Models aiming to predict the threshold for tubulation and tube velocity would require modified attachment and detachment rates at the site closest to the tip and should account for backward stepping there. However, as noted above, the phase diagram depends only on the tip velocity and not on further details of the tip dynamics.
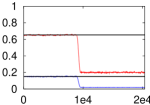
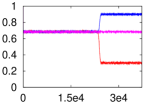
We now consider the results of continuous time simulations of the model. In figure 4, a typical shock profile and its dynamics are presented. Note the quantitative agreement with the predicitions of the mean-field theory.
We have also verified the general structure of the phase diagram and present results for the blue line indicated in figure 2. The different profiles observed are presented in figure 5. From previous lattice gas studies, one would expect the inverse shock to smooth out through a rarefaction fan. Here, on the other hand, we checked numerically that its relative width vanishes in the large time limit; it is thus stabilized by the interaction of the two lattices LongVersion . The figure also shows that the tip velocity is independent of , once tubulation is established. A mean-field analysis LongVersion suggests that this holds for generic local tip dynamics.
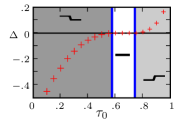
To quantify the transition, we define , where is the length of the tube. This compares the average mass of bound motors in the system with that of a putative tip phase. The parameter is non-zero in the kink phase and zero in the tip phase. An example of re-entrance is shown in figure 5. Starting with close to 0, we see that is negative, vanishing at where the system enters the tip phase. Further increase of above drives the system back into the kink phase, in the inverse shock region, and becomes positive.
Conclusion In this letter we have shown that the dynamics of tubulation reveals a rich phenomenology, including shocks, inverse shocks and re-entrant phase transitions. This arises from the two competing densities set by the two ends of the tube and the dynamics of the resulting kink determines the phase structure. This picture is substantiated by a mean-field theory which accurately predicts the phase diagram, as checked by our numerics.
Some experimental signatures of our theory are as follows. First, the velocity of the tip should always exceed that of the kink. Also, once tubulation is established, the velocity of the tip is not sensitive to the density of motors on the surface of the vesicle. Last, in the experiment, the ratio is very small Campas2008 . It should therefore be possible to observe the transitions to the tip phase by varying the density of motors on the surface of the vesicle. To explore the full phase diagram presented in figure 2, one needs to change microscopic rates to vary . Experimentally, this could be done by changing parameters such as the membrane surface tension or the ATP concentration. Finally, corrections to the phase diagram due to partial exclusion among unbound motors is of order where is the maximal occupancy of the unbound lattice LongVersion . Here, it would be of the order of .
We thank D. Mukamel for a critical reading of the manuscript. JT acknowledges funding from EPSRC grant EP/030173. YK thanks the Israeli Science Foundation for support and O. Campas for discussions.
References
- (1) J.C. Howard, Mechanics of Motor Proteins and the Cytoskeleton (Sinauer, Sunderland, MA, 2001)
- (2) A. Roux et al., Proc. Natl. Acad. Sci. USA 99, 5394, (2002)
- (3) C. Leduc et al., Proc. Natl. Acad. Sci. USA 101, 17096, (2004)
- (4) P.M. Shaklee et al., Proc. Natl. Acad. Sci. USA 105, (2008)
- (5) O. Campas et al., Phys. Rev. Lett. 97, 038101 (2006)
- (6) O. Campas et al., Biophys. J., 94, 5009, (2008)
- (7) J. S. Hager et al., Physical Review E 63 056110 (2001); K. Nishinari et al., Phys. Rev. Lett. 95, 118101 (2005); R. A. Blythe, M. R. Evans, J. Phys. A 40, R333, (2007);
- (8) J. Krug, Phys. Rev. Lett. 67, 1882 (1991); M. R. Evans, Europhys. Lett. 36 13 (1996); K. Mallick, J. Phys. A 29 5375 (1996); A. B. Kolomeisky, J. Phys. A 31 1153 (1998).
- (9) Y Aghababaie, G I. Menon, and M Plischke Phys. Rev. E 59, 2578 (1999); S. Klumpp and R. Lipowsky, J. Stat. Phys. 113, 233 (2003); A. Parmeggiani, T. Franosch and E. Frey, Phys. Rev. Lett. 90, 086601, (2003); D. Chowdhury, A. Schadschneider, K. Nishinari, Life Rev. 2, 318 (2005); S.A. Nowak, P.W. Fok, and T. Chou, Phys. Rev. E 76, 031135 (2007); K. E. P. Sugden et al., Phys. Rev. E 75, 031909 (2007); K Tsekouras and A B Kolomeisky, J. Phys. A 41, 465001 (2008) H. Grzeschik, R. J. Harris, L. Santen, arXiv:0806.3845;
- (10) J. Tailleur, M.R. Evans, Y. Kafri, In preparation.