Surface Induced Crystallization in Supercooled Tetrahedral Liquids
Abstract
Freezing is a fundamental physical phenomenon that has been studied over many decades; yet the role played by surfaces in determining nucleation has remained elusive. Here we report direct computational evidence of surface induced nucleation in supercooled systems with a negative slope of their melting line (). This unexpected result is related to the density decrease occurring upon crystallization, and to surface tension facilitating the initial nucleus formation. Our findings support the hypothesis of surface induced crystallization of ice in the atmosphere, and provide insight, at the atomistic level, into nucleation mechanisms of widely used semiconductors.
pacs:
64.60.Q-,64.70.dg,07.05.Tp,64.60.qeIn 1910, F. Lindemann F.A. Lindemann (1910) suggested that melting of a crystal begins when the root-mean-square amplitude of the lattice vibration reaches a critical fraction of the nearest neighbor distance. As surface atoms are usually weakly bonded and under-coordinated compared to those in the bulk, melting is often observed to originate at the surface Robert W. Cahn (1986) both in experiments Joost W.M. Frenken and J.F. van der Veen (1985) and computer simulations U. Tartaglino et al. (2005). The nucleation of crystals from the melt is in turn a more complex phenomenon. In the absence of heterogeneous centers, homogeneous nucleation occurs, and the effect of surfaces on this process is not well understood. While common wisdom would regard surfaces as unfavorable nucleation sites, atmospheric observations and sophisticated experiments on suspended droplets of water A. Tabazadeh et al. (2002); R.A. Shaw et al. (2005); A.J. Durant and R.A. Shaw (2005) and of liquid metal alloys P.W. Sutter and E.A. Sutter (2007); O.G. Shpyrko et al. (2006) support the hypothesis of surface-induced crystallization Y.S. Djikaev (2008) for some systems.
Despite its remarkable implications in a variety of scientific disciplines, such as atmospheric physics A. Tabazadeh et al. (2002); R.A. Shaw et al. (2005); S. Sastry (2005), metallurgy O.G. Shpyrko et al. (2006), and nanoscience P.W. Sutter and E.A. Sutter (2007), a microscopic understanding of nucleation process in the presence of free surfaces is still missing. Technical difficulties in designing experiments to capture nucleation events in, e.g., suspended droplets, have so far prevented an accurate characterization of the freezing process and direct simulations of nucleation require very challenging computer experiments, as the time scales involved usually exceed the capabilities of present day computers. In the recent literature, nucleation rates were computed for simple systems by employing accelerated Monte Carlo or molecular dynamics (MD) algorithms C.H. Bennett (1977); D. Chandler (1978); J.S. van Duijneveldt and D. Frenkel (1992), e.g., in Lennard-Jones liquid D. Moroni et al. (2005); F. Trudu et al. (2006), hard-sphere colloids S. Auer and D. Frenkel (2001); A. Cacciuto et al. (2004), and two-dimensional Ising model R.P. Sear (2007).
In this Letter, we combine the recently developed forward flux sampling (FFS) method R.J. Allen et al. (2006a, b) with MD simulations A.F. Voter (1998) to compute the nucleation rate of supercooled liquid Si, at temperatures up to 95% of the melting point. Our study shows that the presence of free surfaces may enhance the nucleation rates by several orders of magnitude with respect to those found in the bulk, and demonstrate that free surfaces, in addition to their well-known role in initiating melting, can also be “catalytic” sites for freezing in tetrahedral liquids with a negative slope of their melting lines ().
We carry out MD simulations, within the isobaric-isothermal canonical ensembles (NPT) at , and within the isothermal canonical ensembles (NVT), for bulk Si and for slab configurations, respectively. Most of our simulations are performed with 5832 atoms in a cubic cell using Tersoff potential J. Tersoff (1989). The rate for growing a solid cluster containing atoms out of the liquid can be expressed T.S. van Erp et al. (2003) by the product of a flux rate for the formation of smaller clusters with () atoms, and the probability for these clusters to eventually grow to size . Within the FFS scheme one can compute these two terms separately, and is obtained by sampling a number of interfaces between the initial and final states in the space of the order parameter. In our case it is natural to choose this parameter as the number of Si atoms formed in the largest solid cluster. To identify Si crystalline clusters in the liquid, we employ a local order parameter, as defined in Ref. L.M. Ghiringhelli et al. (2007), which has been shown to be highly sensitive to crystalline order P.J. Steinhardt et al. (1983). The flux rate is computed by conducting standard MD simulations starting from a well-defined basin () in phase space. As occasional fluctuations lead to direct crossing of the first interface, , the atomic configuration is recorded. The simulation is then continued until () configurations are collected and the average flux rate is given by , where and are the total simulation time and the system volume, respectively. During this step, we find that inclusion of free surfaces does not significantly change the flux rates, at all temperatures. Therefore the influence of free surfaces on nucleation rates is expected to be sufficiently well represented by the variation of the growth probability .
To compute the growth probability , we start from the configurations collected at the interface and carry out a large number (, typically around 100010,000) of trial MD runs with different randomized initial momenta. A few () trial runs result in successful crossings to the next interface, while in the remaining cases small crystalline clusters dissolve. The individual crossing probability is then given by . The subsequent trial runs are launched at these crossing points on the next interface and the total growth probability is given by: 111In order to evaluate the effect of sampling techniques on our results, we repeat our calculations of at 0.95 by employing a Langevin thermostat S. Chandrasekhar (1943), and by varying both the interface spacing and the cell size. The observed changes in nucleation rate are within the error bars given in Fig.1A..
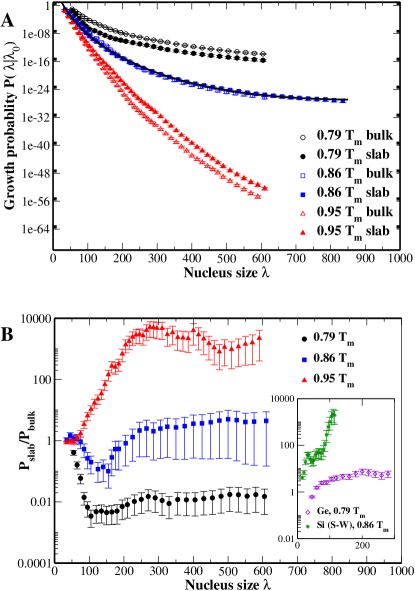
The calculated transition probability as a function of the cluster size is shown in Fig.1A for both bulk systems and slabs, at several temperatures. Initially sharply decreases as small clusters grow, and then it tends to saturate, indicating the formation of a critical size nucleus. Consistent with classical nucleation theory, the calculated nucleation rates show a strong dependence on : Raising from 0.79 to 0.86 yields a significant decrease in the rate by over 12 orders of magnitude. In particular, the computed nucleation rate at 0.86 agrees well with the experimental measurement at % supercooling G. Devaud and D. Turnbull (1985).
The most striking result of this calculation is that it demonstrates a clear transition in preferential nucleation from the bulk to the slab, as increases. This finding is illustrated in Fig.1B that shows the ratio of the growth probability between the liquid slab and bulk, , as a function of . At 0.79 , this ratio decreases rapidly, as the small clusters grow, and it stabilizes around , for . This indicates that nucleation from the liquid slab is unfavorable as compared to that from the bulk. When is raised to 0.86 , is around unity, suggesting that in the slab and the bulk one achieves virtually identical nucleation rates. As the temperature is further increased up to 0.95 , the liquid slab yields a nucleation rate over a thousand times higher than that in the bulk liquid, for .
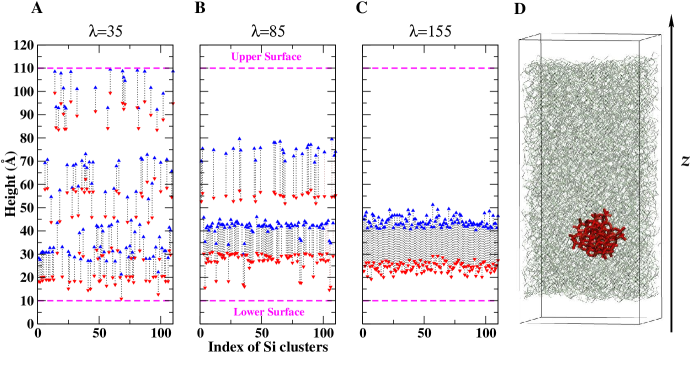
This noticeable increase in nucleation rates is then naturally attributed to the presence of the free surface in the slab. To show this is indeed the case, we explore the microscopic details of growing Si clusters, particularly their distributions in the direction normal to the free surface. Here we replicate the unit cell and include 11,664 atoms. Fig.2 displays such distributions at different stages of the cluster formation. Initially, the small solid Si clusters are distributed nearly evenly along the axis (Fig.2A), which is in accord with the computed flux rates being of comparable magnitude in the bulk and in the slab. As solid clusters grow, there appears a clear tendency for those with the highest growth probability to be located close to the free surface. Such a tendency is confirmed by fewer clusters being present in the middle of the slab, as increases. Finally all clusters exclusively reside about 1 nm away from the immediate interface between the liquid and vacuum (Fig.2C).
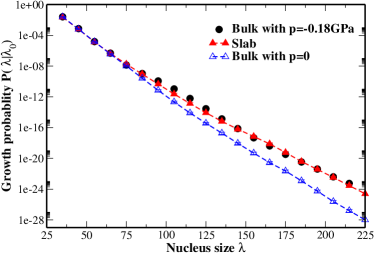
To understand the “catalytic” role of the liquid surface in crystallization events, we consider the nucleation rate , where is a kinetic pre-factor and is the minimum free energy barrier. Free surfaces do not exhibit the same order as in the bulk, and have undercoordinated atoms, making the formation of crystalline clusters unfavorable in their vicinity, if the bulk offers a sufficient number of atomic sites for a nucleus to grow. On the other hand, the generally high atomic mobility near free surfaces contributes to an enhancement of the kinetic factor . The free energy change for the formation of a small crystallite is the sum of the volume contribution and the solid-liquid interface contribution : . Observing that in the liquid slab the solid Si clusters reside in the subsurface (see Fig.2 C and D) and are thus still surrounded by a liquid like environment, we assume that the solid-liquid interface contribution remains the same near the free surface; the volume contribution is instead decreased, as compared to the bulk. In particular in our simulations we find that the free surface introduces a small lateral pressure field (), in the plane parallel to the surface. Therefore a pressure dependent term must be added to the volume free energy change , in order to account for the nucleation of a cluster containing atoms: , where and are the number densities of the liquid and solid, respectively. Since liquid Si is denser than the solid at the melting point, i.e., , is negative. It then follows that the energy barrier for nucleation is slightly lowered near a liquid surface, relative to that in the bulk where . In other words, as in a tetrahedral liquid with the density is decreased upon solidification, the presence of a free surface can accommodate volume expansion more easily due to surface tension, and thus nucleation in its vicinity may be preferred. To further elucidate the role of surface tension, we repeated the simulations in the bulk at 0.95 , but with a small negative hydrostatic pressure applied to the cell ( kbar, i.e., the same corresponding to the surface tension in the slab.) This is equivalent to lowering the density of the liquid, bringing it closer to that of the solid (see Fig.4). As shown in Fig.3, the slight decrease in liquid density in the bulk reproduces essentially the observed increase of nucleation rates in the liquid slab.
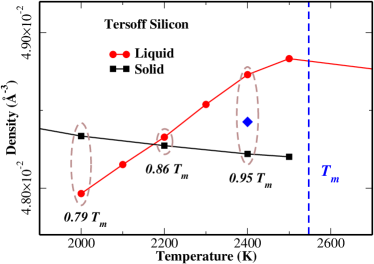
The calculated temperature dependent density change, as obtained for the Tersoff Si, is shown in Fig.4 for both the liquid and the solid near . Note that at all in our simulation, the liquid slab is under tension, as a result of the presence of surfaces. At 0.95 , liquid Si is about 1% denser than the solid. Hence the formation of a less dense solid Si nucleus is easier in the proximity of a surface. At 0.79 , the density of supercooled liquid falls below that of the solid. In this case, nucleation at the surface involves a higher energy barrier than in the bulk, and it is therefore not preferred. We also notice that the densities of diamond and liquid Si become equal at about 0.86 , where our simulations show no difference in rates between surface and bulk nucleations. To further elucidate the role of density, we also conducted simulations for Ge at 0.79 using the Tersoff potential, and for Si at 0.86 employing the Stillinger-Weber (SW) potential F.H. Stillinger and T.A. Weber (1985). In both cases, the liquids are denser than the solids, with 3% and 7% density difference, for the Tersoff Ge and S-W Si, respectively. Calculations show (see the insert of Fig. 1B) that freezing in the slab is still preferred for both systems, consistent with our analysis, and our results for Tersoff Si.
While we found conditions under which crystallization is favored by the presence of free surfaces, we emphasize that nucleation does not occur exactly at the surface but instead in a subsurface region which is a few atomic layers underneath. To understand that, we compute the local pressure and its correlation time , where , and the bracket “” indicates ensemble averages, as a function of the slab depth . We find that the cluster tends to grow in the region where the pressure field is non zero, however not where the pressure field exhibits its minimum. This reflects the fact that while the nucleation rate is dominated by free energy changes, the preferential location of cluster formation is influenced by both static and dynamical properties of the liquid. In fact, , which measures how rapidly pressure fluctuations decay, shows a maximum at the surface, decaying with an oscillatory behavior towards the center of the slab. Therefore, the preferential location of the nucleus is the result of a subtle balance between the local static pressure and its dynamical fluctuations. Details of and calculation will be given in a longer report.
Our calculations demonstrate that free surfaces, in addition to their well-known role in initiating melting, can also be catalytic sites for freezing in tetrahedral liquids with a negative slope, , of their melting lines. This unexpected result is related to the density decrease occurring upon crystallization in these systems, and to surface tension facilitating the initial nucleus formation. Our result is consistent with recent experiment and simulations M.H. Bhat et al. (2007); V. Molinero et al. (2006) showing that liquid Ge can be vitrified (suppression of crystallization) by applying pressure. Our results suggest that surface catalyzed nucleation should also be observed in other tetrahedrally bonded materials showing density decrease upon solidification. One interesting case is water, for which there is experimental evidence suggesting surface crystallization in tiny water droplets suspended in clouds A. Tabazadeh et al. (2002). These findings can be naturally explained by our results. We also notice that previous direct MD simulations of water L. Vrbka and P. Jungwirth (2006) showed that ice crystallizes in a subsurface region, consistent with our findings.
We thank D.C. Chrzan, A.F. Voter, and M. Parrinello for fruitful discussions. This work was supported by DOE (contract numbers DE-FG02-06ER46262 and DE-FC02-06ER25794).
References
- F.A. Lindemann (1910) F.A. Lindemann, Z. Phys 11, 609 (1910).
- Robert W. Cahn (1986) Robert W. Cahn, Nature 323, 668 (1986).
- Joost W.M. Frenken and J.F. van der Veen (1985) Joost W.M. Frenken and J.F. van der Veen, Physical Review Letters 54, 134 (1985).
- U. Tartaglino et al. (2005) U. Tartaglino, T. Zykova-Timan, F. Ercolessi, and E. Tosatti, Physics Reports 441, 291 (2005).
- A. Tabazadeh et al. (2002) A. Tabazadeh, Y.S. Djikaev, and H. Reiss, Proceedings of the National Academy of Sciences 99, 15873 (2002).
- R.A. Shaw et al. (2005) R.A. Shaw, A.J. Durant, and Y. Mi, J. Phys. Chem. B 109, 9865 (2005).
- A.J. Durant and R.A. Shaw (2005) A.J. Durant and R.A. Shaw, Geophys. Res. Lett. 32, L20814 (2005).
- P.W. Sutter and E.A. Sutter (2007) P.W. Sutter and E.A. Sutter, Nat. Mater. 6, 363 (2007).
- O.G. Shpyrko et al. (2006) O.G. Shpyrko, R. Streitel, V.S.K. Balagurusamy, A.Y. Grigoriev, M. Deutsch, B.M. Ocko, M. Meron, B. Lin, and P.S. Pershan, Science 313, 77 (2006).
- Y.S. Djikaev (2008) Y.S. Djikaev, J. Phys. Chem. A 112, 6592 (2008).
- S. Sastry (2005) S. Sastry, Nature 438, 746 (2005).
- C.H. Bennett (1977) C.H. Bennett, in Algorithms for Chemical Computations (American Chemical Society, Washington, D.C., 1977), p. 63.
- D. Chandler (1978) D. Chandler, J. Chem. Phys. 68, 2959 (1978).
- J.S. van Duijneveldt and D. Frenkel (1992) J.S. van Duijneveldt and D. Frenkel, J. Chem. Phys 96, 4655 (1992).
- D. Moroni et al. (2005) D. Moroni, P. Rein ten Wolde, and P.G. Bolhuis, Phys. Rev. Lett. 94, 235703 (2005).
- F. Trudu et al. (2006) F. Trudu, D. Donadio, and M. Parrinello, Phys. Rev. Lett. 97, 105701 (2006).
- S. Auer and D. Frenkel (2001) S. Auer and D. Frenkel, Nature 409, 1020 (2001).
- A. Cacciuto et al. (2004) A. Cacciuto, S. Auer, and D. Frenkel, Nature 428, 404 (2004).
- R.P. Sear (2007) R.P. Sear, J. Phys.: Condens Mat 19, 466106 (2007).
- R.J. Allen et al. (2006a) R.J. Allen, D. Frenkel, and P. Rein ten Wolde, J. Chem. Phys. 124, 024102 (2006a).
- R.J. Allen et al. (2006b) R.J. Allen, D. Frenkel, and P. Rein ten Wolde, J. Chem. Phys. 124, 194111 (2006b).
- A.F. Voter (1998) A.F. Voter, Phys. Rev. B 57, R13985 (1998).
- J. Tersoff (1989) J. Tersoff, Phys. Rev. B 39, 5566 (1989).
- T.S. van Erp et al. (2003) T.S. van Erp, D. Moroni, and P.G. Bolhuis, J. Chem. Phys. 118, 7762 (2003).
- L.M. Ghiringhelli et al. (2007) L.M. Ghiringhelli, C. Valeriani, E.J. Meijer, and D. Frenkel, Phys. Rev. Lett. 99, 055702 (2007); L.M. Ghiringhelli et al. http://arxiv.org/abs/0804.1671v1 (2008).
- P.J. Steinhardt et al. (1983) P.J. Steinhardt, D.R. Nelson, and M. Ronchetti, Phys. Rev. B 28, 784 (1983).
- F.H. Stillinger and T.A. Weber (1985) F.H. Stillinger and T.A. Weber, Phys. Rev. B 31, 5262 (1985).
- G. Devaud and D. Turnbull (1985) G. Devaud and D. Turnbull, Appl. Phys. Lett. 46, 844 (1985).
- M.H. Bhat et al. (2007) M.H. Bhat, V. Molinero, E. Soignard, V.C. Solomon, S. Sastry, J.L. Yarger, and C.A. Angell, Nature 448, 787 (2007).
- V. Molinero et al. (2006) V. Molinero, S. Sastry, and C.A. Angell, Phys. Rev. Lett. 97, 075701 (2006).
- L. Vrbka and P. Jungwirth (2006) L. Vrbka and P. Jungwirth, J. Phys. Chem. B 110, 18126 (2006).
- S. Chandrasekhar (1943) S. Chandrasekhar, Rev. Mod. Phys. 15, 0001 (1943).