INTEGRAL observation of hard X-ray variability of the TeV binary
LS 5039/RX J1826.2-1450
††thanks:
Based on observations with INTEGRAL, an ESA project with instruments
and science data centre funded by ESA member states (especially the PI
countries: Denmark, France, Germany, Italy, Switzerland, Spain), Czech
Republic and Poland, and with the participation of Russia and the USA.
Abstract
Context. LS 5039 / RX J1826.2-1450 is one of the few High Mass X-ray binary systems from which radio and high energy TeV emission has been observed. Moreover, variability of the TeV emission with orbital period was detected.
Aims. We investigate the hard X-ray ( keV) spectral and timing properties of the source with the monitoring IBIS/ISGRI instrument on-board the INTEGRAL satellite.
Methods. We present the analysis of INTEGRAL observations for a total of about 3 Msec exposure time, including both public data and data from the Key Programme. We search for flux and spectral variability related to the orbital phase.
Results. The source is observed to emit from 25 up to 200 keV and the emission is concentrated around inferior conjunction. Orbital variability in the hard X-ray band is detected and established to be in phase with the orbitally modulated TeV emission observed with H.E.S.S. For this energy range we determine an average flux for the inferior conjunction phase interval of erg cm-2 s-1, and a flux upper limit for the superior conjunction phase interval of erg cm-2 s-1 (90% conf. level respectively). The spectrum for the inferior conjunction phase interval follows a power law with an index (90% conf. level).
Key Words.:
X-ray binaries; TeV emission; Microquasars1 Introduction
LS 5039 / RX J1826.2-1450 is a High Mass X-ray Binary (HMXRB) system, which was discovered in the ROSAT all-sky survey and identified with optical follow-up observations by Motch et al. (1997). The compact companion is estimated to have a mass of , orbiting a bright, , O6.5V((f)) star with an orbital period d, an eccentricity and a distance of kpc (Casares et al., 2005). Based on the observation of persistent asymmetric milliarcsecond radio outflows (extending up to 1000 AU), Martí et al. (1998) and Paredes et al. (2000) suggested the presence of a mildly relativistic () jet. Paredes et al. (2002) and Ribó et al. (2008) have therefore proposed the source to be a microquasar.
LS 5039 has been observed by several X-ray satellites. A summary of all observations can be found in Bosch-Ramon et al. (2005). Flux variations on timescales of days as well as miniflares on shorter timescales have been observed. RXTE observations, covering the whole orbital period, show variability with a maximum of emission at orbital phase , interpreted due to periastron passage. Moreover, the power-law shaped X-ray spectrum appears harder in the high flux state (Bosch-Ramon et al., 2005).
Because inhomogeneous jets could emit rays via inverse Compton scattering, Paredes et al. (2000, 2002) have proposed the source to be the counterpart of the unidentified high energy EGRET source 3EG J1824-1514 (Hartman et al., 1999) and also a component of the MeV emitter GRO J1823-12, which is a superposition of three EGRET sources (Collmar, 2003).
The source has likewise been discovered to emit at TeV energies with the High Energy Stereoscopic System (H.E.S.S.) (Aharonian et al., 2005). This demonstrated that X-ray binaries are capable of accelerating particles to TeV energies. The H.E.S.S. measurements have revealed that the flux and energy spectrum of the source are indeed modulated with the d orbital period of the binary system (Aharonian et al., 2006). The VHE -ray emission is largely confined to half of the orbit and peaks around the inferior conjunction (INFC) epoch of the compact companion, where a hardening of the spectrum is observed. According to the authors these findings indicate that ray absorption with pair production occurs in the system. Interestingly, orbital variability at TeV ray energies has also been discovered in the similar system LS I+61∘303 with MAGIC (Albert et al., 2006) and VERITAS (Acciari et al., 2008).
The nature of the compact object in the system RX J1826.2-1450 / LS 5039 as well as the orgin of the TeV emission is still under debate. A microquasar scenario (see e.g. Paredes et al., 2000; Bosch-Ramon & Paredes, 2004; Torres & Sierpowska-Bartosik, 2008) as well as a pulsar scenario (see e.g Dubus, 2006; Sierpowska-Bartosik & Torres, 2007; Bosch-Ramon et al., 2008) have been discussed. In this Letter, based mainly on archival data from INTEGRAL which span 4.6 years between March 2003 and October 2007, we confirm the detection of the source reported by Bird et al. (2007) in the energy range from 25 keV up to 200 keV. We report the discovery of the modulation of the hard X-ray flux with orbital phase.
2 Observations and data analysis
2.1 Observations
The International Gamma-Ray Astrophysics Laboratory (INTEGRAL, Winkler et al., 2003) carries on board two main gamma-ray instruments, the Spectrometer on INTEGRAL (SPI, 20 keV–8 MeV, Vedrenne et al., 2003), and the Imager on-Board INTEGRAL Satellite (IBIS, 15 keV–10 MeV, Ubertini et al., 2003) as well as two monitoring instruments in the X-ray and optical range, the Joint European X-Ray Monitor (JEM-X, 3–35 keV, Lund et al., 2003), and the Optical Monitoring Camera (OMC, Mas-Hesse et al., 2003).
1648 science windows (ScWs) in the region that includes LS 5039 are found in the data archive available at the INTEGRAL Scientific Data Center (ISDC, http://isdc.unige.ch/), including public data as well as data from the Key Programme. These ScWs were preselected choosing an off-axis angle of the source smaller than 10 degrees and choosing only pointing observations that had a nominal observation time of more than 1000 seconds. 1627 ScWs were successfully processed through the analysis with OSA 7.0 up to the image step IMA.
In order to reduce statistical effects a further selection of ”good science windows” was necessary. ScWs are included in the analysis when they fulfill the following criteria:
-
1.
The effective exposure time after extraction is larger than sec.
-
2.
The number of good time intervals (GTI) does not exceed .
-
3.
The mean background intensity level of a single ScW in the energy range keV falls within of the distribution of the mean background intensity levels of all other ScWs in the same energy range.
The resulting 1393 ScWs cover the time range from 03-11-2003 (ScW: 005000080010) to 10-25-2007 (ScW: 061400950010). Firstly, the sample was split into two parts according to the orbital phase for imaging analysis, and secondly into 10 smaller parts according to the orbital phase to analyse the flux dependence on orbital phase (see Sect.2.2). Table 1 summarizes the observational data of the source LS 5039 taken by the INTEGRAL satellite and the selection made for this analysis. Only in less than 10% of the selected ScWs was LS 5039 in the fully coded field of view of JEM-X. Based on the sensitivity of JEM-X111The User Manual to the OSA can be found at: http://isdc.unige.ch/?Support+documents. See p. 15 of JEM-X Analysis User Manual for a JEM-X sensitivity plot. and the amount of available data, a JEM-X analysis for a faint source like LS 5039 is not suitable. In this paper we therefore focus our analysis on the data of the Integral Soft Gamma-Ray Imager (IBIS/ISGRI).
| Number of all extracted ScWs | 1648 | |
|---|---|---|
| Number of ScWs after selection | 1393 | |
| Number of ScWs in phase SUPC | 721 | |
| Number of ScWs in phase INFC | 672 | |
| final total analyzed exposure time | Msec | |
| splitted in SUPC phase | Msec | |
| and in INFC phase | Msec |
2.2 Analysis
For the analysis of ISGRI data the Off-line Science Analysis (OSA) software (version 7.0) provided by the ISDC was used. In addition, we cross checked the results and also generated the lightcurve in Sec. 2.2.2 with the analysis package developed by INAF-IFC Palermo222http://www.pa.iasf.cnr.it/ferrigno/ INTEGRALsoftware.html (Segreto & Ferrigno, 2006).
A special handling of the OSA was used for this analysis. First, we used a user catalogue which includes 115 sources, i.e. all sources listed in the INTEGRAL General Reference Catalog333The INTEGRAL General Reference Catalogue is available at ISDC: http://isdc.unige.ch/index.cgi?Data+catalogs, which are in the field of view (FoV) and which turned out to be as bright as or brighter than RX J1826.2-1450 ( LS 5039). This is required because the source of interest is quite faint and the crowded field produces too many ghost images if the known sources are not subtracted. Second, the spectrum was produced with the help of the OSA tool mosaic_spec444http://isdc.unige.ch/Soft/download/osa/osa_doc/ osa_doc-5.0/osa_um_ibis-5.0/node108.html#mosaspec from 13 mosaics, each covering one energy bin in the keV range. The binning was chosen identical to the default energy binning OSA uses for the spectrum calculation step (SPE). This procedure is needed due to the fact that the source is faint and the FoV is too crowded, and provides more reliable results than the standard OSA pipeline does.
We also checked our results using the standard SPE and the lightcurve creation (LCR) steps of OSA. In this case we used a special catalogue including all sources with a detection significance greater than in the energy band keV. The catalogue includes 65 sources. According to the User Manual of the INTEGRAL IBIS/ISGRI data analysis this is beyond the standard method (see the IBIS Analysis Manual11footnotemark: 1 for details). However, our results show that a careful treatment of this standard method provides a comparable result in spite of the restrictions (see Fig. 4 and Sec. 2.2.2).
2.2.1 Imaging
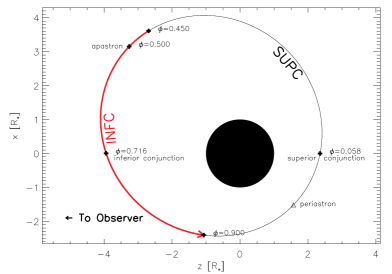
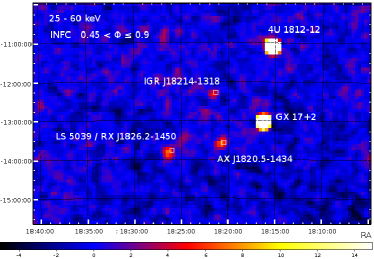
The source is clearly seen at a significance level of 7.7 in the lower energy band of keV in the significance map based on the sum of all ScWs fulfilling the selection criteria. In addition, we divided the data set into two phase intervals: the superior conjunction passage at orbital phase (SUPC), and the inferior conjunction, at orbital phase (INFC) (see Figs. 1 and 4 for details). Phase intervals are defined in Aharonian et al. (2006) for the H.E.S.S. data. The two orbital resolved significance maps in the energy range keV are shown in Fig. 2. Positions of sources (open boxes) are provided by the latest INTEGRAL General Reference Catalog33footnotemark: 3.
At the INFC phase interval, the source was detected with a significance , for an exposure time of Msec (Fig. 2, lower panel). At the SUPC phase interval the source was observed for a total exposure time of Msec, and was only marginally detected: at the source position there is an excess at the level of (Fig. 2, upper panel). For the total sample and the total energy band keV the source is detected at the position fitted by OSA ( deg, deg) with . Within the errors, this is consistent with the source position determinated by Bird et al. (2007).

2.2.2 Timing analysis
A lightcurve produced with the INAF-IFC data analysis software (Segreto & Ferrigno, 2006) was used for the timing analysis. According to the authors this software is suitable to produce reliable results even in the case of the presence of a larger number of sources in the FoV.
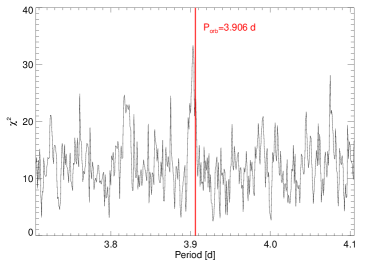
Searching for an unambiguous period failed due to low statistics and large gaps in the sample of observations. But a periodogram produced by epoch folding provides a peak at a period of 3.903 days, which is within uncertainties identical to the orbital period determined by Casares et al. (2005) in the optical band. Fig. 3 shows the periodogram.
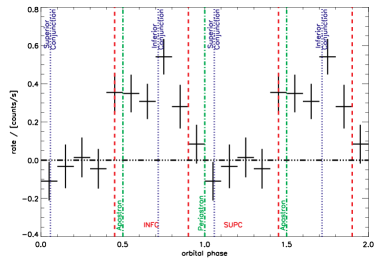
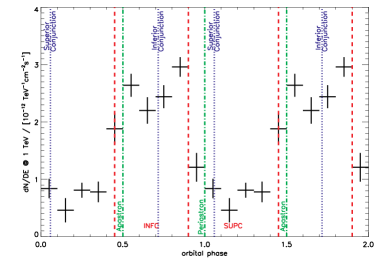
In a next step the lightcurve was folded using the known orbital period of days with ( phase and periastron passage) determined by Casares et al. (2005), to produce a 10 bin orbital phase profile. In addition, 10 mosaics corresponding to each of the 10 orbital phase intervals were produced and the count rates at the catalogue33footnotemark: 3 position were determined. The values of the fluxes were derived from a 2D-Gaussian fit with fixed width (HWHM arcmin) and fixed source position. Both methods yield (within errors) comparable results: The hard X-ray emission is clearly modulated with the orbit, and appears to be in phase with the TeV emission (Fig. 4). The H.E.S.S. data points in the figure are from Aharonian et al. (2006).
2.2.3 Spectral analysis
A statistically significant IBIS/ISGRI spectrum of LS 5039 was obtained for the orbital phase interval corresponding to INFC (not shown here) and was modeled with a power law with (90% confidence level). The reduced for the fit is 1.4 (9 dof). Mean countrates for the two phase intervals allow us to estimate a flux for the INFC phase interval of erg cm-2 s-1 (90 % conf. level). For the SUPC phase interval a flux upper limit of erg cm-2 s-1 (90 % conf. level) for the energy range keV can be determined.
3 Summary and discussion
In this paper we report on a Msec INTEGRAL monitoring of the HMXRB RX J1826-1450 / LS 5039. The faintness of the source and the fact that it lies in a crowded field required a very careful, non-standard handling of the data.
Our results, obtained by applying different analysis methods, point out that the source significantly emits at hard X-rays ( keV) and that this emission varies with the orbit in phase with the very high energy -rays detected with H.E.S.S. (Fig. 4). The spectrum at the inferior conjunction is well described by a power law, while at the superior conjunction the hard X-ray emission, if any, is below the sensitivity of INTEGRAL. Our result indicates that accretion might not be the mechanism for the production of the hard emission, since, in this case, we would expect a rather sharp flux maximum near periastron.
Moreover, the observed close correlation of hard X-ray and VHE -ray emission in phase suggests that the emission would originate from the same source region, possibly from particles produced in the same acceleration process.
This casts doubt on the simple explanation that the TeV variability is mainly caused by - absorption, as suggested in Aharonian et al. (2006).
We note that, from the correlation alone, more complicated scenarios involving - absorption such as described by Dubus et al. (2008) cannot be ruled out. However the cascades initiated in the - absorption process produce secondary electrons (Bednarek, 1997) also emitting X-ray synchrotron emission. Therefore, soft and hard X-ray flux levels can be used to constrain the amount of absorption involved. The detection of TeV emission at SUPC together with the upper limit in the hard X-ray domain derived here may pose problems for models invoking only one emission region close to the compact object, as recently discussed in Bosch-Ramon et al. (2008).
Radio observations interpreted as jets have led to a microquasar interpretation for this source. In this scenario, particles are accelerated to TeV energies (Perucho & Bosch-Ramon, 2008) due to the interaction between the jet and the stellar wind of the companion. Alternatively, Dubus (2006) has suggested the source to be a pulsar binary system, where VHE emission arises from the pulsar wind material shocked by the interaction with the stellar companion wind and afterwards flowing away in a comet-shape tail. Unfortunately, the observations presented here do not enable us to discriminate between the two scenarios, although the predicted X-ray variability by Paredes et al. (2006) seems to be not in accordance with our observations. Finally, we remark that a hadronic scenario (Romero et al., 2003; Romero & Vila, 2008) is not ruled out by our findings. A longer and more detailed interpretation of our results is beyond the scope of this Letter, and will be the subject of further investigations.
Acknowledgements.
We acknowledge the support of the Deutsches Zentrum für Luft- und Raumfahrt (DLR) under grant number 50OR0302. This work is based on observations with INTEGRAL, an European Space Agency (ESA) project with instruments and science data centre funded by ESA member states (especially the PI countries: Denmark, France, Germany, Italy, Switzerland, Spain), Czech Republic and Poland, and with the participation of Russia and the USA. We also thank the anonymous referee for his/her valueable comments. and suggestions.References
- Acciari et al. (2008) Acciari, V. A., Beilicke, M., Blaylock, G., et al. 2008, ApJ, 679, 1427
- Aharonian et al. (2005) Aharonian, F., Akhperjanian, A. G., Aye, K.-M., et al. 2005, Science, 309, 746
- Aharonian et al. (2006) Aharonian, F., Akhperjanian, A. G., Bazer-Bachi, A. R., et al. 2006, A&A, 460, 743
- Albert et al. (2006) Albert, J., Aliu, E., Anderhub, H., et al. 2006, Science, 312, 1771
- Bednarek (1997) Bednarek, W. 1997, A&A, 322, 523
- Bird et al. (2007) Bird, A. J., Malizia, A., Bazzano, A., et al. 2007, ApJS, 170, 175
- Bosch-Ramon et al. (2008) Bosch-Ramon, V., Khangulyan, D., & Aharonian, F. 2008, ArXiv e-prints, 0810.4494
- Bosch-Ramon & Paredes (2004) Bosch-Ramon, V. & Paredes, J. M. 2004, A&A, 417, 1075
- Bosch-Ramon et al. (2005) Bosch-Ramon, V., Paredes, J. M., Ribó, M., et al. 2005, ApJ, 628, 388
- Casares et al. (2005) Casares, J., Ribó, M., Ribas, I., et al. 2005, MNRAS, 364, 899
- Collmar (2003) Collmar, W. 2003, in Proc. of 4th Agile Science Workshop, Franscati (Rome) on 11-13 June 2003, p.177
- Dubus (2006) Dubus, G. 2006, A&A, 456, 801
- Dubus et al. (2008) Dubus, G., Cerutti, B., & Henri, G. 2008, A&A, 477, 691
- Hartman et al. (1999) Hartman, R. C., Bertsch, D. L., Bloom, S. D., et al. 1999, ApJS, 123, 79
- Lund et al. (2003) Lund, N., Budtz-Jørgensen, C., Westergaard, N. J., et al. 2003, A&A, 411, L231
- Martí et al. (1998) Martí, J., Paredes, J. M., & Ribo, M. 1998, A&A, 338, L71
- Mas-Hesse et al. (2003) Mas-Hesse, J. M., Giménez, A., Culhane, J. L., et al. 2003, A&A, 411, L261
- Motch et al. (1997) Motch, C., Haberl, F., Dennerl, K., Pakull, M., & Janot-Pacheco, E. 1997, A&A, 323, 853
- Paredes et al. (2006) Paredes, J. M., Bosch-Ramon, V., & Romero, G. E. 2006, A&A, 451, 259
- Paredes et al. (2000) Paredes, J. M., Martí, J., Ribó, M., & Massi, M. 2000, Science, 288, 2340
- Paredes et al. (2002) Paredes, J. M., Ribó, M., Ros, E., Martí, J., & Massi, M. 2002, A&A, 393, L99
- Perucho & Bosch-Ramon (2008) Perucho, M. & Bosch-Ramon, V. 2008, A&A, 482, 917
- Ribó et al. (2008) Ribó, M., Paredes, J. M., Moldón, J., Martí, J., & Massi, M. 2008, A&A, 481, 17
- Romero et al. (2003) Romero, G. E., Torres, D. F., Kaufman Bernadó, M. M., & Mirabel, I. F. 2003, A&A, 410, L1
- Romero & Vila (2008) Romero, G. E. & Vila, G. S. 2008, A&A, 485, 623
- Segreto & Ferrigno (2006) Segreto, A. & Ferrigno. 2006, in Proc. of the 6th INTEGRAL Workshop ”The Obscured Universe”, Moscow on 2-8 July 2006, ed. S. Grebenev, R. Sunyaev, & C. Winkler, p.633
- Sierpowska-Bartosik & Torres (2007) Sierpowska-Bartosik, A. & Torres, D. F. 2007, ApJ, 671, L145
- Torres & Sierpowska-Bartosik (2008) Torres, D. F. & Sierpowska-Bartosik, A. 2008, ArXiv e-prints, 0810.4435
- Ubertini et al. (2003) Ubertini, P., Lebrun, F., Di Cocco, G., et al. 2003, A&A, 411, L131
- Vedrenne et al. (2003) Vedrenne, G., Roques, J.-P., Schönfelder, V., et al. 2003, A&A, 411, L63
- Winkler et al. (2003) Winkler, C., Courvoisier, T. J.-L., Di Cocco, G., et al. 2003, A&A, 411, L1