Equilibrium Shape and Size of Supported Heteroepitaxial Nanoislands
Abstract
We study the equilibrium shape, shape transitions and optimal size of strained heteroepitaxial nanoislands with a two-dimensional atomistic model using simply adjustable interatomic pair potentials. We map out the global phase diagram as a function of substrate-adsorbate misfit and interaction. This phase diagram reveals all the phases corresponding to different well-known growth modes. In particular, for large enough misfits and attractive substrate there is a Stranski-Krastanow regime, where nano-sized islands grow on top of wetting films. We analyze the various terms contributing to the total island energy in detail, and show how the competition between them leads to the optimal shape and size of the islands. Finally, we also develop an analytic interpolation formula for the various contributions to the total energy of strained nanoislands.
pacs:
81.10.Aj, 68.55.Ac, 68.35.GyI Introduction
The shape and size of adatom islands resulting from growth processes has been a subject of numerous recent experimental and theoretical studies politi00 ; daruka99 ; daruka02 ; Wang2000 ; zangwill93 ; uemura02 ; katsuno05 ; Johnson97 ; spencer01 ; tersoff84 ; Budiman ; Chen1998 ; Rudin1999 ; Combe2001 . In the case of Stranski-Krastanow (SK) growth mode with islands growing on top of a wetting film, the relative abundances of different crystal shapes in a distribution show clear peaks at certain volumes, known as optimal sizes or magic numbers. In particular, when the growing islands are of nanoscopic size the central issue is the possible spontaneous self-organization of islands into arrays with a narrow size distribution. Such cases offer immediate technological applications in modern nanotechnology.
In spite of numerous publications in this field published in recent years some aspects of such self-assembly process are still not quite clear. In particular, there are still uncertainties as to whether the observed shapes and sizes of growing islands in heteroepitaxy correspond to thermodynamic equilibrium state of minimum free energy or limited by kinetic effects.
In this paper, we examine the minimum energy configuration of an array of islands with the given constraint of a fixed number of adsorbate atoms and with a fixed island density determined by initial growth conditions Wang2000 . There are various physical mechanisms leading to the optimal size and shape of the islands. Among them are the relevant surface tensions, adsorbate substrate bonding, elastic relaxation in the island, wetting film thinning and nonlinear elastic contributions, such as bending, buckling and dislocations etc. Parry06 ; Spencer00 ; spencer01 The wetting film and substrate can also mediate elastic dipole interactions between the islands, which can play an important role Shchukin1995 .
Most of the previous theoretical investigations of this problem employ a continuum approach to treat the elastic properties of the adsorbate and substrate. In addition, a predefined set of facets is usually assumed for the islands together with a somewhat arbitrary separation of surface and bulk terms in total energy expression.
The accuracy of these approaches for nanosized islands is yet to be determined Spencer03 ; Miller00 . To avoid any such approximations, in this work we use a fully atomistic model allowing for both elastic and plastic strain relaxation without assumptions on predefined shapes. To find the ground state of the atomistic systems we apply here the molecular static approach, which corresponds to the zero temperature limit. We adopt a two-dimensional (2D) model, but extension of many of the results presented here to the more realistic 3D systems is also possible. The reduced dimension allows to study all the possible configurations within feasible computer time.
This paper is organized as follows. First, we focus on a few specific island shapes found for various material parameters by searching for the minimum energy configuration in the small size limit. Then by focusing on these island shapes and by varying the misfit and the substrate-adsorbate interactions, we find configurations corresponding to the commonly known different modes of adsorbate growth, Frank-Van der Merwe (FM), Stranski-Krastanow (SK) and Volmer-Weber (VW). For the SK mode, we demonstrate the existence of optimal size and shape for the islands and study how they vary with the coverage of the adsorbate. We discuss the physical mechanisms that give rise to the narrow distribution of the optimal shape and size. Finally, we present an interpolation formula for the total energy which yields an accurate description of the phase diagram and optimal size and shape of the island in comparison with the numerical data. Moreover, this formula allows a clear interpretation of the various competing strain energy relaxation mechanisms.
II Model and Methods
In this work, we adopt a 2D classical atomistic model jalkanen05 ; tru02a ; tru02b , which has been previously used to study microscopic mechanisms for strain relaxation in thin films. This model also allows for an straightforward extension to the more realistic 3D case Trushin06 .
Within the model atomistic system is relaxed through standard MD cooling procedure and different island shapes are systematically compared for finding minimal energy shapes. In 2D all relevant island configurations can be studied within a reasonable computer time. The model allows for both elastic and plastic strain relaxation in heteroepitaxial system without any assumptions on predefined shapes of the islands. Some of our results here are obtained for relatively small, nanoscopic islands up to a few hundred atoms in size, in order to examine deviations from the continuum theory of elasticity Daruka1997 ; daruka99 ; daruka02 .
To allow easy adjustability and anharmonic effects, the interactions between all atoms in the system are described by a modified Lennard-Jones (LJ) pair potential zhen83 with two parameters, namely the dissociation energy and the atomic equilibrium distance
| (1) |
where
| (2) |
The modification ensures that the potential and its first derivative vanish at the cutoff distance . The index stands for substrate–substrate , substrate–film or film-film respectively.
The parameter for the adsorbate-substrate interaction is simply set as the average of the film and substrate lattice constants, i.e. . The lattice misfit between the adsorbate and the substrate can be defined as
| (3) |
A positive mismatch corresponds to compressive strain and negative to tensile strain when the adsorbate island is coherent with the substrate.
As for the interaction parameters, the film–film and substrate–substrate interactions are set to be equal, with . The film substrate interaction can be parameterized by defined as
| (4) |
A negative value of corresponds to an effectively attractive and positive to a repulsive substrate.
Calculations were performed with periodic boundary conditions for the substrate in the direction parallel to the adsorbate-substrate interface. The size of the unit cell (measured in units of substrate lattice constant ) determines the density of the islands in the SK and VW regime. Two bottom layers of the substrate were held fixed to energy minimize a semi-infinite substrate while all other layers were free to relax. In most calculations the thickness of the substrate was layers, and additional tests were carried out to ensure that the thickness did not influence the results.
III Results
III.1 Phase Diagrams in the Submonolayer Regime
The first issue of interest concerns the equilibrium shapes of small islands in the submonolayer regime. In Ref. jalkanen05 we presented a complete phase diagram as a function of the misfit and the total number of adsorbate atoms in this regime with It was found that there are four characteristic shapes A, B, C, and D as shown in Fig. 1. Of these the shape D, which was not predicted by continuum theory calculations Daruka1997 ; daruka98 ; daruka02 , was encountered only occasionally for larger volumes and misfits. Here, we present the corresponding results for the cases and , for and the size of the periodic cell . According to our tests, the interaction parameter is the most important factor in determining the various growth modes in equilibrium.

Following the procedure explained in Ref. jalkanen05 , we find the ground state shape of an island for a fixed total number of adsorbate atoms without assuming any predetermined shapes by a systematic search approach. Each coherent configuration is described by a set of integer numbers, specifying the number of atoms in successive island layers. In terms of these numbers, the two types of facets, considered in the previous works daruka99 ; daruka02 correspond to for steep facets and for shallow facets. The only physical restrictions we impose are that the island has a reflection symmetry about a line through the center and that overhangs are not allowed. Then, for each initial configuration, molecular dynamics (MD) cooling is run to allow the system to relax and reach a minimum energy configuration. The equilibrium shape for a given is identified as the relaxed island configuration with lowest energy among all the configurations.
 |
 |
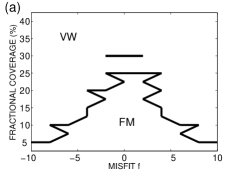
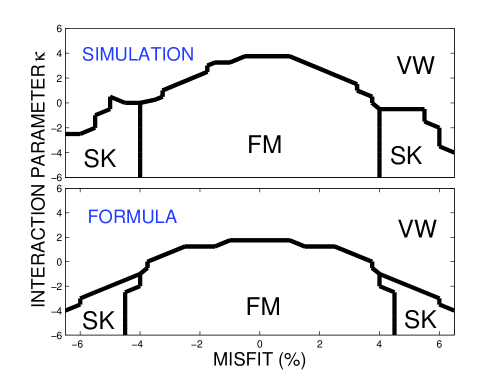
The phase diagram for the case where the substrate is repulsive with is shown in Fig. 2(a). As expected, island formation is enhanced as compared to the case where Even with zero misfit, island formation starts around and the wetting film disappears completely beyond . We detect no new island shapes or any occurrences of the shape D.
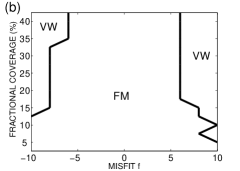
The results above should be contrasted to the case of an attractive substrate with in Fig. 2(b). Complete wetting regime dominates the phase diagram almost up to the largest values of mismatch considered here. As for the shape of the islands, all but one case belong to the categories A and C. The single exception at and falls in the category D. We also note that as in Ref. jalkanen05 , the phase diagrams here are asymmetric with respect to tensile and compressive strain highlighting the importance of the anharmonicity of the atomic interaction potentials.
III.2 Global Phase Diagram at Higher Coverage
At higher coverages with it is possible to have in addition to the partial wetting film (FM) and small island (VW) phases also the phase where islands grow on top of wetting films (SK).
We have calculated the global phase diagram (GPD) as shown in Fig. 3 for and (coverage layers) in the plane, where and . Numerical data for this diagram have been taken with steps of along both axes.
Following the approach of Scheffler et al. Pehlke1997 ; Moll1998 ; Wang1999 ; Wang2000 , the growth process can be divided into different stages. The early nucleation stage mainly determines the island density. In our model, this is fixed by the size of the unit cell which is inversely proportional to the island density. The second stage is where the islands can grow at the expense of the wetting layers. The main driving force here is a pathway to lower the strain energy while not sacrificing too much the adsorbate–substrate interface bonding energy.
The data in Fig. 3 are calculated by the following steps. For a fixed at we investigated all configurations corresponding to an island with shape corresponding to A, B or C as shown in Fig. 1, together with any number of complete wetting film layers and at most one partial wetting film layer (layers which are more than seven atoms wider than the island base are counted as partially filled wetting layers). The initial configuration has the equilibrium lattice constant of the substrate. When the energy of the system is minimized with molecular dynamics cooling, the adsorbate releases strain energy by relaxation. This local minimization technique does not lead to plastic deformations in this parameter range. Each point of Fig. 3 corresponds to a relaxed configuration with the lowest energy.
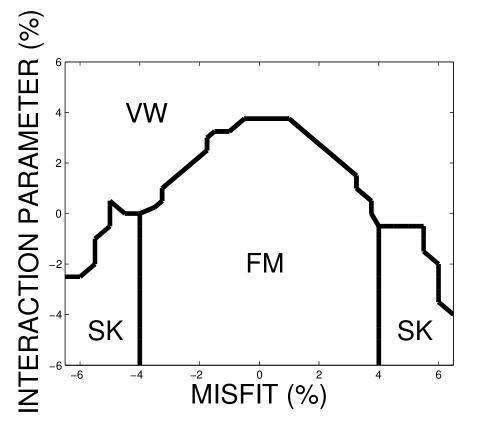
As can be seen in Fig. 3, two well-known phases already identified in the submonolayer regime are present in different regions of the phase diagram for the higher coverage situation: the Frank-van der Merwe (FM) phase dominates for relatively small misfits and attractive substrate interactions while the Volmer-Weber (VW) phase is favored for larger misfits and posive values of As the lattice misfit increases, there is a transition from wide, relatively thin islands to sharper forms.
However, perhaps the most interesting feature of the phase diagram for coverages beyond two layers is the appearance of the Stranski-Krastanov (SK) regime for large misfits and negative values of In the SK regime, islands exist on top of wetting films. With the present interaction parameters, the SK phase lies between and The triple points separating the phases are located approximately at and . Again, the phase diagram is asymmetric between tensile and compressive strain values, even for relatively small values of
We have numerically calculated the global phase diagrams for other values of and and the results are very similar. For coverage , the phase boundary between the FM and SK regimes becomes less well defined. However, for the changes to Fig. 3 are minor; the positions of the triple points seem to move to smaller values of
III.3 Optimal Shape and Size for Islands in the SK Mode
For technological applications, it would be desirable to have a self-organized array of islands which has a very narrow size and shape distribution function. Experimentally, such “optimal” island sizes have been observed in some heteroepitaxial systems Jubert01 ; Fruchart06 ; Silly05 ; Hansen99 . The basic question is whether the optimal size islands correspond to equilibrium minimum energy configurations, or are they just a consequence of kinetic limitations that prevent further growth on accessible time scales. The existence of optimal shapes from purely energetic considerations has been proven for some specific systems such as those in Refs. Golovin04 ; Shchukin1995 ; Chiu04 ; Wang1999 . In Fig. 4, we define a number of parameters which characterize the shape and size of the island and the wetting film. The height of the island and the wetting film are denoted by and respectively. The island–island separation, which equals the width of the periodic simulation cell is denoted by and the island base width is A schematic diagram is shown in Fig. 4.

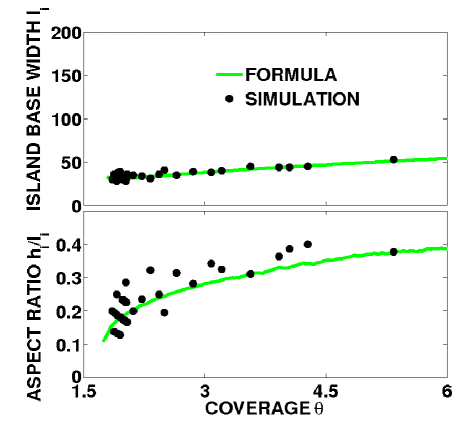
We have investigated the optimal shapes and sizes of the islands in the SK mode for the misfit parameter and interaction parameter as a function of different amounts of adsorbate , for an island density corresponding to . The results are shown in Fig. 5. At low coverages the atoms completely wet the substrate and form wide, non-wetting islands after which the actual SK regime emerges. For coverage , both the base width and the aspect ratio of the island increase slowly with coverage. Typically, the adsorbate forms a combination of one full and one incomplete wetting layer together with an island of shape A.
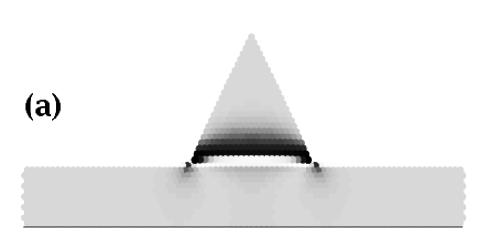
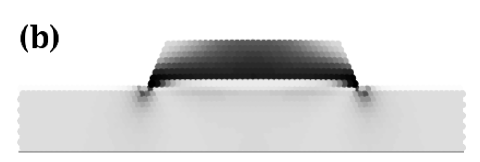
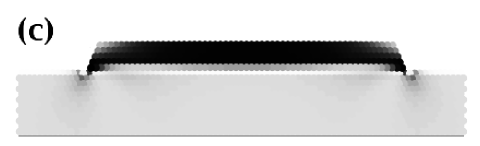
To understand the strain relaxation in the SK phase, we select the point from Fig. 5 corresponding to total number of adatoms . The optimal shape and size of the island in this case has and on top of one complete layer of wetting film, see panel (b) of Fig. 6. In addition to this configuration, we show the spatial energy distribution of the totally relaxed configurations for two other geometries selected from the high and low aspect ratio ends of the shape spectrum, namely configurations with and respectively. The strain patterns of these different configurations are shown in panels (a) and (c) of Fig. 6. We note from these three geometries that the strain pattern falls into two different categories. For the large aspect ratio ( ), except for the immediate adsorbate substrate interface region, the bulk of the island is largely relaxed. In the other limit of a small aspect ratio ( ), except for the surface and corner region, most of the atoms inside the island are strained. For small islands, the relaxation favors sharp islands but the adsorbate–substrate interface bonding energy and the surface energy favor wide islands. It turns out that the most efficient way of lowering the strain energy while still maintaining a strong interface bonding energy is to pick a geometry in between these two extremes. This balance determines the aspect ratio and the optimal shape of the island. When the coverage increases, the total strain energy can be lowered by allowing the size of the island to increase at the expense of reducing the thickness of the wetting film. The optimal size of the island results from the balance between the strain relaxation of larger island and the “thinning” energies of the wetting film. Another factor that contributes to determining the optimal size of the island is the indirect interaction between the islands mediated by the substrate relaxation. These points are discussed in more detail in next section.
IV Analytic Interpolation Formula for Total Energy
In this section, we will look in more detail into the various competing mechanisms leading to the existence of an optimal size and shape for the islands in the SK regime. We also develop an approximate analytic interpolation formula that incorporates all these mechanisms and allows a simple interpretation of our numerical data. Our approach is in many respects similar to those in Refs. uemura02 ; katsuno05 ; Combe2001 ; Thibault2004 .
IV.1 Reference Energy
To develop an analytic interpolation formula, we first choose a reference system corresponding to a completely unstrained substrate and completely strained adsorbate such that the in-plane spacing between atoms in each layer of the island is the same as that in the substrate. This reference system has three kinds of bonds: unstrained, strained and substrate–adsorbate interface bonds. The corresponding energies are for unstrained bonds and and for horizontal and vertical adsorbate bonds, respectively. The substrate–adsorbate interface bonds, which are vertical, are denoted by These are obtained from Eq. (1), and the details are given in the Appendix.
| Contribution | Expression |
|---|---|
| Substrate bulk | |
| Adsorbate bulk | |
| Surfaces : | |
| Substrate-vacuum | |
| Wetting film-vacuum | |
| Oblique facet-vacuum | |
| Island top-vacuum | |
| Substrate-adsorbate |
The bulk contributions and for the substrate and adsorbate are proportional to the number of atoms in the adsorbate and substrate, respectively. In addition, each surface and interface leads to a correction term due to missing or changed bond energies, resulting in a total surface energy For the wetting film, partial layers are allowed to account for the situation where the number of atoms in the wetting film deviates from multiples of All corner energies are neglected. The different contributions to and in terms of the bond energies and are listed in Table 1 above.
IV.1.1 Relaxation Energy of Island
The total energy of a fully strain relaxed island can now be written as , where is the relaxation energy. As the panel (c) of Fig. (6) shows, the relaxation is seen only in the vicinity of the non-horizontal facets when the island aspect ratio is low. In this situation the top facet and the interior are both completely stressed. When the qualitative pattern of relaxation is of this kind, the energy difference has to become practically independent of the island width for a set of islands with the same height. If we consider the islands with constant height in the high aspect ratio case, the panel (a) of Fig. (6) shows that the relaxation energy should depend almost linearly on the width.
To quantitatively verify this, we study a set of islands with different values of island base widths and island heights The wetting layer thickness and the ratio are kept constant with and . This value of is large enough so that the interaction energy between islands is negligible at this separation. The chosen island heights are and The base widths for each height are chosen with a denser mesh near the large aspect ratio limit and with a sparser mesh in the small aspect ratio, shallow island limit. The energy of the island in each case is minimized and then the additional relaxation energy is obtained after the subtraction of the reference energy. The numerical data of the extra relaxation energy for the entire set of islands with different aspect ratios can be fitted to a simple analytic form which has the properties described above, namely
| (5) |
The first term in Eq.(5) represents the relaxation energy in the shallow island (small aspect ratio) limit, which can be fitted to a form independent of given by
| (6) |
Here the term in is related to the volume relaxation and the term linear in comes from the surface relaxation of the shallow island. It should be noted that when the island base is in the regime where depends only weakly on and the height becomes large, Eq. (6) breaks down. In this large volume limit the term is linearly dependent on i.e. it has turned into a correction to the surface energy of the vertical island facets.
The other variables , , and of Eq. (5) are functions of the height of the island and the numerical fit of these variables are given in Table 2. The value of defines a crossover between the shallow island limit and the sharp island limit where the qualitative nature of the relaxation pattern in the island changes. For a fixed , the energy of the island starts to increase sharply when is reduced below the threshold value which is a function of .
To keep the analysis simple, we have not included small contributions to the total energy, such as corner energies and stretching energy of the adsorbate–substrate interface in the interpolation formula. There exist rare circumstances when these effects can become important and in these cases the formula does not hold.
It should be noted that at some coverage the island volume becomes necessarily so large that the relaxed neighborhoods of the left and right facets do not overlap even in the equilateral case. In this limit the relaxation energy is proportional to the length of the non-horizontal facets and can be adsorbed to the corresponding surface tensions. In this case the above formula is not expected to hold.
A similar study concerning the stability of strained heteroepitaxial systems has been conducted in Ref. Thibault2004 . They find that an island array is unstable in all the cases considered. The main difference to our study is that we do not assume the island-island distance to be fixed by the interaction between the islands but by the nucleation stage, as in Refs. Moll1998 ; Wang1999 ; Wang2000 .
| Parameter | Expression |
|---|---|
IV.1.2 Comparison of Numerical Data with Interpolation Formula
In this section, we will use the interpolation formula obtained in the previous section to examine the global phase diagram and determine the optimal sizes and shapes of the islands in the SK regime. First, we examine the global phase diagram. For this purpose, we fix the total number of adsorbate atoms and determine the minimum energy configuration as a function of the misfit parameter and interaction parameter by comparing the total energies of different configurations. Note that the reference energy already has a dependence on and For the additional relaxation energy we take the formula, which was fitted for We verified numerically that in the first approximation it scales with the misfit as and neglect its dependence on Footnote1 . The resulting GPD as shown in Fig. 7 is very close to the one obtained from the direct energy minimization as shown in Fig 3. The disagreements have generally three sources.
First, the interpolation formula is constrained to islands of shape A in some points of the phase diagram. This can lead to two kinds of differences. As we showed earlier, when all configurations are compared with the direct minimization, the lowest energy shape is almost always among A, B, or C shapes so that the extra facets in the B and C shapes are of the shortest possible length. However, at some coverages the combinatorics limits the number of these three shapes to be fairly small. It can happen that these shapes are also of extremal widths or thicknesses whose leading energy contributions are out of the average range. Under these circumstances the configuration space would be sampled better by allowing the shapes to have some asymmetry or additional facets at the corners. This finite size effect is relevant for small island volumes only, and as we showed it is not very significant even in this regime. Anyhow, if the interpolation formula is minimized analytically, the configuration space is continuous and does not suffer from this finite size effect. Another kind of difference originating from the same source is the fact that sometimes the small terms (such as the corner energy) not present in the formula can force the direct energy minimization to switch to a wider island width at a lower coverage than what the interpolation formula gives. This can reduce the island height by one and increase the width by two layers but the effect is not cumulative and cannot separate the direct minimization and interpolation results far apart.
Second, close to the critical coverage separating two growth modes the energies of very different configurations, such as a flat layer and an island, are comparable. In this kind of situation the small energy terms not present in the interpolation formula can actually determine the energy balance and the real lowest energy shape is therefore not detected by the formula. However, when the coverage is outside the transition lines these cases become irrelevant.
Third, the analytic formula is less reliable in the large aspect ratio limit (sharp islands) with high coverages. The height dependence of the parameters is fitted for the small island limit where the surface and bulk energetics are not clearly separable. With sufficiently large island volume the relaxation becomes clearly associated with the island facets and in this case the relaxation energy must be directly proportional to the length of the associated facets. Since in this case the stress energy cost increases proportionally to the island volume, dislocations nucleation becomes relevant; an effect which is not included in the present model. In this limit also the validity of the scaling of the relaxation energy breaks down.
Finally, we should also mention that the island–island interaction energy is neglected in the present interpolation formula. However, we have checked that this effect is negligible at a unit cell length of and does not affect the results.
Next, we investigate the optimal size and shape of the islands in the SK regime for the parameters and For this purpose, we take the interpolation formula for derived for a fixed thickness for the wetting film and apply it to configurations for other values of wetting film thickness. This amounts to neglecting the wetting film thinning energy and is only expected to be valid in the low coverage limit. We vary the size and aspect ratio of the island for a given coverage through choosing different values for and The corresponding value for the thickness of the wetting film is then determined by the constraint of the total amount of the adsorbate material being constant. The total energy expression is minimized to yield the optimal value of and , which determine the optimal size and shape for a given coverage.
In Fig. 5 we show the island base width and aspect ratio as a function of the coverage. The predicted optimal island base widths from the direct numerical calculation and those obtained from the total energy minimization with the interpolation formula are close. The optimal aspect ratios determined from the direct minimization and from the interpolation formula have the same qualitative coverage dependence.
V Summary and Conclusions
In this work, we have investigated the various phases resulting from the relaxation of strain energy starting from initial epitaxial strained adsorbate wetting films. We employ the molecular static method which is a powerful tool to overcome the restrictions related to conventional minimization methods that rely on the continuity and differentiability of the underlying manifold. In this work the phase diagram of 2D heteroepitaxial thin film systems was obtained by direct minimization for various combinations of the lattice misfit and parameter describing the interface tension. In the submonolayer regime, the Stranski-Krastanow (SK) phase is not present, but a transition between layer-by-layer (FM) equilibrium shapes and Volmer-Weber (VW) shapes is sensitive to the value of As the adsorbate coverage increases, the SK phase appears between the FM and VW regions when had a value that was favorable for the contact between substrate and adsorbate. The islands always have truncated pyramid shapes with minor edge defects.
In the SK regime, we have investigated the important issue concerning the optimal shape and size of islands by searching through the minimum energy configurations of systems for fixed material parameters and The shapes were restricted to truncated pyramids. The actual optimal size and aspect ratio depend on the coverage of the adsorbate atoms. Both the aspect ratio and the base width of the island increases slowly with coverage. To understand better the numerical results, an analytic interpolation formula was developed. This approximate formula takes into account the strain relaxation from a reference state of totally strained wetting films, adsorbate island and an unstrained substrate. It produces results that agree very well with the numerical energy minimization data.
The optimal shape and the aspect ratio result from a compromise of increasing the relaxation energy for a sharp (higher aspect ratio) island vs. increasing the adsorbate–substrate interaction for a shallow (low aspect ratio) island. The optimal size of the island grows as the coverage increases because a larger island is more effective in strain relaxation and lowering of the elastic energy. Eventually, when the base width of the island grows to be comparable with the unit cell size , the optimal island size will be determined by the substrate mediated indirect interaction between the islands, as suggested in Ref. Shchukin1995 . It is important to note that the details of the coverage dependence of the optimal size in our model differ somewhat from the results of Ref. Wang2000 , where the wetting film thinning energy was evaluated using a continuum approach and is finite at thickness even above two layers. In our model, the wetting film thinning energy implicitly present in both the interpolation formula and the numerical energy minimization is negligible until the last layer of wetting film starts to get depleted. Thus the optimal size at low coverages shown in Fig. 5 corresponds to the total adsorbate atoms minus one complete plus possible one partial wetting film layer.
Finally, we would like to discuss the applicability of our results for realistic 3D cases. While the fact that our global phase diagram correctly reproduces all the well-known growth modes in the relevant regimes indicates the overall validity of the model, there are several additional features in 3D, which need to be considered. Assuming no intermixing of the substrate and film atoms, the most important ingredient missing in 2D is the spatial anisotropy of various crystal surfaces. Recent experiments in 3D indicate Silly05 that changing the mismatch of the substrate can induce significant morphological changes in 3D islands. For the close-packed (111) surface geometry, which most closely corresponds to the 2D case studied here, we have done minimization of selected island shapes and find that there are stable island configurations, which are straightforward 3D generalizations of the 2D shapes found here. However, a systematic search for optimal 3D nanoisland shapes is computationally very expensive and beyond the scope of the present work.
VI Acknowlegdements:
This work acknowledges joint funding under EU STRP 016447 MagDot and NSF DMR Award No. 0502737. J.J. and T.A-N. acknowledge support from the Academy of Finland through its Center of Excellence COMP grant and from Finnish Center of Scientific Computing (CSC) through computing resources. J.J. also acknowledges support from the Foundation of Vilho, Yrjö ja Kalle Väisälän rahasto of Finnish Academy of Science and Letters. E.G. acknowledges support from FAPESP under Grant No. 07/08492-9.
VII Appendix: Bond Energies In Epitaxial Strained Film
An adsorbate bulk atom has two horizontal and four diagonal bonds, the energies of which are denoted by and respectively. The horizontal distance of the atoms in a coherent adsorbate layer is and the equilibrium distance is The energy of a horizontal bond in the reference state is thus In a hexagonal lattice with pair potential the Poisson ratio is always Thus, the ratio of vertical and horizontal strains and is
| (7) |
or
| (8) |
where is the actual distance between adjacent horizontal layers in a strained adsorbate and is the corresponding equilibrium distance, This gives
| (9) |
The length of the diagonal bond in the initial strained film is given by the relation and energy of the bond is given by of Eq. (1) with the argument
The bond strength between the substrate and adsorbate can be easily obtained from the adsorbate bond with two modifications. First, the misfit parameter is replaced by and then the overall strength is multiplied by a factor The first modification arises from the fact that the equilibrium distance between the substrate and adsorbate atom is the arithmetic mean of the equilibrium distances between pure materials and the second follows from the definition of relating the strength of the film–substrate interaction to the film–film interaction.
References
- (1) P. Politi, G. Grenet, A. Marty, A. Ponchet, and J. Villain, Phys. Reports 324, 271 (2000).
- (2) I. Daruka, J. Tersoff, and A.-L. Bara’bási, Phys. Rev. Lett. 82, 2753 (1999).
- (3) I. Daruka and A.-L. Bara’bási, Appl. Phys. Lett. 72, 2102 (1998).
- (4) I. Daruka and J. Tersoff, Phys. Rev. B 66, 132104 (2002).
- (5) I. Daruka and A.-L. Bara’bási, Phys. Rev. Lett. 79, 3708 (1997).
- (6) N. Moll, M. Scheffler and E. Pehlke, Phys. Rev. B, 58, 4566 (1998).
- (7) L.G. Wang, P. Kratzer, N. Moll, and M. Scheffler, Phys. Rev. B 62, 1897 (2000).
- (8) L.G. Wang, P. Kratzer, M. Scheffler and N. Moll, Phys. Rev. Lett. 82, 4042 (1999).
- (9) C. Ratsch and A. Zangwill, Surf. Sci. 293, 123 (1993).
- (10) H.T. Johnson and L.B. Freund, J. Appl. Phys. 81, 6081 (1997).
- (11) B.J. Spencer and J. Tersoff, Phys. Rev. B 63, 205424 (2001).
- (12) J. Tersoff and F.K. LeGoues, Phys. Rev. Lett. 72, 3570 (1994).
- (13) R. A. Budiman and H.E. Ruda, J. Appl. Phys. 88, 4586 (2000).
- (14) A. Ponchet, A. Le Corre, H. L’Haridon, B. Lambert, S. Salan, D. Alquier, D. Lacombe and L. Durand, Appl. Surf. Sci. 123, 751 (1998).
- (15) H. Uemura, M. Uwaha and Y. Saito, J. Phys. Soc. Japan 71, 1296 (2002).
- (16) H. Katsuno, H. Uemura, M. Uwaha, and Y. Saito, J. Crystal Growth 275, 283 (2005).
- (17) S. Zhen and G. J. Davies, Phys. Stat. Sol. A78, 595 (1983).
- (18) O. Trushin, E. Granato, S.-C. Ying, P. Salo and T. Ala-Nissila, Phys. Stat. Sol. B, 232, 100 (2002).
- (19) O. Trushin, E. Granato, S.-C. Ying, P. Salo and T. Ala-Nissila, Phys. Rev. B 65, 241408(R) (2002); Phys. Rev. B 68, 155413 (2003).
- (20) J. Jalkanen, O. Trushin, E. Granato, S.C Ying, T. Ala-Nissila, Phys. Rev. B 72, 081403(R) (2005).
- (21) O. Trushin et al., unpublished (2008).
- (22) N. Combe, P. Jensen and J.-L. Barrat, Surf. Sci. 490, 351 (2001).
- (23) D. J. Eaglesham and M. Cerullo, Phys. Rev. Lett. 64, 1943 (1990).
- (24) V. A. Shchukin, A.I. Borovkov, N.N. Ledentsov and P.S. Kop’ev, Phys. Rev. B 51, 17767 (1995).
- (25) A. A. Golovin, M. S. Levine, T. V. Savina and S. H. Davis, Phys. Rev. B 70, 235342 (2004).
- (26) C. H. Chiu, Phys. Rev. B 69, 165413 (2004).
- (27) P. Thibault and L. J. Lewis, Phys. Rev. B 70, 035415 (2004).
- (28) E. Pehlke, N. Moll, A. Kley and M. Scheffler, Appl. Phys. A 65, 525 (1997).
- (29) C. D. Rudin and B. J. Spencer, J. Appl. Phys. 86, 5530 (1999).
- (30) V. M. Kaganer and K. H. Ploog, Phys. Rev. B 64, 205301 (2001).
- (31) P. O. Jubert, O. Fruchart and C. Meyer, Phys. Rev. B 64, 115419 (2001).
- (32) O. Fruchart, P. O. Jubert, M. Eleoui, B. Borca, P. David, V. Santonacci, A. Liènard, M. Hasegawa and C. Meyer, J. Phys.: Condens. Matter 19, 053001 (2007).
- (33) B. J. Spencer, P. W. Voorhees, and J. Tersoff, Phys. Rev. Lett. 84, 2449 (2000).
- (34) F. Silly and M. R. Castell, Phys. Rev. Lett. 94, 046103 (2005).
- (35) K. Højrup Hansen, T. Worren, S. Stempel, E. Lægsgaard, M. Bäumer, H.-J. Freund, F. Besenbacher and I. Stensgaard, Phys. Rev. Lett. 83, 4120 (1999).
- (36) G. Parry, A. Cimetière, C. Coupeau, J. Colin, and J Grilhé, Phys. Rev. E 74, 066601 (2006).
- (37) B.J. Spencer and J. Tersoff, Appl. Phys. Lett. 77, 2533 (2000).
- (38) A. C. Schindler, M. F. Gyure, G. D. Simms, D. D. Vvedensky, R. E. Caflisch, C. Connell, and E. Luo, Phys. Rev. B 67, 075316 (2003).
- (39) R. E. Miller and V. B. Shenoy, Nanotechnology 11, 139 (2000).
- (40) By calculating for several values of and we saw that the misfit-dependence of is essentially a shape-independent prefactor. Furthermore, we verified that other terms than can be safely omitted. It is possible that this kind of misfit scaling is a feature of the present model. We also varied and found that the dependence of on is orders of magnitude too small to have any relevance here.