The nuclear track detector CR39: results from different experiments
Abstract
Abstract. The nuclear track detector CR39 was calibrated with different ions of different energies. Due to the low detection threshold () and the good charge resolution ( for with 2 measurements), the detector was used for different purposes: fragmentation of high and medium energy ions; search for magnetic monopoles, nuclearites, strangelets and Q-balls in the cosmic radiation.
1 INTRODUCTION
When an ionizing particle crosses a Nuclear Track Detector (NTD) sheet, it produces damages at the level of polymeric bonds around its trajectory, forming the so-called “latent track”. For a particle with charge and velocity the damage depends on the ratio .
The chemical etching in a basic solution results in the formation of etch-pit cones in both faces of the sheet. The formation of etch-pit cones is regulated by the bulk etching rate, , and the track etching rate, , i.e. the velocities at which the undamaged and damaged materials are removed. Etch-pit cones are formed if . The response of the detector is given by the ratio as a function of the Restricted Energy Loss (REL).
The poly-allyl-diglycol carbonate polymer, commercially known as CR39, is the most sensitive NTD. It is sensitive for a wide range of charges down to in the low velocity and in the relativistic regions [1, 2, 3] and can reach a charge resolution [4]. CR39 was used to search for exotic particles, like Magnetic Monopoles and Strange Quark Matter (SQM) [5, 6], to study cosmic ray composition [7] and for environmental studies [8].
In this paper the results of some applications of CR39 NTD are presented.
2 CR39 CALIBRATIONS
A stack composed of CR39 and Makrofol sheets of size cm2 with a 1 cm thick lead target was exposed to 158 A GeV Pb82+ ions in 1996; a second stack with a 1 cm thick aluminum target was exposed to 158 A GeV In49+ ions in 2003. Both exposures were performed at the CERN-SPS, at normal incidence and density of 2000 ions/cm2. The detector sheets before and after the target recorded respectively the incident beam ions and the ones exiting from the target, together with their nuclear fragments.
After exposures, two CR39 sheets located after the target were etched in 6N NaOH + 1% ethyl alcohol solution at 70 ∘C for 40 h [9]. The addition of ethyl alcohol in the etchant improves the etched surface quality, reduces the number of surface defects and background tracks, increases the bulk etching velocity, speeds up the reaction, but raises the detection threshold.
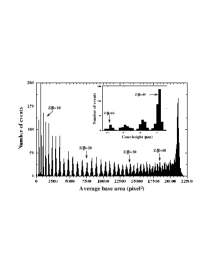
For each CR39 sheet, the etch-pit base areas for beam ions and their fragments were measured with the Elbek automatic image analyzer system [10]. Averages were computed from measurements made on the “front sides” of the detector sheets. The peaks are well separated from to in the lead case [11] and to for the indium case [9]. The charge resolution close to the beam peak can be improved by measuring the heights of the etch-pit cones. The heights of 1000 etch-pit cones corresponding to nuclear fragments close to the beam peaks were measured with an accuracy of m with a Leica microscope coupled to a CCD camera and a video monitor. The corresponding distributions [9, 11] show that each peak is well separated from the others, and a charge can be assigned to each one. Fig. 1(Left) shows the average (2 faces) base area distribution of etched cones in CR39 from In49+ ions and their fragments. In the insert the cone height distribution for is shown.
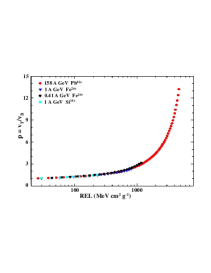
For each detected nuclear fragment and for the beam ions we computed the REL and the reduced etch rate . Fig. 1(Right) shows a summary of CR39 calibrations with different ions and energies. Notice that a unique calibration curve describes all the data.
3 FRAGMENTATION CROSS SECTIONS OF Fe26+, Si14+ AND C6+ IONS ON DIFFERENT TARGETS
The availability of ion beams at the Brookhaven National Laboratory (BNL), USA, and at the Heavy Ion Medical Accelerator in Chiba (HIMAC), Japan, facilities made possible to investigate the projectile fragmentation on different targets and for different projectile energies. The present study is focused on Fe26+, Si14+ and C6+ ion interactions in CH2, CR39 and Al targets.
Stacks composed of several CR39 sheets of size cm2 and with different targets were exposed to 0.3, 1, 3, 5 and 10 A GeV Fe26+, 1, 3, 5 A GeV Si14+ ions at the BNL Alternating Gradient Synchrotron (AGS) and NASA Space Radiation Laboratory (NSRL). The exposures to 0.41 A GeV Fe26+ and 0.29 A GeV C6+ ions were performed at HIMAC. For more details see [2].
We used three and four CR39 sheets, 0.7 mm thick, placed before and after the target, respectively. The exposures were done at normal incidence, with a density of 2000 ions/cm2. After exposures, the CR39 sheets were etched in 6N NaOH aqueous solution at 70 ∘C for 30 h.
The total charge changing cross sections were determined from the survival fraction of ions using the following relation
| (1) |
where is the nuclear mass of the target (average nuclear mass in case of polymers: ); and are the numbers of incident ions before and after the target, respectively; (g/cm3) is the target density; (cm) is the target thickness and is Avogadro number.
The average track base area was computed for each reconstructed ion path by requiring the existence of signals in at least two out of three detector sheets. The charge resolution was about . The numbers of incident and survived beam ions were determined considering the mean area distributions of the beam peaks before and after the target and evaluating the integral of the gaussian fit of the beam peaks.
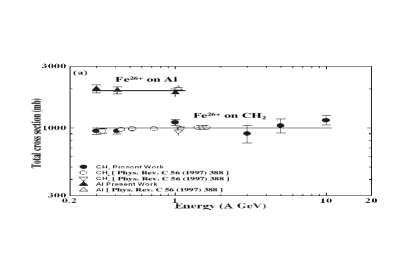
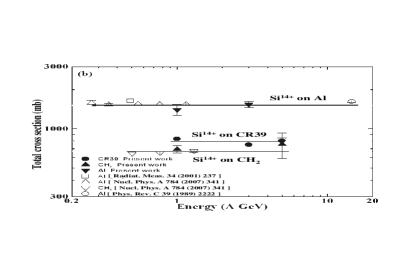
Fig. 2 shows the beam energy dependence of the total charge changing cross sections of (a) Fe26+ projectiles on the CH2 and Al targets and (b) Si14+ projectiles on the CH2, CR39 and Al targets. Our data are almost energy independent, in agreement with the data from refs. [12] and with the predictions of the semi-empirical formula [13] for nuclear cross sections (solid lines).
4 SEARCH FOR RARE PARTICLES
The SLIM (Search for LIght Monopoles) experiment was an array of NTDs with a total area of 427 m2 exposed for 4.22 years at the Chacaltaya laboratory in Bolivia at 5230 m a.s.l. [5, 14]. The array was organized into 7410 modules, each of area cm2. All modules were made up of: three layers of CR39, each 1.4 mm thick; 3 layers of Makrofol, each 0.48 mm thick; 2 layers of Lexan, each 0.25 mm thick, and one layer of aluminum absorber 1 mm thick.
The main purpose of the SLIM experiment was the search for Intermediate Mass Monopoles (IMMs) with masses GeV [15]. These IMMs, predicted by some GUT and supersymmetric models, may have been produced in the early Universe and could be present in the cosmic radiation [16]. The SLIM detector was also sensitive to Strange Quark Matter nuggets [17] and Q-balls [18].
Since IMMs have a constant energy loss through the stacks, the subsequent chemical etching should result in collinear etch-pit cones of equal size on both faces of each detector sheet. In order to increase the detector “signal to noise” ratio different etching conditions [3, 9, 11] were defined. The strong etching (8N KOH + 1.5% ethyl alcohol at 75 ∘C for 30 hours) allows better surface quality and larger post-etched cones to be obtained. This makes etch-pits easier to detect under visual scanning. The soft etching (6N NaOH + 1% ethyl alcohol at 70 ∘C for 40 hours) allows to proceed in several etching steps and study the formation of the post-etched cones.

The analysis of a SLIM module started by etching the uppermost CR39 sheet using strong conditions in order to reduce the CR39 thickness from 1.4 mm to mm. After the strong etching, the CR39 sheet was scanned twice, with a stereo microscope, by different operators, with a 3 magnification optical lens, looking for any possible correspondence of etch pits on the two opposite surfaces. The measured single scan efficiency was about 99%; thus the double scan guarantees an efficiency of for finding a possible signal.
A track was defined as a “candidate” if the computed momentum and incident angle on the front and back sides were equal to within 20%. In this case the lowermost CR39 layer was etched in soft etching conditions, and an accurate scan under an optical microscope with high magnification (500 or 1000) was performed in a square region around the candidate expected position, which included the “coincidence” area (0.5 cm2). If a two-fold coincidence was detected, the CR39 middle layer was also analyzed.
Since no candidates were found, the global 90% C.L. upper limits for the flux of downgoing IMMs and dyons with velocities were computed, as shown in Fig. 3. The flux limit for is cm-2 s-1 sr-1 [5].
The 90% C.L. upper limits for a downgoing flux of nuclearites and charged Q-balls is cm-2 s-1 sr-1 for [19].
5 CONCLUSIONS
The nuclear track detector CR39 was calibrated with different ions of different energies. A unique curve of vs REL describes all the data.
The total fragmentation cross sections for Fe26+, Si14+ and C6+ ions on polyethylene, CR39 and aluminum targets were measured using CR39. The total cross sections do not show any observable energy dependence and are in agreement with similar data in the literature.
In the SLIM experiment we etched and analyzed 427 m2 of CR39. No candidate passed the search criteria. The 90% C.L. upper limits for a downgoing flux of fast () downgoing IMMs are at the level of cm-2 sr-1 s-1. The same limits were obtained for nuclearites, strangelets and charged Q-balls with .
References
- [1] S. Cecchini et al., Nucl. Phys. A707 (2002) 513. H. Dekhissi et al., Nucl. Phys. A662 (2000) 207.
- [2] S. Cecchini et al., Nucl. Phys. A807 (2008) 206.
- [3] S. Cecchini et al., Rad. Meas. 34 (2001) 55.
- [4] S. Cecchini et al., Astropart. Phys. 1 (1993) 369.
- [5] S. Balestra et al., Eur. Phys. J. C55 (2008) 57.
- [6] M. Ambrosio et al., Eur. Phys. J. C25 (2002) 511.
- [7] T. Chiarusi et al., Rad. Meas. 40 (2005) 424.
- [8] S. Manzoor et al., Nucl. Phys. B Proc. Suppl. 172 (2007) 92.
- [9] S. Balestra et al., Nucl. Instr. Meth. B254 (2007) 254.
- [10] A. Noll et al., Nucl. Tracks Rad. Meas. 15 (1988) 265.
- [11] G. Giacomelli et al., Nucl. Instr. Meth. A411 (1998) 41.
- [12] C. Brechtmann et al., Phys. Rev. C39 (1989) 2222. F. Flesch et al., Rad. Meas. 34 (2001) 237. C. Zeitlin et al., Phys. Rev. C56 (1997) 388. C. Zeitlin et al., Nucl. Phys. A784 (2007) 341.
- [13] H.L. Bradt and B. Peters, Phys. Rev. 77 (1950) 54.
- [14] S. Cecchini et al., Il Nuovo Cim. 24C (2001) 639.
- [15] G. Lazarides and Q. Shafi, Phys. Lett. B148 (1984) 35. T.W. Kephart and Q. Shafi, Phys. Lett. B520 (2001) 313.
- [16] T.W. Kephart and T.J. Weiler, Astropart. Phys. 4 (1996) 271. C.O. Escobar and R.A. Vasquez, Astropart. Phys. 10 (1999) 197.
- [17] A. Witten, Phys. Rev. D30 (1984) 272. A. De Rujula and S.L. Glashow, Nature 312 (1984) 734.
-
[18]
S. Coleman, Nucl. Phys. B262 (1985) 263.
A. Kusenko et al., Phys. Lett. B418 (1998) 46. - [19] S. Cecchini et al., arXiv:0805.1797[hep-ex].